Elyria, OH (Ohio) Houses and Residents
Estimated median house or condo value in 2022: $141,649 (it was $92,800 in 2000 )
Elyria:
$141,649Ohio:
$204,100
Lower value quartile - upper value quartile: $97,222 - $192,581Mean price in 2022: Detached houses: $157,783 Here:
$157,783State:
$254,366
Townhouses or other attached units: $151,552 Here:
$151,552State:
$225,733
In 2-unit structures: $60,062 Here:
$60,062State:
$144,384
In 3-to-4-unit structures: $308,247 Here:
$308,247State:
$203,002
In 5-or-more-unit structures: $187,659 Here:
$187,659State:
$211,593
Mobile homes: $45,643 Here:
$45,643State:
$62,719
Total population: 53,972 (All urban)
Houses: 25,853 (23,475 occupied: 13,724 owner occupied, 9,763 renter occupied )
% of renters here:
42%State:
33%
Housing density: 1,300 houses/condos per square mile
Median price asked for vacant for-sale houses and condos in 2022: $113,661.
Median contract rent in 2022: $647 (lower quartile is $504, upper quartile is $794)
Median rent asked for vacant for-rent units in 2022: $535
Median gross rent in Elyria, OH in 2022: $816
Housing units in Elyria with a mortgage: 8,372 (726 second mortgage, 0 home equity loan, 529 both second mortgage and home equity loan )Houses without a mortgage: 394
Median household income for houses/condos with a mortgage: $74,312
Median household income for apartments without a mortgage: $52,662
Median monthly housing costs: $837
Data:
Median house or condo value ($)
Median house or condo value ($ change since 2000)
Median house or condo value ($) - White
Median house or condo value ($) - Black or African American
Median house or condo value ($) - Asian
Median house or condo value ($) - Hispanic or Latino
Median house or condo value ($) - American Indian and Alaska Native
Median house or condo value ($) - Multirace
Median house or condo value ($) - Other Race
Median price asked for mobile homes ($)
Household density (households per square mile)
Mean house or condo value by units in structure - 1, detached ($)
Mean house or condo value by units in structure - 1, attached ($)
Mean house or condo value by units in structure - 2 ($)
Mean house or condo value by units in structure by units in structure - 3 or 4 ($)
Mean house or condo value by units in structure - 5 or more ($)
Mean house or condo value by units in structure - Boat, RV, van, etc. ($)
Mean house or condo value by units in structure - Mobile home ($)
Median contract rent ($)
Median contract rent - Lower quartile ($)
Median contract rent - Upper quartile ($)
Median gross rent ($)
Urban houses (%)
Rural houses (%)
Houses occupied (%)
Houses occupied (% change since 2000)
Houses owner occupied (%)
Houses owner occupied (% change since 2000)
Houses renter occupied (%)
Houses renter occupied (% change since 2000)
Vacant housing units - For rent (%)
Vacant housing units - For rent (% change since 2000)
Vacant housing units - For sale only (%)
Vacant housing units - For sale only (% change since 2000)
Vacant housing units - Rented or sold, not occupied (%)
Vacant housing units - Rented or sold, not occupied (% change since 2000)
Vacant housing units - For seasonal, recreational, or occasional use (%)
Vacant housing units - For seasonal, recreational, or occasional use (% change since 2000)
Vacant housing units - For migrant workers (%)
Vacant housing units - For migrant workers (% change since 2000)
Vacant housing units - Other vacant (%)
Vacant housing units - Other vacant (% change since 2000)
Median monthly housing costs ($)
Median household income for houses/condos with a mortgage ($)
Median household income for houses/condos without a mortgage ($)
Median household income ($)
Median household income ($) - White
Median household income ($) - Black or African American
Median household income ($) - Asian
Median household income ($) - Hispanic or Latino
Median household income ($) - American Indian and Alaska Native
Median household income ($) - Multirace
Median household income ($) - Other Race
Mortgage status - with mortgage (%)
Mortgage status - with second mortgage (%)
Mortgage status - with home equity loan (%)
Mortgage status - with both second mortgage and home equity loan (%)
Mortgage status - without a mortgage (%)
Median year house/condo built
Median year apartment built
Household type by relationship - Male householder living alone (%)
Household type by relationship - Male householder not living alone (%)
Household type by relationship - Female householder living alone (%)
Household type by relationship - Female householder not living alone (%)
Household type by relationship - Opposite-Sex spouse (%)
Household type by relationship - Same-Sex spouse (%)
Household type by relationship - Opposite-Sex unmarried partner (%)
Household type by relationship - Same-Sex unmarried partner (%)
Household type by relationship - In group quarters (%)
Size of family households - 2-person household (%)
Size of family households - 3-person household (%)
Size of family households - 4-person household (%)
Size of family households - 5-person household (%)
Size of family households - 6-person household (%)
Size of family households - 7-or-more-person household (%)
Size of nonfamily households - 1-person household (%)
Size of nonfamily households - 2-person household (%)
Size of nonfamily households - 3-person household (%)
Size of nonfamily households - 4-person household (%)
Size of nonfamily households - 5-person household (%)
Size of nonfamily households - 6-person household (%)
Size of nonfamily households - 7-or-moreperson household (%)
Year house built - Built 2010 or later (%)
Year house built - Built 2000 to 2009 (%)
Year house built - Built 1990 to 1999 (%)
Year house built - Built 1980 to 1989 (%)
Year house built - Built 1970 to 1979 (%)
Year house built - Built 1960 to 1969 (%)
Year house built - Built 1950 to 1959 (%)
Year house built - Built 1940 to 1949 (%)
Year house built - Built 1939 or earlier (%)
Median number of rooms in houses and condos
Median number of rooms in apartments
Median number of bedrooms in owner occupied houses
Mean number of bedrooms in owner occupied houses
Median number of bedrooms in renter occupied houses
Mean number of bedrooms in renter occupied houses
Median number of vehichles in owner occupied houses
Mean number of vehichles in owner occupied houses
Median number of vehichles in renter occupied houses
Mean number of vehichles in renter occupied houses
Rooms in owner-occupied houses - 1 room (%)
Rooms in owner-occupied houses - 2 rooms (%)
Rooms in owner-occupied houses - 3 rooms (%)
Rooms in owner-occupied houses - 4 rooms (%)
Rooms in owner-occupied houses - 5 rooms (%)
Rooms in owner-occupied houses - 6 rooms (%)
Rooms in owner-occupied houses - 7 rooms (%)
Rooms in owner-occupied houses - 8 rooms (%)
Rooms in owner-occupied houses - 9+ rooms (%)
Rooms in renter-occupied houses - 1 room (%)
Rooms in renter-occupied houses - 2 rooms (%)
Rooms in renter-occupied houses - 3 rooms (%)
Rooms in renter-occupied houses - 4 rooms (%)
Rooms in renter-occupied houses - 5 rooms (%)
Rooms in renter-occupied houses - 6 rooms (%)
Rooms in renter-occupied houses - 7 rooms (%)
Rooms in renter-occupied houses - 8 rooms (%)
Rooms in renter-occupied houses - 9+ rooms (%)
Bedrooms in owner-occupied houses - no bedrooms (%)
Bedrooms in owner-occupied houses - 1 bedroom (%)
Bedrooms in owner-occupied houses - 2 bedrooms (%)
Bedrooms in owner-occupied houses - 3 bedrooms (%)
Bedrooms in owner-occupied houses - 4 bedrooms (%)
Bedrooms in owner-occupied houses - 5+ bedrooms (%)
Bedrooms in renter-occupied houses - no bedrooms (%)
Bedrooms in renter-occupied houses - 1 bedroom (%)
Bedrooms in renter-occupied houses - 2 bedrooms (%)
Bedrooms in renter-occupied houses - 3 bedrooms (%)
Bedrooms in renter-occupied houses - 4 bedrooms (%)
Bedrooms in renter-occupied houses - 5+ bedrooms (%)
Vehicles available in owner-occupied houses - no vehicle available (%)
Vehicles available in owner-occupied houses - 1 vehicle available(%)
Vehicles available in owner-occupied houses - 2 Vehicles available (%)
Vehicles available in owner-occupied houses - 3 Vehicles available (%)
Vehicles available in owner-occupied houses - 4 Vehicles available (%)
Vehicles available in owner-occupied houses - 5+ Vehicles available (%)
Vehicles available in renter-occupied houses - no vehicle available (%)
Vehicles available in renter-occupied houses - 1 vehicle available (%)
Vehicles available in renter-occupied houses - 2 Vehicles available (%)
Vehicles available in renter-occupied houses - 3 Vehicles available (%)
Vehicles available in renter-occupied houses - 4 Vehicles available (%)
Vehicles available in renter-occupied houses - 5+ Vehicles available (%)
Housing units in structures - 1, detached (%)
Housing units in structures - 1, attached (%)
Housing units in structures - 2 (%)
Housing units in structures - 3 or 4 (%)
Housing units in structures - 5 to 9 (%)
Housing units in structures - 10 to 19 (%)
Housing units in structures - 20 to 49 (%)
Housing units in structures - 50 or more (%)
Housing units in structures - Mobile home (%)
Housing units in structures - Boat, RV, van, etc. (%)
Housing units in structures - Owners - 1, detached (%)
Housing units in structures - Owners - 1, attached (%)
Housing units in structures - Owners - 2 (%)
Housing units in structures - Owners - 3 or 4 (%)
Housing units in structures - Owners - 5 to 9 (%)
Housing units in structures - Owners - 10 to 19 (%)
Housing units in structures - Owners - 20 to 49 (%)
Housing units in structures - Owners - 50 or more (%)
Housing units in structures - Owners - Mobile home (%)
Housing units in structures - Owners - Boat, RV, van, etc. (%)
Housing units in structures - Renters - 1, detached (%)
Housing units in structures - Renters - 1, attached (%)
Housing units in structures - Renters - 2 (%)
Housing units in structures - Renters - 3 or 4 (%)
Housing units in structures - Renters - 5 to 9 (%)
Housing units in structures - Renters - 10 to 19 (%)
Housing units in structures - Renters - 20 to 49 (%)
Housing units in structures - Renters - 50 or more (%)
Housing units in structures - Renters - Mobile home (%)
Housing units in structures - Renters - Boat, RV, van, etc. (%)
House/condo owner moved in on average (years ago)
Renter moved in on average (years ago)
Year householder moved into unit - Moved in 1999 to March 2000 (%)
Year householder moved into unit - Moved in 1999 to March 2000 (%) - White
Year householder moved into unit - Moved in 1999 to March 2000 (%) - Black or African American
Year householder moved into unit - Moved in 1999 to March 2000 (%) - Asian
Year householder moved into unit - Moved in 1999 to March 2000 (%) - Hispanic or Latino
Year householder moved into unit - Moved in 1999 to March 2000 (%) - American Indian and Alaska Native
Year householder moved into unit - Moved in 1999 to March 2000 (%) - Multirace
Year householder moved into unit - Moved in 1999 to March 2000 (%) - Other Race
Year householder moved into unit - Moved in 1995 to 1998 (%)
Year householder moved into unit - Moved in 1995 to 1998 (%) - White
Year householder moved into unit - Moved in 1995 to 1998 (%) - Black or African American
Year householder moved into unit - Moved in 1995 to 1998 (%) - Asian
Year householder moved into unit - Moved in 1995 to 1998 (%) - Hispanic or Latino
Year householder moved into unit - Moved in 1995 to 1998 (%) - American Indian and Alaska Native
Year householder moved into unit - Moved in 1995 to 1998 (%) - Multirace
Year householder moved into unit - Moved in 1995 to 1998 (%) - Other Race
Year householder moved into unit - Moved in 1990 to 1994 (%)
Year householder moved into unit - Moved in 1990 to 1994 (%) - White
Year householder moved into unit - Moved in 1990 to 1994 (%) - Black or African American
Year householder moved into unit - Moved in 1990 to 1994 (%) - Asian
Year householder moved into unit - Moved in 1990 to 1994 (%) - Hispanic or Latino
Year householder moved into unit - Moved in 1990 to 1994 (%) - American Indian and Alaska Native
Year householder moved into unit - Moved in 1990 to 1994 (%) - Multirace
Year householder moved into unit - Moved in 1990 to 1994 (%) - Other Race
Year householder moved into unit - Moved in 1980 to 1989 (%)
Year householder moved into unit - Moved in 1980 to 1989 (%) - White
Year householder moved into unit - Moved in 1980 to 1989 (%) - Black or African American
Year householder moved into unit - Moved in 1980 to 1989 (%) - Asian
Year householder moved into unit - Moved in 1980 to 1989 (%) - Hispanic or Latino
Year householder moved into unit - Moved in 1980 to 1989 (%) - American Indian and Alaska Native
Year householder moved into unit - Moved in 1980 to 1989 (%) - Multirace
Year householder moved into unit - Moved in 1980 to 1989 (%) - Other Race
Year householder moved into unit - Moved in 1970 to 1979 (%)
Year householder moved into unit - Moved in 1970 to 1979 (%) - White
Year householder moved into unit - Moved in 1970 to 1979 (%) - Black or African American
Year householder moved into unit - Moved in 1970 to 1979 (%) - Asian
Year householder moved into unit - Moved in 1970 to 1979 (%) - Hispanic or Latino
Year householder moved into unit - Moved in 1970 to 1979 (%) - American Indian and Alaska Native
Year householder moved into unit - Moved in 1970 to 1979 (%) - Multirace
Year householder moved into unit - Moved in 1970 to 1979 (%) - Other Race
Year householder moved into unit - Moved in 1969 or earlier (%)
Year householder moved into unit - Moved in 1969 or earlier (%) - White
Year householder moved into unit - Moved in 1969 or earlier (%) - Black or African American
Year householder moved into unit - Moved in 1969 or earlier (%) - Asian
Year householder moved into unit - Moved in 1969 or earlier (%) - Hispanic or Latino
Year householder moved into unit - Moved in 1969 or earlier (%) - American Indian and Alaska Native
Year householder moved into unit - Moved in 1969 or earlier (%) - Multirace
Year householder moved into unit - Moved in 1969 or earlier (%) - Other Race
Housing units lacking complete plumbing facilities (%)
Housing units lacking complete kitchen facilities (%)
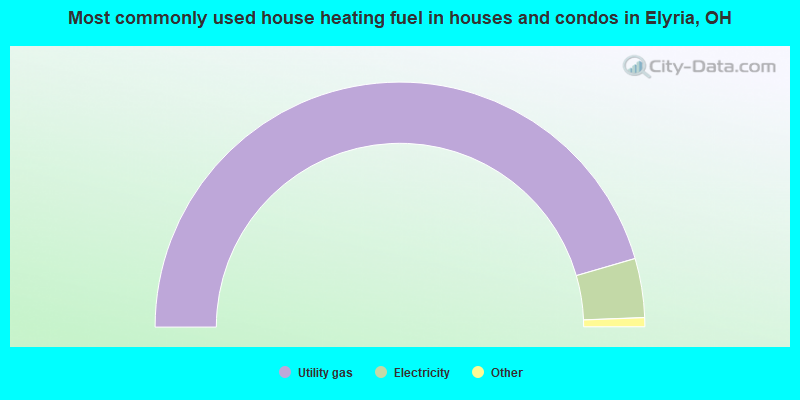
House heating fuel used in houses and condos - Utility gas (%)
House heating fuel used in houses and condos - Bottled, tank, or LP gas (%)
House heating fuel used in houses and condos - Electricity (%)
House heating fuel used in houses and condos - Fuel oil, kerosene, etc. (%)
House heating fuel used in houses and condos - Coal or coke (%)
House heating fuel used in houses and condos - Wood (%)
House heating fuel used in houses and condos - Solar energy (%)
House heating fuel used in houses and condos - Other fuel (%)
House heating fuel used in houses and condos - No fuel used (%)
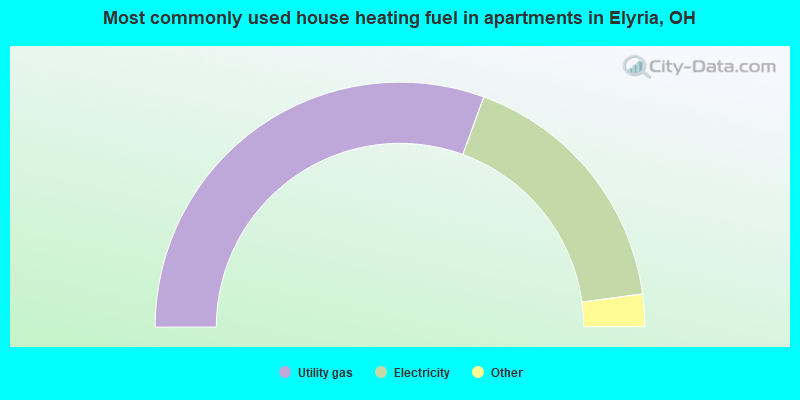
House heating fuel used in apartments - Utility gas (%)
House heating fuel used in apartments - Bottled, tank, or LP gas (%)
House heating fuel used in apartments - Electricity (%)
House heating fuel used in apartments - Fuel oil, kerosene, etc. (%)
House heating fuel used in apartments - Coal or coke (%)
House heating fuel used in apartments - Wood (%)
House heating fuel used in apartments - Solar energy (%)
House heating fuel used in apartments - Other fuel (%)
House heating fuel used in apartments - No fuel used (%)
Latest news about housing in Elyria, OH collected exclusively by city-data.com from local newspapers, TV, and radio stations
Median year house/condo built: 1962Median year apartment built: 1968Household type by relationship:
Households: 53,313
Male householders: 10,570 (3,985 living alone ), Female householders: 12,781 (4,913 living alone )7,994 spouses (7,777 opposite-sex spouses ), 2,008 unmarried partners , (1,952 opposite-sex unmarried partners ), 14,489 children (13,852 natural , 143 adopted , 492 stepchildren ), 1,688 grandchildren , 536 brothers or sisters , 414 parents , 77 foster children , 637 other relatives , 1,423 non-relatives In group quarters: 691
Size of family households: 6,400 2-persons , 2,693 3-persons , 2,157 4-persons , 718 5-persons , 436 6-persons , 153 7-or-more-persons .
Size of nonfamily households: 9,186 1-person , 1,585 2-persons , 148 3-persons , 16 4-persons , 4 5-persons , 9 6-persons .
4,416 married couples with children. single-parent households (1,247 men , 3,962 women ).
93.9% of residents of Elyria speak English at home. of residents speak Spanish at home (61% speak English very well , 11% speak English well , 27% speak English not well , 1% don't speak English at all ).of residents speak other Indo-European language at home (88% speak English very well , 6% speak English well , 6% speak English not well ).of residents speak Asian or Pacific Island language at home (63% speak English very well , 29% speak English well , 8% speak English not well ).of residents speak other language at home (100% speak English very well ).
Foreign born population: 1,086 (2.0%)of them are naturalized citizens )
Median number of rooms in houses and condos:
Median number of rooms in apartments
Owner-occupied Renter-occupied
Rooms in owner-occupied houses in Elyria, Ohio
0 1 room 0 2 rooms 77 3 rooms 944 4 rooms 3,758 5 rooms 3,006 6 rooms 2,675 7 rooms 1,574 8 rooms 1,691 9+ rooms
Rooms in renter-occupied apartments in Elyria, Ohio
457 1 room 430 2 rooms 1,589 3 rooms 2,649 4 rooms 1,877 5 rooms 1,630 6 rooms 673 7 rooms 281 8 rooms 179 9+ rooms
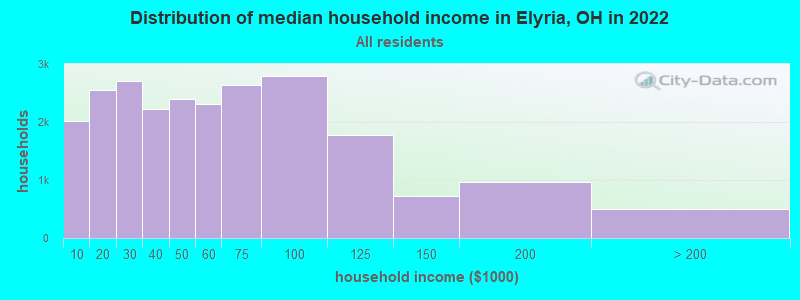
Elyria, OH household income distribution 2,025 Less than $10,0002,548 $10,000 to $19,9992,708 $20,000 to $29,9992,229 $30,000 to $39,9992,389 $40,000 to $49,9992,306 $50,000 to $59,9992,636 $60,000 to $74,9992,800 $75,000 to $99,9991,768 $100,000 to $124,999718 $125,000 to $149,999967 $150,000 to $199,999504 $200,000 or more
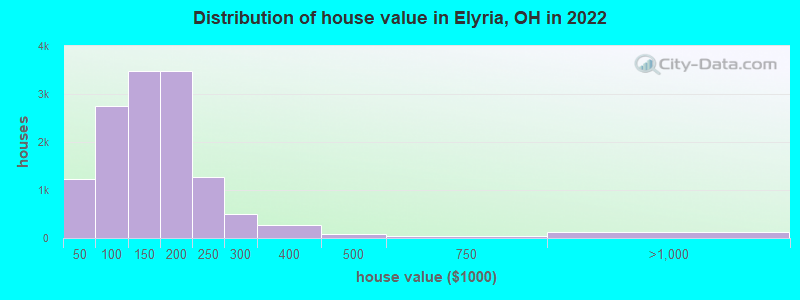
Home value of owner - occupied houses in 2022 in Elyria, OH 159 Less than $10,000238 $10,000 to $14,999120 $15,000 to $19,999356 $20,000 to $24,99939 $25,000 to $29,99958 $30,000 to $34,99964 $35,000 to $39,999184 $40,000 to $49,999446 $50,000 to $59,999169 $60,000 to $69,999799 $70,000 to $79,999522 $80,000 to $89,999637 $90,000 to $99,9991,961 $100,000 to $124,9991,519 $125,000 to $149,9992,225 $150,000 to $174,9991,255 $175,000 to $199,9991,271 $200,000 to $249,999504 $250,000 to $299,999267 $300,000 to $399,99988 $400,000 to $499,99946 $500,000 to $749,99973 $750,000 to $999,99937 $1,000,000 to $1,499,9997 $2,000,000 or moreRent paid by renters in 2022 in Elyria, OH 217 Less than $100166 $100 to $149115 $150 to $199262 $200 to $249113 $250 to $299177 $300 to $349253 $350 to $399242 $400 to $449470 $450 to $499974 $500 to $549603 $550 to $599840 $600 to $649817 $650 to $699958 $700 to $749529 $750 to $799749 $800 to $899682 $900 to $999543 $1,000 to $1,249220 $1,250 to $1,499105 $1,500 to $1,9994 $2,000 to $2,49925 $3,000 to $3,499132 $3,500 or more373 No cash rent
Percentage of workers working in this county: 73.4%Number of people working at home: 1,519 (6.0% of all workers )
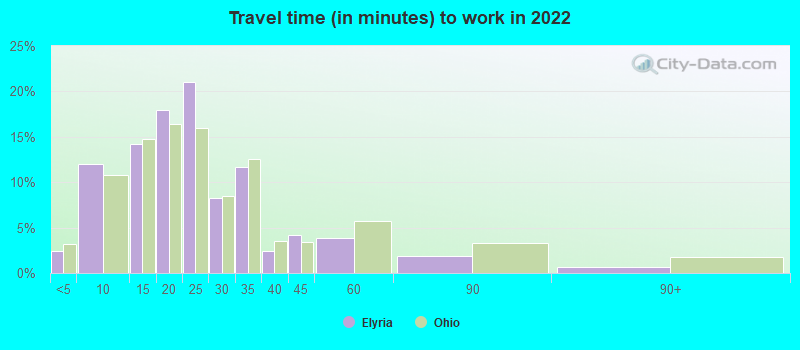
Travel time to work (commute)
Less than 5 minutes: 4435 to 9 minutes: 2,60810 to 14 minutes: 3,06915 to 19 minutes: 3,69320 to 24 minutes: 3,92325 to 29 minutes: 2,43830 to 34 minutes: 2,98335 to 39 minutes: 94740 to 44 minutes: 69345 to 59 minutes: 1,14160 to 89 minutes: 55890 or more minutes: 394
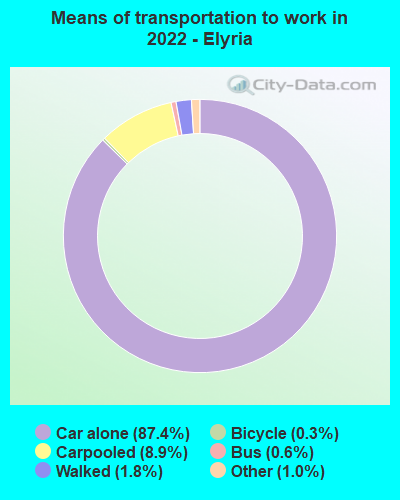
Means of transportation to work:
Drove a car alone: 18,985 (79.8%)Carpooled: 1,780 (7.5%)Bus : 125 (0.5%)Taxi: 195 (0.8%)Bicycle: 78 (0.3%)Walked: 314 (1.3%)Worked at home: 1,519 (6.4%)
Unemployment by race in 2022
Unemployment rate for White non-Hispanic residents 3.9% Males1.9% FemalesUnemployment rate for Black residents 2.9% Males15.1% FemalesUnemployment rate for American Indian and Alaska Native residents 66.3% FemalesUnemployment rate for Asian residents 20.9% MalesUnemployment rate for other race residents 1.7% MalesUnemployment rate for two or more race residents 6.4% Males17.4% FemalesUnemployment rate for Hispanic or Latino residents 6.0% Males19.3% Females
Year of entry for the foreign-born population in Elyria, Ohio
420 2010 or later 190 2000 to 2009 142 1990 to 1999 130 1980 to 1989 123 1970 to 1979 396 Before 1970
First ancestries reported:
American: 4,218 (18.3%)
German: 2,554 (11.1%)
English: 1,740 (7.6%)
Irish: 1,199 (5.2%)
Italian: 977 (4.2%)
Polish: 911 (4.0%)
Hungarian: 421 (1.8%)
Scottish: 277 (1.2%)
African: 231 (1.0%)
European: 230 (1.0%)
Slovak: 170 (0.7%)
Eastern European: 105 (0.5%)
French Canadian: 93 (0.4%)
Russian: 82 (0.4%)
Dutch: 81 (0.4%)
Scotch-Irish: 65 (0.3%)
Croatian: 52 (0.2%)
Bulgarian: 45 (0.2%)
Czechoslovakian: 42 (0.2%)
British: 40 (0.2%)
Cypriot: 40 (0.2%)
Czech: 40 (0.2%)
Pennsylvania German: 39 (0.2%)
Romanian: 39 (0.2%)
Slavic: 36 (0.2%)
Greek: 35 (0.2%)
Swiss: 29 (0.1%)
French: 27 (0.1%)
Slovene: 26 (0.1%)
Ukrainian: 23 (0.10%)
Portuguese: 21 (0.09%)
Macedonian: 19 (0.08%)
Finnish: 15 (0.07%)
Welsh: 15 (0.07%)
Danish: 11 (0.05%)
Austrian: 9 (0.04%)
Northern European: 8 (0.03%)
Norwegian: 8 (0.03%)
Jamaican: 6 (0.03%)
Jordanian: 5 (0.02%) Most common places of birth for foreign-born residents (%): China, excluding Hong Kong and Taiwan Elyria:
8.9% (108)Ohio:
6.2% (35,703)
Canada Elyria:
8.5% (103)Ohio:
2.6% (14,988)
Mexico Elyria:
8.0% (96)Ohio:
7.8% (44,796)
Korea Elyria:
6.0% (72)Ohio:
2.0% (11,398)
Germany Elyria:
5.6% (67)Ohio:
2.2% (12,846)
Nicaragua Elyria:
5.1% (62)Ohio:
0.2% (1,250)
El Salvador Elyria:
4.8% (58)Ohio:
1.4% (7,947)
Italy Elyria:
4.7% (57)Ohio:
1.2% (6,679)
Venezuela Elyria:
4.6% (55)Ohio:
0.7% (3,920)
Cuba Elyria:
4.1% (49)Ohio:
0.4% (2,031)
England Elyria:
3.6% (44)Ohio:
1.0% (5,979)
Honduras Elyria:
3.6% (44)Ohio:
1.0% (5,553)
Jamaica Elyria:
3.5% (42)Ohio:
0.7% (4,187)
Dominican Republic Elyria:
2.4% (29)Ohio:
1.1% (6,549)
Pakistan Elyria:
2.2% (26)Ohio:
1.0% (5,444)
Vietnam Elyria:
2.1% (25)Ohio:
1.9% (10,960)
Hong Kong Elyria:
1.8% (22)Ohio:
0.4% (2,094)
Argentina Elyria:
1.7% (21)Ohio:
0.3% (1,447)
Kazakhstan Elyria:
1.6% (19)Ohio:
0.1% (640)
Place of birth for U.S.-born residents:
This state: 41,786Other state: 9,543Northeast: 2,830Midwest: 2,223South: 3,694West: 723 87.9% of Elyria residents lived in the same house 1 years ago.
Out of people who lived in different houses, 36.7% lived in this county.
Out of people who lived in different counties, 62.7% lived in Ohio.
Elyria:
87.9%State average:
87.8%
Education attainment for males 25 years and older:
No schooling: 303Nursery to 4th grade: 335th and 6th grade: 607th and 8th grade: 1349th grade: 16210th grade: 25111th grade: 44912th grade, no diploma: 752High school graduate (or equivalency): 7,191Less than 1 year of college: 1,382Some college more than 1 year, no degree: 1,904Associate degree: 1,538Bachelor's degree: 1,960Master's degree: 718Professional school degree: 87Doctorate degree: 176
Education attainment for females 25 years and older:
No schooling: 302Nursery to 4th grade: 275th and 6th grade: 147th and 8th grade: 2969th grade: 22810th grade: 54611th grade: 36212th grade, no diploma: 437High school graduate (or equivalency): 6,378Less than 1 year of college: 2,185Some college more than 1 year, no degree: 2,603Associate degree: 2,483Bachelor's degree: 2,001Master's degree: 1,152Professional school degree: 28Doctorate degree: 56
Housing units in structures:
One, detached: 16,494One, attached: 976Two: 1,2653 or 4: 7925 to 9: 1,59110 to 19: 2,19620 to 49: 39450 or more: 972Mobile homes: 1,169Median worth of mobile homes: $21,254
Housing units lacking complete plumbing facilities in 2022: 1.8%Housing units lacking complete kitchen facilities in 2022: 2.2%House/condo owner moved in on average 12 years ago
Renter moved in on average 3 years ago
Private vs. public school enrollment:
Students in private schools in grades 1 to 8 (elementary and middle school): 562 Students in private schools in grades 9 to 12 (high school): 326 Students in private undergraduate colleges: 348