Encinitas, CA (California) Houses and Residents
| Encinitas: | $1,581,363 |
| California: | $715,900 |
Mean price in 2022:
Detached houses: $1,939,428
Here: $1,939,428 State: $988,808 Townhouses or other attached units: $1,258,888
Here: $1,258,888 State: $838,546 In 2-unit structures: $2,424,934
Here: $2,424,934 State: $1,138,100 In 3-to-4-unit structures: $1,493,165
Here: $1,493,165 State: $824,253 In 5-or-more-unit structures: $1,334,668
Here: $1,334,668 State: $730,996 Mobile homes: $214,757
Here: $214,757 State: $184,506
Total population: 62,254 (Urban population: 57,807, Rural population: 388 (all nonfarm))
Houses: 26,350 (24,165 occupied: 15,865 owner occupied, 8,452 renter occupied)
| % of renters here: | 35% |
| State: | 44% |
Housing density: 1,379 houses/condos per square mile
Median price asked for vacant for-sale houses and condos in 2022: $3,355,135.
Median contract rent in 2022: over $2,000 (lower quartile is $1,847, upper quartile is over $2,000)
Median rent asked for vacant for-rent units in 2022: $2,480
Median gross rent in Encinitas, CA in 2022: over $2,000
Housing units in Encinitas with a mortgage: 10,046 (1,475 second mortgage, 22 home equity loan, 1,288 both second mortgage and home equity loan)
Houses without a mortgage: 155
Median household income for houses/condos with a mortgage: $212,213
Median household income for apartments without a mortgage: $112,213
Median monthly housing costs: $2,654
Compare current foreclosures near Encinitas, CA:
| Photo | Address | Area | Beds / Baths | Price | Details |
|---|---|---|---|---|---|

|
#1
Tennis Match Way
Encinitas, CA 92024
|
1,929 sq. feet
|
2 baths 4 beds |
show details | |

|
#2
Oakbranch Dr
Encinitas, CA 92024
|
1,983 sq. feet
|
2 baths 4 beds |
show details | |

|
#3
Peartree Ct
Encinitas, CA 92024
|
1,633 sq. feet
|
2 baths 3 beds |
show details | |

|
#4
Saxony Rd
Encinitas, CA 92024
|
1,937 sq. feet
|
2 baths 3 beds |
show details | |

|
#5
Arcadia Rd
Encinitas, CA 92024
|
2,276 sq. feet
|
3 baths 5 beds |
show details | |

|
#6
Triton Cir
Encinitas, CA 92024
|
1,815 sq. feet
|
2 baths 3 beds |
show details | |

|
#7
Hawk View Dr
Encinitas, CA 92024
|
1,783 sq. feet
|
2 baths 4 beds |
show details | |

|
#8
S El Camino Real Unit 103
Encinitas, CA 92024
|
- sq. feet
|
- baths - beds |
show details | |

|
#9
3rd St
Encinitas, CA 92024
|
- sq. feet
|
- baths - beds |
show details | |

|
#10
Rosebay Dr Apt 1
Encinitas, CA 92024
|
- sq. feet
|
- baths - beds |
show details |
| Photo | Address | Area | Beds / Baths | Price | Details |
|---|---|---|---|---|---|

|
#11
N Vulcan Ave Apt 13
Encinitas, CA 92024
|
- sq. feet
|
- baths - beds |
show details | |

|
#12
Hermes Ave
Encinitas, CA 92024
|
- sq. feet
|
- baths - beds |
show details | |

|
#13
N Vulcan Ave # 4
Encinitas, CA 92024
|
- sq. feet
|
- baths - beds |
show details | |

|
#14
N Vulcan Ave Spc 29
Encinitas, CA 92024
|
- sq. feet
|
- baths - beds |
show details | |

|
#15
Enclave Ct
Encinitas, CA 92024
|
- sq. feet
|
- baths - beds |
show details | |

|
#16
Diamond Way Apt 249
Vista, CA 92083
|
878 sq. feet
|
2 baths 2 beds |
show details | |

|
#17
Mockingbird Cir
Escondido, CA 92025
|
2,300 sq. feet
|
2 baths 3 beds |
show details | |

|
#18
Dartmoor Cir
Oceanside, CA 92057
|
2,136 sq. feet
|
3 baths 4 beds |
show details | |

|
#19
Sitio Caliente
Carlsbad, CA 92009
|
3,563 sq. feet
|
5 baths 5 beds |
show details | |

|
#20
Stanley Ct
Escondido, CA 92026
|
1,203 sq. feet
|
2 baths 3 beds |
show details |
| Photo | Address | Area | Beds / Baths | Price | Details |
|---|---|---|---|---|---|

|
#21
Biltmore St
San Diego, CA 92117
|
1,903 sq. feet
|
2 baths 3 beds |
show details | |

|
#22
Cool Lake Way
San Diego, CA 92128
|
1,739 sq. feet
|
2 baths 4 beds |
show details | |

|
#23
Lisbon Pl
Escondido, CA 92029
|
1,696 sq. feet
|
2 baths 3 beds |
show details | |

|
#24
Paul St
Escondido, CA 92027
|
1,280 sq. feet
|
2 baths 3 beds |
show details | |

|
#25
Longfellow Ct
Oceanside, CA 92057
|
2,394 sq. feet
|
2 baths 3 beds |
show details | |

|
#26
Harriet St
Oceanside, CA 92056
|
1,612 sq. feet
|
2 baths 3 beds |
show details | |

|
#27
Calle Buena Ventura
Oceanside, CA 92056
|
1,498 sq. feet
|
2 baths 3 beds |
show details | |

|
#28
Palomar Dr
San Marcos, CA 92069
|
1,515 sq. feet
|
2 baths 4 beds |
show details | |

|
#29
Avocado Ln
Carlsbad, CA 92008
|
2,062 sq. feet
|
3 baths 4 beds |
show details | |

|
#30
Parkview Dr
Oceanside, CA 92057
|
3,014 sq. feet
|
4 baths 4 beds |
show details |
| Photo | Address | Area | Beds / Baths | Price | Details |
|---|---|---|---|---|---|

|
#31
Amber Ln
Carlsbad, CA 92009
|
4,745 sq. feet
|
5 baths 4 beds |
show details | |

|
#32
Rock Rose
San Diego, CA 92127
|
3,861 sq. feet
|
5 baths 4 beds |
show details | |

|
#33
Seacrest Ct
Vista, CA 92081
|
1,535 sq. feet
|
2 baths 3 beds |
show details | |

|
#34
Citracado Pkwy
Escondido, CA 92029
|
- sq. feet
|
2 baths 3 beds |
show details | |

|
#35
Capricorn Way
San Diego, CA 92126
|
1,600 sq. feet
|
2 baths 4 beds |
show details | |

|
#36
Playa Rd
Carlsbad, CA 92009
|
3,476 sq. feet
|
3 baths 4 beds |
show details | |

|
#37
Goldstone Rd
Carlsbad, CA 92009
|
3,424 sq. feet
|
4 baths 4 beds |
show details | |

|
#38
Cliffridge Ave
La Jolla, CA 92037
|
3,164 sq. feet
|
3 baths 4 beds |
show details | |

|
#39
Nancy St
Escondido, CA 92027
|
1,360 sq. feet
|
2 baths 3 beds |
show details | |

|
#40
Amparo Dr
Escondido, CA 92025
|
4,084 sq. feet
|
4 baths 5 beds |
show details |
| Photo | Address | Area | Beds / Baths | Price | Details |
|---|---|---|---|---|---|

|
#41
La Morre Rd #11
San Marcos, CA 92078
|
1,792 sq. feet
|
2 baths 3 beds |
show details | |

|
#42
Rosehill Rd
Escondido, CA 92025
|
3,036 sq. feet
|
2 baths 4 beds |
show details | |

|
#43
Lacebark St
San Marcos, CA 92069
|
1,398 sq. feet
|
2 baths 3 beds |
show details | |

|
#44
Cameo Dr
Vista, CA 92083
|
2,049 sq. feet
|
3 baths 4 beds |
show details | |

|
#45
Mosaic Gln
Escondido, CA 92029
|
1,620 sq. feet
|
2 baths 3 beds |
show details | |

|
#46
Spring Creek Ln
Oceanside, CA 92057
|
1,304 sq. feet
|
2 baths 3 beds |
show details | |

|
#47
Santa Arminta Ave
San Diego, CA 92126
|
1,627 sq. feet
|
2 baths 4 beds |
show details | |

|
#48
Pod Dr
Vista, CA 92084
|
1,498 sq. feet
|
2 baths 3 beds |
show details | |

|
#49
Holly Ave
Escondido, CA 92026
|
1,651 sq. feet
|
2 baths 3 beds |
show details | |

|
Check over 1 million property listings on Foreclosure.com!
|
browse all offers | |||

Latest news about housing in Encinitas, CA collected exclusively by city-data.com from local newspapers, TV, and radio stations

 | Apartments in Encinitas/Carlsbad areas (16 replies) |
| Need Help With Luxury Apartment Rentals In Encinitas Area (11 replies) |
| GET REAL About San Diego Rental and Real Estate Prices (751 replies) |
| House rentals in Encinitas/Cardiff? (5 replies) |
| Private Schools in Encinitas, Carlsbad, Vista, anywhere close? (24 replies) |
| Where are these houses (4 replies) |

Median year apartment built: 1979
Household type by relationship:
Households: 61,687- Male householders: 11,607 (2,090 living alone), Female householders: 12,132 (3,302 living alone)
13,478 spouses (13,271 opposite-sex spouses), 1,505 unmarried partners, (1,442 opposite-sex unmarried partners), 17,108 children (16,074 natural, 403 adopted, 630 stepchildren), 456 grandchildren, 502 brothers or sisters, 842 parents, 0 foster children, 567 other relatives, 2,940 non-relatives
- In group quarters: 545
Size of family households: 7,431 2-persons, 3,801 3-persons, 3,362 4-persons, 1,406 5-persons, 242 6-persons, 34 7-or-more-persons.
Size of nonfamily households: 5,537 1-person, 2,272 2-persons, 180 3-persons, 145 4-persons, 12 5-persons.
10,427 married couples with children.
1,687 single-parent households (596 men, 1,091 women).
82.9% of residents of Encinitas speak English at home.
9.9% of residents speak Spanish at home (73% speak English very well, 13% speak English well, 14% speak English not well).
4.7% of residents speak other Indo-European language at home (82% speak English very well, 16% speak English well, 1% speak English not well, 1% don't speak English at all).
1.8% of residents speak Asian or Pacific Island language at home (64% speak English very well, 28% speak English well, 7% speak English not well, 1% don't speak English at all).
0.5% of residents speak other language at home (74% speak English very well, 24% speak English well, 3% don't speak English at all).
Foreign born population: 7,589 (12.3%)
(62.7% of them are naturalized citizens)
| Here: | 6.7 |
| State: | 6.0 |
| Here: | 4.0 |
| State: | 3.9 |

- Bedrooms in owner-occupied houses and condos in Encinitas, California
- 90no bedroom
- 2251 bedroom
- 2,4662 bedrooms
- 5,9473 bedrooms
- 5,1424 bedrooms
- 1,9965+ bedrooms

- Bedrooms in renter-occupied apartments in Encinitas, California
- 606no bedroom
- 1,9101 bedroom
- 3,4842 bedrooms
- 1,9273 bedrooms
- 4264 bedrooms
- 995+ bedrooms

- Cars and other vehicles available in Encinitas in owner-occupied houses/condos
- 365no vehicle
- 2,9981 vehicle
- 7,2392 vehicles
- 3,7743 vehicles
- 1,1254 vehicles
- 3645+ vehicles

- Cars and other vehicles available in Encinitas in renter-occupied apartments
- 551no vehicle
- 2,9721 vehicle
- 3,8312 vehicles
- 7903 vehicles
- 2274 vehicles
- 825+ vehicles

- Rooms in owner-occupied houses in Encinitas, California
- 481 room
- 1412 rooms
- 3803 rooms
- 1,5704 rooms
- 2,2415 rooms
- 3,0146 rooms
- 2,9027 rooms
- 2,3878 rooms
- 3,1839+ rooms

- Rooms in renter-occupied apartments in Encinitas, California
- 5821 room
- 5612 rooms
- 2,0183 rooms
- 2,1394 rooms
- 1,7975 rooms
- 6696 rooms
- 2847 rooms
- 808 rooms
- 3239+ rooms


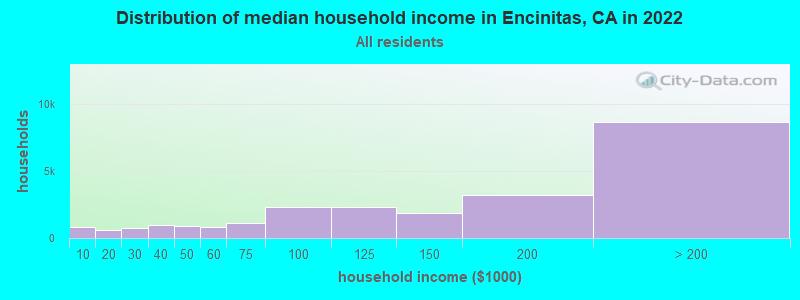
Encinitas, CA household income distribution

- 841Less than $10,000
- 635$10,000 to $19,999
- 782$20,000 to $29,999
- 969$30,000 to $39,999
- 895$40,000 to $49,999
- 802$50,000 to $59,999
- 1,147$60,000 to $74,999
- 2,294$75,000 to $99,999
- 2,335$100,000 to $124,999
- 1,838$125,000 to $149,999
- 3,216$150,000 to $199,999
- 8,674$200,000 or more
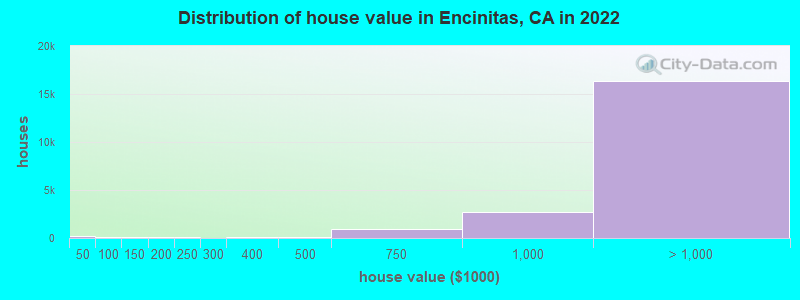
Home value of owner - occupied houses in 2022 in Encinitas, CA
-
- 144Less than $10,000
- 38$15,000 to $19,999
- 10$20,000 to $24,999
- 5$25,000 to $29,999
- 11$40,000 to $49,999
- 22$50,000 to $59,999
- 9$60,000 to $69,999
- 6$80,000 to $89,999
- 44$90,000 to $99,999
- 133$100,000 to $124,999
- 17$125,000 to $149,999
- 91$150,000 to $174,999
- 39$175,000 to $199,999
- 156$200,000 to $249,999
- 31$250,000 to $299,999
- 52$300,000 to $399,999
- 129$400,000 to $499,999
- 891$500,000 to $749,999
- 2,750$750,000 to $999,999
- 5,811$1,000,000 to $1,499,999
- 4,156$1,500,000 to $1,999,999
- 6,413$2,000,000 or more
Rent paid by renters in 2022 in Encinitas, CA
-
- 46$200 to $249
- 100$250 to $299
- 50$300 to $349
- 22$400 to $449
- 33$450 to $499
- 22$500 to $549
- 18$550 to $599
- 20$650 to $699
- 14$700 to $749
- 30$800 to $899
- 82$900 to $999
- 67$1,000 to $1,249
- 412$1,250 to $1,499
- 1,586$1,500 to $1,999
- 1,902$2,000 to $2,499
- 1,416$2,500 to $2,999
- 1,006$3,000 to $3,499
- 1,529$3,500 or more
- 276No cash rent


Percentage of workers working in this county: 97.8%
Number of people working at home: 10,335 (33.0% of all workers)
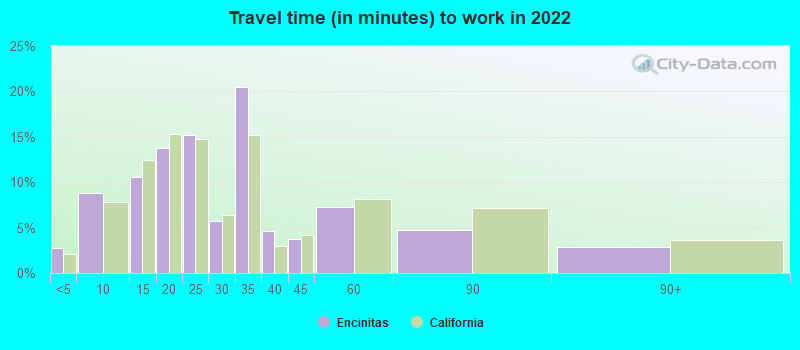
Travel time to work (commute)
- Less than 5 minutes: 915
- 5 to 9 minutes: 1,982
- 10 to 14 minutes: 2,797
- 15 to 19 minutes: 3,738
- 20 to 24 minutes: 3,709
- 25 to 29 minutes: 1,655
- 30 to 34 minutes: 3,403
- 35 to 39 minutes: 870
- 40 to 44 minutes: 994
- 45 to 59 minutes: 1,259
- 60 to 89 minutes: 513
- 90 or more minutes: 397
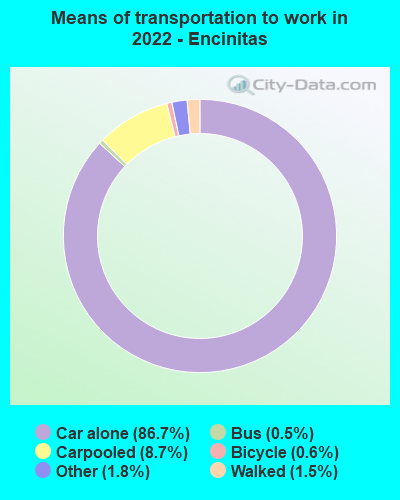
Means of transportation to work:
- Drove a car alone: 20,200 (61.6%)
- Carpooled: 2,121 (6.5%)
- Bus: 95 (0.3%)
- Subway or elevated rail: 7 (0.0%)
- Light rail, streetcar or trolley: 21 (0.1%)
- Taxi: 447 (1.4%)
- Bicycle: 147 (0.4%)
- Walked: 398 (1.2%)
- Worked at home: 10,335 (31.5%)

- Unemployment by race in 2022
- Unemployment rate for White non-Hispanic residents
- 3.3%Males
- 4.3%Females
- Unemployment rate for Black residents
- 5.3%Males
- Unemployment rate for American Indian and Alaska Native residents
- 26.2%Males
- 14.4%Females
- Unemployment rate for Asian residents
- 2.1%Males
- 3.6%Females
- Unemployment rate for other race residents
- 11.6%Females
- Unemployment rate for two or more race residents
- 0.9%Males
- 3.0%Females
- Unemployment rate for Hispanic or Latino residents
- 0.8%Males
- 5.2%Females

- Year of entry for the foreign-born population in Encinitas, California
- 1,7472010 or later
- 1,7342000 to 2009
- 1,2341990 to 1999
- 2,4731980 to 1989
- 1,2931970 to 1979
- 1,754Before 1970

First ancestries reported:
- English: 3,280 (12.5%)
- Irish: 2,572 (9.8%)
- German: 2,312 (8.8%)
- European: 1,509 (5.7%)
- American: 1,334 (5.1%)
- Italian: 924 (3.5%)
- Polish: 554 (2.1%)
- Dutch: 472 (1.8%)
- Eastern European: 458 (1.7%)
- British: 411 (1.6%)
- Iranian: 404 (1.5%)
- Swedish: 380 (1.4%)
- Canadian: 340 (1.3%)
- Northern European: 282 (1.1%)
- Greek: 250 (0.9%)
- Norwegian: 199 (0.8%)
- Scottish: 198 (0.8%)
- Russian: 185 (0.7%)
- Scotch-Irish: 126 (0.5%)
- Danish: 123 (0.5%)
- Lebanese: 101 (0.4%)
- Portuguese: 96 (0.4%)
- French: 95 (0.4%)
- Celtic: 88 (0.3%)
- Austrian: 86 (0.3%)
- Hungarian: 85 (0.3%)
- Brazilian: 83 (0.3%)
- Ukrainian: 82 (0.3%)
- Swiss: 71 (0.3%)
- Scandinavian: 60 (0.2%)
- Finnish: 60 (0.2%)
- Serbian: 53 (0.2%)
- Czech: 48 (0.2%)
- French Canadian: 47 (0.2%)
- Basque: 40 (0.2%)
- South African: 35 (0.1%)
- Welsh: 35 (0.1%)
- Croatian: 34 (0.1%)
- Ethiopian: 32 (0.1%)
- Belgian: 32 (0.1%)
- Assyrian: 26 (0.10%)
- Belizean: 26 (0.10%)
- Romanian: 24 (0.09%)
- Latvian: 24 (0.09%)
- Armenian: 22 (0.08%)
- Jordanian: 21 (0.08%)
- Moroccan: 20 (0.08%)
- Palestinian: 17 (0.06%)
- Luxembourger: 16 (0.06%)
- Yugoslavian: 16 (0.06%)
- Nigerian: 13 (0.05%)
- Lithuanian: 13 (0.05%)
- Somali: 11 (0.04%)
- Australian: 9 (0.03%)
- Slovene: 8 (0.03%)
- Cajun: 7 (0.03%)
- Czechoslovakian: 6 (0.02%)
- Slovak: 5 (0.02%)
- Slavic: 4 (0.02%)
- African: 4 (0.02%)
Most common places of birth for foreign-born residents (%):
| Encinitas: | 17.8% (1,349) |
| California: | 37.2% (3,881,193) |
| Encinitas: | 7.1% (539) |
| California: | 1.2% (127,477) |
| Encinitas: | 6.4% (484) |
| California: | 2.8% (290,436) |
| Encinitas: | 5.5% (418) |
| California: | 0.6% (60,582) |
| Encinitas: | 4.8% (366) |
| California: | 7.8% (818,297) |
| Encinitas: | 4.6% (347) |
| California: | 0.7% (73,304) |
| Encinitas: | 4.5% (338) |
| California: | 2.0% (206,004) |
| Encinitas: | 3.9% (299) |
| California: | 5.2% (539,184) |
| Encinitas: | 3.3% (248) |
| California: | 1.0% (105,215) |
| Encinitas: | 3.1% (237) |
| California: | 0.4% (40,224) |
| Encinitas: | 3.1% (235) |
| California: | 0.6% (57,953) |
| Encinitas: | 2.1% (161) |
| California: | 6.6% (684,672) |
| Encinitas: | 2.1% (161) |
| California: | 0.2% (17,937) |
| Encinitas: | 1.6% (119) |
| California: | 4.9% (512,335) |
| Encinitas: | 1.5% (117) |
| California: | 0.3% (33,029) |
Place of birth for U.S.-born residents:
- This state: 32,743
- Other state: 20,248
- Northeast: 6,778
- Midwest: 6,362
- South: 3,861
- West: 3,258
91.4% of Encinitas residents lived in the same house 1 years ago.
Out of people who lived in different houses, 41.4% lived in this county.
Out of people who lived in different counties, 61.0% lived in California.
| Encinitas: | 91.4% |
| State average: | 88.9% |
Education attainment for males 25 years and older:
- No schooling: 209
- Nursery to 4th grade: 237
- 5th and 6th grade: 28
- 7th and 8th grade: 38
- 9th grade: 37
- 10th grade: 72
- 11th grade: 142
- 12th grade, no diploma: 207
- High school graduate (or equivalency): 1,940
- Less than 1 year of college: 878
- Some college more than 1 year, no degree: 2,207
- Associate degree: 1,073
- Bachelor's degree: 8,941
- Master's degree: 3,295
- Professional school degree: 1,569
- Doctorate degree: 1,503

Education attainment for females 25 years and older:
- No schooling: 265
- Nursery to 4th grade: 5
- 5th and 6th grade: 372
- 7th and 8th grade: 6
- 9th grade: 34
- 10th grade: 76
- 11th grade: 56
- 12th grade, no diploma: 119
- High school graduate (or equivalency): 2,209
- Less than 1 year of college: 1,132
- Some college more than 1 year, no degree: 2,306
- Associate degree: 2,023
- Bachelor's degree: 8,818
- Master's degree: 4,363
- Professional school degree: 1,627
- Doctorate degree: 966


Housing units in structures:
- One, detached: 14,923
- One, attached: 4,785
- Two: 906
- 3 or 4: 1,396
- 5 to 9: 709
- 10 to 19: 985
- 20 to 49: 718
- 50 or more: 1,152
- Mobile homes: 771
Median worth of mobile homes: $293,399
Housing units lacking complete kitchen facilities in 2022: 2.1%
House/condo owner moved in on average 15 years ago
Renter moved in on average 5 years ago

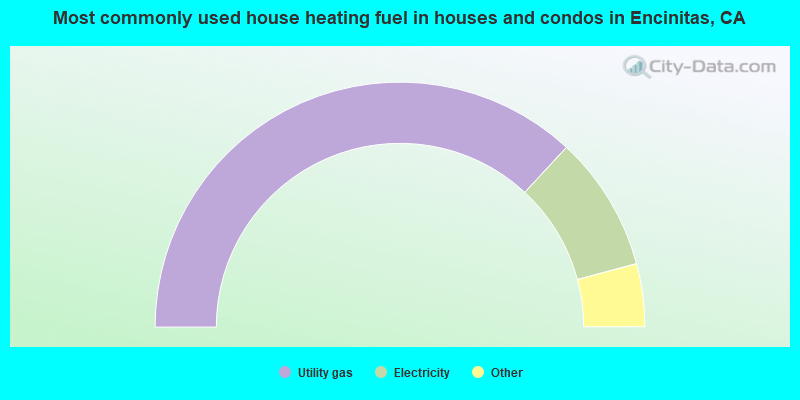
- 73.8%Utility gas
- 17.9%Electricity
- 3.1%Solar energy
- 2.7%No fuel used
- 2.1%Bottled, tank, or LP gas
- 0.4%Wood
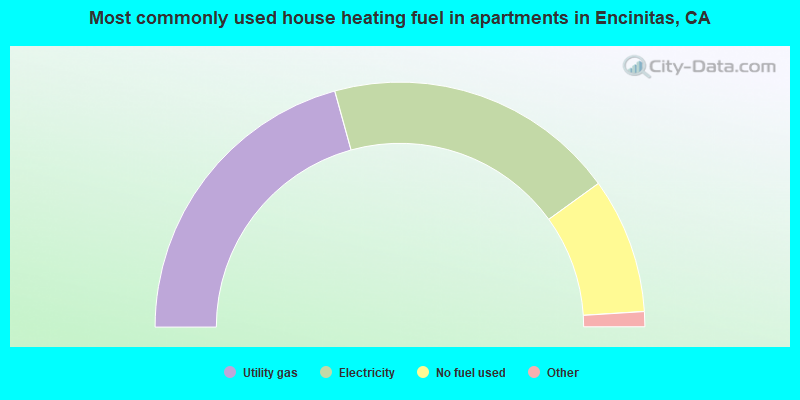
- 41.4%Utility gas
- 38.6%Electricity
- 17.9%No fuel used
- 1.4%Bottled, tank, or LP gas
- 0.3%Solar energy
- 0.2%Other fuel
Private vs. public school enrollment:
| Here: | 18.9% |
| California: | 10.5% |
| Here: | 11.0% |
| California: | 8.5% |
| Here: | 21.1% |
| California: | 15.9% |


