Englewood Cliffs, NJ (New Jersey) Houses and Residents
| Englewood Cliffs: | $1,268,901 |
| New Jersey: | $428,900 |
Total population: 5,385 (Urban population: 5,322, Rural population: 0)
Houses: 2,061 (1,871 occupied: 1,556 owner occupied, 324 renter occupied)
| % of renters here: | 17% |
| State: | 35% |
Housing density: 985 houses/condos per square mile
Median price asked for vacant for-sale houses and condos in 2022: $1,514,715.
Median contract rent in 2022: over $2,000
Median rent asked for vacant for-rent units in 2022: $3,955
Median gross rent in Englewood Cliffs, NJ in 2022: over $2,000
Housing units in Englewood Cliffs with a mortgage: 714 (126 second mortgage, 0 home equity loan, 130 both second mortgage and home equity loan)
Houses without a mortgage: 39
Median household income for houses/condos with a mortgage: $250,408
Median household income for apartments without a mortgage: $179,215
Median monthly housing costs: $2,619
Compare current foreclosures near Englewood Cliffs, NJ:
| Photo | Address | Area | Beds / Baths | Price | Details |
|---|---|---|---|---|---|

|
#1
Allison Dr
Englewood Cliffs, NJ 07632
|
2,792 sq. feet
|
- baths - beds |
show details | |

|
#2
E Palisade Ave Unit 126
Englewood Cliffs, NJ 07632
|
- sq. feet
|
- baths - beds |
show details | |

|
#3
Anderson Ave
Englewood Cliffs, NJ 07632
|
3,158 sq. feet
|
- baths - beds |
show details | |

|
#4
Rock Rd
Englewood Cliffs, NJ 07632
|
- sq. feet
|
- baths - beds |
show details | |

|
#5
Allison Dr
Englewood Cliffs, NJ 07632
|
2,792 sq. feet
|
- baths - beds |
show details | |

|
#6
Center St
Englewood Cliffs, NJ 07632
|
3,644 sq. feet
|
- baths - beds |
show details | |

|
#7
Allison Dr
Englewood Cliffs, NJ 07632
|
2,792 sq. feet
|
- baths - beds |
show details | |

|
#8
Dillingham Pl
Englewood Cliffs, NJ 07632
|
1,821 sq. feet
|
- baths - beds |
show details | |

|
#9
Jane Dr
Englewood Cliffs, NJ 07632
|
1,818 sq. feet
|
- baths - beds |
show details | |

|
#10
Sylvan Ave
Englewood Cliffs, NJ 07632
|
- sq. feet
|
- baths - beds |
show details |
| Photo | Address | Area | Beds / Baths | Price | Details |
|---|---|---|---|---|---|

|
#11
1st St
Englewood Cliffs, NJ 07632
|
1,467 sq. feet
|
- baths - beds |
show details | |

|
#12
Berkshire Pl
Englewood Cliffs, NJ 07632
|
2,068 sq. feet
|
- baths - beds |
show details | |

|
#13
S Orange Ave
Newark, NJ 07103
|
989 sq. feet
|
1 baths 2 beds |
$289,900
|
show details |

|
#14
90th St Apt 5d
Jackson Heights, NY 11372
|
1,000 sq. feet
|
1 baths 2 beds |
$269,900
|
show details |

|
#15
Olinville Ave Apt 11c
Bronx, NY 10467
|
1,000 sq. feet
|
2 baths 3 beds |
$385,000
|
show details |

|
#16
17th Ave 1st Floor
Whitestone, NY 11357
|
610 sq. feet
|
1 baths 1 beds |
$229,900
|
show details |

|
#17
Tulip Ave # Gl2
Floral Park, NY 11001
|
1,200 sq. feet
|
1 baths 2 beds |
$409,900
|
show details |

|
#18
E 52nd St Apt 4f
New York, NY 10022
|
700 sq. feet
|
1 baths 1 beds |
$689,900
|
show details |

|
#19
Forest Ave
Paramus, NJ 07652
|
2,428 sq. feet
|
3 baths 5 beds |
$749,900
|
show details |

|
#20
Francis Lewis Blvd
Queens Village, NY 11429
|
844 sq. feet
|
1 baths 2 beds |
$589,900
|
show details |
| Photo | Address | Area | Beds / Baths | Price | Details |
|---|---|---|---|---|---|

|
#21
7th St
Ridgefield Park, NJ 07660
|
1,382 sq. feet
|
1 baths 3 beds |
$539,900
|
show details |

|
#22
Park Ave Apt 12
North Bergen, NJ 07047
|
835 sq. feet
|
1 baths 2 beds |
$357,900
|
show details |

|
#23
Davenport Ave Apt 1b
New Rochelle, NY 10805
|
750 sq. feet
|
1 baths 1 beds |
$159,900
|
show details |

|
#24
Swinton Ave
Bronx, NY 10465
|
1,938 sq. feet
|
2 baths 3 beds |
$789,900
|
show details |

|
#25
Highland Ave
Cliffside Park, NJ 07010
|
2,451 sq. feet
|
3 baths 3 beds |
$832,000
|
show details |

|
#26
N Broadway Apt A6
Yonkers, NY 10701
|
950 sq. feet
|
2 baths 2 beds |
$219,900
|
show details |

|
#27
Martin Dr
Harrington Park, NJ 07640
|
1,746 sq. feet
|
3 baths 3 beds |
$950,000
|
show details |

|
#28
Ackerman St
Maywood, NJ 07607
|
1,914 sq. feet
|
4 baths 5 beds |
$525,200
|
show details |

|
#29
Woodside Ave
Newark, NJ 07104
|
2,188 sq. feet
|
3 baths 4 beds |
$649,900
|
show details |

|
#30
Grand Concourse Apt 3c
Bronx, NY 10452
|
700 sq. feet
|
1 baths 1 beds |
$184,500
|
show details |
| Photo | Address | Area | Beds / Baths | Price | Details |
|---|---|---|---|---|---|

|
#31
N Broadway
Irvington, NY 10533
|
850 sq. feet
|
1 baths 2 beds |
$315,000
|
show details |

|
#32
Fox Island Rd
Port Chester, NY 10573
|
- sq. feet
|
6 baths 6 beds |
$910,000
|
show details |

|
#33
E 73rd St
New York, NY 10021
|
1,253 sq. feet
|
2 baths 2 beds |
$699,900
|
show details |

|
#34
Ashland Ave
East Orange, NJ 07017
|
2,254 sq. feet
|
1 baths 5 beds |
$272,000
|
show details |

|
#35
E 221st St
Bronx, NY 10467
|
1,890 sq. feet
|
2 baths 3 beds |
$554,900
|
show details |

|
#36
Willow St
Bloomfield, NJ 07003
|
1,092 sq. feet
|
1 baths 3 beds |
$499,900
|
show details |

|
#37
177th St
Jamaica, NY 11433
|
1,156 sq. feet
|
1 baths 3 beds |
$450,000
|
show details |

|
#38
E 36th St Apt 9f
New York, NY 10016
|
700 sq. feet
|
1 baths 1 beds |
$499,900
|
show details |

|
#39
Central Park Ave Apt 9m
Yonkers, NY 10710
|
1,300 sq. feet
|
2 baths 3 beds |
$319,900
|
show details |

|
#40
Fordham Hill Oval
Bronx, NY 10468
|
700 sq. feet
|
1 baths 1 beds |
$154,900
|
show details |
| Photo | Address | Area | Beds / Baths | Price | Details |
|---|---|---|---|---|---|

|
#41
Fordham Hill Oval Apt 12d
Bronx, NY 10468
|
850 sq. feet
|
1 baths 1 beds |
$179,900
|
show details |

|
#42
123rd Ave
Jamaica, NY 11434
|
1,042 sq. feet
|
1 baths 3 beds |
$460,000
|
show details |

|
#43
2nd Ave # 5c
New York, NY 10029
|
550 sq. feet
|
1 baths 1 beds |
$429,900
|
show details |

|
#44
Midland Ave Apt 4h
Bronxville, NY 10708
|
900 sq. feet
|
1 baths 1 beds |
$184,000
|
show details |

|
#45
W Sidney Ave
Mount Vernon, NY 10550
|
2,800 sq. feet
|
3 baths 8 beds |
$454,900
|
show details |

|
#46
96th St
Ozone Park, NY 11417
|
1,520 sq. feet
|
2 baths 3 beds |
$709,900
|
show details |

|
#47
E 81st St Apt 4c
New York, NY 10028
|
696 sq. feet
|
1 baths 1 beds |
$745,000
|
show details |

|
#48
72nd Avenue
Bellerose, NY 11426
|
850 sq. feet
|
1 baths 1 beds |
$259,900
|
show details |

|
#49
Crane Ave
White Plains, NY 10603
|
2,400 sq. feet
|
2 baths 4 beds |
$654,500
|
show details |

|
Check over 1 million property listings on Foreclosure.com!
|
browse all offers | |||


 | Will Affordable housing requirement destroy NJ Real Estate? (127 replies) |
| Places to go to see beautiful houses in NJ (22 replies) |
| NJ Real Estate Market. (124 replies) |
| Apartments around Englewood Cliffs? (1 reply) |
| Condo Purchasing Advice - Hudson County (8 replies) |
| Englewood Cliffs found violating Mount Laurel laws for decades (6 replies) |

Median year apartment built: 1986
Household type by relationship:
Households: 5,345- Male householders: 1,015 (43 living alone), Female householders: 843 (223 living alone)
1,374 spouses (1,364 opposite-sex spouses), 16 unmarried partners, (16 opposite-sex unmarried partners), 1,651 children (1,651 natural, 0 adopted, 0 stepchildren), 98 grandchildren, 74 brothers or sisters, 87 parents, 0 foster children, 119 other relatives, 21 non-relatives
- In group quarters: 38
Size of family households: 516 2-persons, 465 3-persons, 420 4-persons, 105 5-persons, 66 6-persons, 9 7-or-more-persons.
Size of nonfamily households: 276 1-person, 11 2-persons.
992 married couples with children.
41 single-parent households (7 men, 34 women).
45.3% of residents of Englewood Cliffs speak English at home.
5.5% of residents speak Spanish at home (81% speak English very well, 15% speak English well, 4% speak English not well).
19.8% of residents speak other Indo-European language at home (86% speak English very well, 9% speak English well, 4% speak English not well).
28.3% of residents speak Asian or Pacific Island language at home (61% speak English very well, 29% speak English well, 10% speak English not well).
1.3% of residents speak other language at home (100% speak English very well).
Foreign born population: 2,527 (47.3%)
(82.8% of them are naturalized citizens)
| Here: | 7.7 |
| State: | 6.8 |
| Here: | 7.5 |
| State: | 3.9 |

- Bedrooms in owner-occupied houses and condos in Englewood Cliffs, New Jersey
- 0no bedroom
- 01 bedroom
- 932 bedrooms
- 5133 bedrooms
- 5274 bedrooms
- 4245+ bedrooms

- Bedrooms in renter-occupied apartments in Englewood Cliffs, New Jersey
- 0no bedroom
- 271 bedroom
- 382 bedrooms
- 823 bedrooms
- 1234 bedrooms
- 545+ bedrooms

- Cars and other vehicles available in Englewood Cliffs in owner-occupied houses/condos
- 10no vehicle
- 2481 vehicle
- 8882 vehicles
- 3523 vehicles
- 514 vehicles
- 85+ vehicles

- Cars and other vehicles available in Englewood Cliffs in renter-occupied apartments
- 0no vehicle
- 1191 vehicle
- 1862 vehicles
- 193 vehicles
- 04 vehicles
- 05+ vehicles

- Rooms in owner-occupied houses in Englewood Cliffs, New Jersey
- 01 room
- 02 rooms
- 03 rooms
- 364 rooms
- 1455 rooms
- 1666 rooms
- 3437 rooms
- 2788 rooms
- 5899+ rooms

- Rooms in renter-occupied apartments in Englewood Cliffs, New Jersey
- 01 room
- 02 rooms
- 103 rooms
- 544 rooms
- 175 rooms
- 136 rooms
- 377 rooms
- 1338 rooms
- 619+ rooms


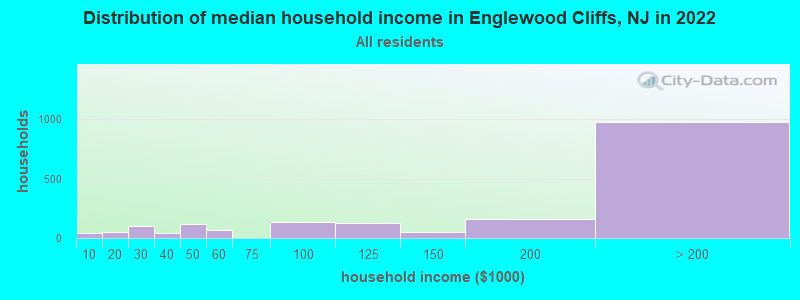
Englewood Cliffs, NJ household income distribution

- 40Less than $10,000
- 48$10,000 to $19,999
- 101$20,000 to $29,999
- 43$30,000 to $39,999
- 117$40,000 to $49,999
- 64$50,000 to $59,999
- 136$75,000 to $99,999
- 123$100,000 to $124,999
- 52$125,000 to $149,999
- 156$150,000 to $199,999
- 977$200,000 or more
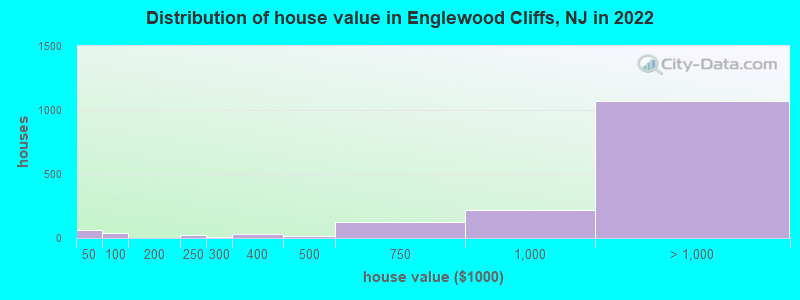
Home value of owner - occupied houses in 2022 in Englewood Cliffs, NJ
-
- 41Less than $10,000
- 18$40,000 to $49,999
- 21$80,000 to $89,999
- 20$200,000 to $249,999
- 10$250,000 to $299,999
- 30$300,000 to $399,999
- 16$400,000 to $499,999
- 123$500,000 to $749,999
- 216$750,000 to $999,999
- 455$1,000,000 to $1,499,999
- 245$1,500,000 to $1,999,999
- 371$2,000,000 or more
Rent paid by renters in 2022 in Englewood Cliffs, NJ
-
- 9$500 to $549
- 12$1,250 to $1,499
- 46$1,500 to $1,999
- 19$2,000 to $2,499
- 9$2,500 to $2,999
- 224$3,500 or more
- 13No cash rent

Percentage of workers working in this county: 54.1%
Number of people working at home: 607 (22.8% of all workers)
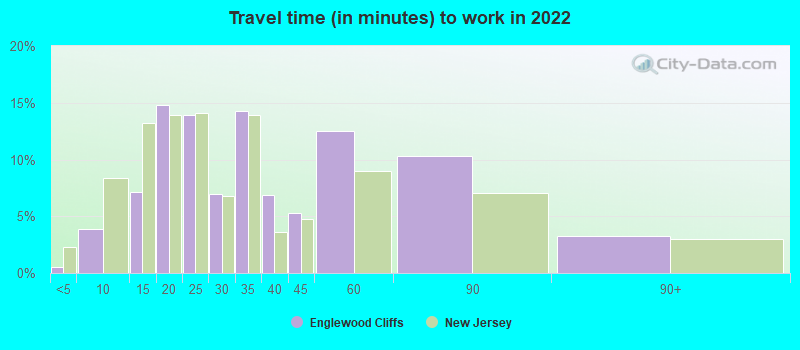
Travel time to work (commute)
- Less than 5 minutes: 0
- 5 to 9 minutes: 152
- 10 to 14 minutes: 372
- 15 to 19 minutes: 189
- 20 to 24 minutes: 192
- 25 to 29 minutes: 35
- 30 to 34 minutes: 169
- 35 to 39 minutes: 60
- 40 to 44 minutes: 64
- 45 to 59 minutes: 234
- 60 to 89 minutes: 511
- 90 or more minutes: 68
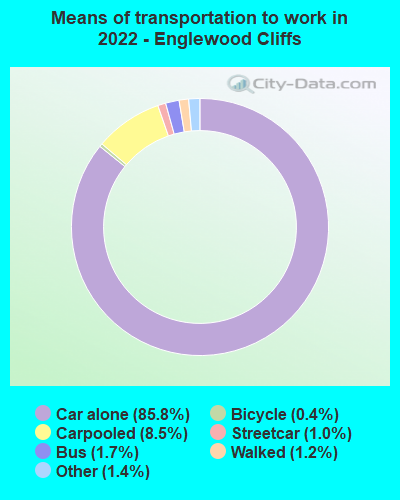
Means of transportation to work:
- Drove a car alone: 6,643 (75.6%)
- Carpooled: 791 (9.0%)
- Bus: 119 (1.4%)
- Subway or elevated rail: 66 (0.8%)
- Long-distance train or commuter rail: 2 (0.0%)
- Taxi: 125 (1.4%)
- Bicycle: 20 (0.2%)
- Walked: 102 (1.2%)
- Worked at home: 607 (6.9%)
- Unemployment by race in 2022
- Unemployment rate for White non-Hispanic residents
- 3.1%Males
- 1.7%Females
- Unemployment rate for Asian residents
- 10.1%Males
- 1.8%Females
- Unemployment rate for two or more race residents
- 10.0%Males
- 19.8%Females
- Unemployment rate for Hispanic or Latino residents
- 16.6%Males
- 11.4%Females

- Year of entry for the foreign-born population in Englewood Cliffs, New Jersey
- 4282010 or later
- 2722000 to 2009
- 6911990 to 1999
- 6021980 to 1989
- 4761970 to 1979
- 580Before 1970

First ancestries reported:
- Italian: 324 (9.5%)
- Greek: 140 (4.1%)
- American: 125 (3.7%)
- Russian: 117 (3.4%)
- Armenian: 100 (2.9%)
- Iranian: 62 (1.8%)
- Polish: 61 (1.8%)
- Cypriot: 60 (1.8%)
- German: 32 (0.9%)
- Hungarian: 28 (0.8%)
- Irish: 25 (0.7%)
- Swedish: 17 (0.5%)
- Northern European: 14 (0.4%)
- Eastern European: 7 (0.2%)
- French: 7 (0.2%)
- European: 4 (0.1%)
- Ukrainian: 3 (0.09%)
Most common places of birth for foreign-born residents (%):
| Englewood Cliffs: | 27.3% (689) |
| New Jersey: | 3.3% (70,512) |
| Englewood Cliffs: | 10.4% (262) |
| New Jersey: | 3.7% (78,969) |
| Englewood Cliffs: | 8.0% (201) |
| New Jersey: | 4.0% (85,934) |
| Englewood Cliffs: | 6.8% (173) |
| New Jersey: | 0.2% (4,947) |
| Englewood Cliffs: | 5.8% (147) |
| New Jersey: | 0.5% (10,975) |
| Englewood Cliffs: | 4.5% (114) |
| New Jersey: | 1.1% (22,760) |
| Englewood Cliffs: | 4.3% (109) |
| New Jersey: | 12.8% (274,609) |
| Englewood Cliffs: | 4.2% (107) |
| New Jersey: | 0.7% (15,548) |
| Englewood Cliffs: | 3.3% (83) |
| New Jersey: | 0.3% (7,501) |
| Englewood Cliffs: | 3.2% (82) |
| New Jersey: | 0.6% (12,793) |
| Englewood Cliffs: | 2.5% (63) |
| New Jersey: | 9.7% (209,055) |
| Englewood Cliffs: | 2.5% (62) |
| New Jersey: | 0.8% (16,778) |
| Englewood Cliffs: | 2.1% (52) |
| New Jersey: | 4.2% (90,817) |
| Englewood Cliffs: | 1.9% (47) |
| New Jersey: | 0.5% (10,042) |
Place of birth for U.S.-born residents:
- This state: 1,510
- Other state: 1,324
- Northeast: 1,033
- Midwest: 71
- South: 78
- West: 157
90.6% of Englewood Cliffs residents lived in the same house 1 years ago.
Out of people who lived in different houses, 36.1% lived in this county.
Out of people who lived in different counties, 21.3% lived in New Jersey.
| Englewood Cliffs: | 90.6% |
| State average: | 90.4% |
Education attainment for males 25 years and older:
- No schooling: 25
- Nursery to 4th grade: 0
- 5th and 6th grade: 0
- 7th and 8th grade: 45
- 9th grade: 0
- 10th grade: 0
- 11th grade: 0
- 12th grade, no diploma: 10
- High school graduate (or equivalency): 169
- Less than 1 year of college: 37
- Some college more than 1 year, no degree: 78
- Associate degree: 74
- Bachelor's degree: 534
- Master's degree: 399
- Professional school degree: 377
- Doctorate degree: 38

Education attainment for females 25 years and older:
- No schooling: 14
- Nursery to 4th grade: 6
- 5th and 6th grade: 27
- 7th and 8th grade: 0
- 9th grade: 0
- 10th grade: 0
- 11th grade: 0
- 12th grade, no diploma: 19
- High school graduate (or equivalency): 203
- Less than 1 year of college: 62
- Some college more than 1 year, no degree: 32
- Associate degree: 163
- Bachelor's degree: 750
- Master's degree: 309
- Professional school degree: 342
- Doctorate degree: 204


Housing units in structures:
- One, detached: 1,916
- One, attached: 50
- Two: 31
- 3 or 4: 14
- 5 to 9: 15
- 10 to 19: 17
- Mobile homes: 18
House/condo owner moved in on average 12 years ago
Renter moved in on average 1 years ago

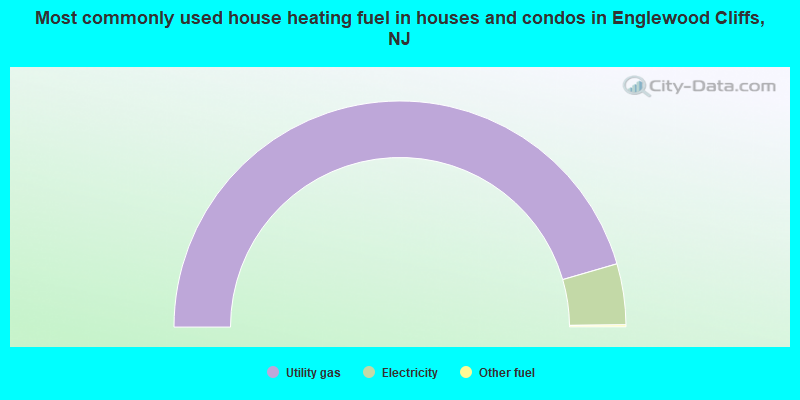
- 91.0%Utility gas
- 8.7%Electricity
- 0.3%Other fuel
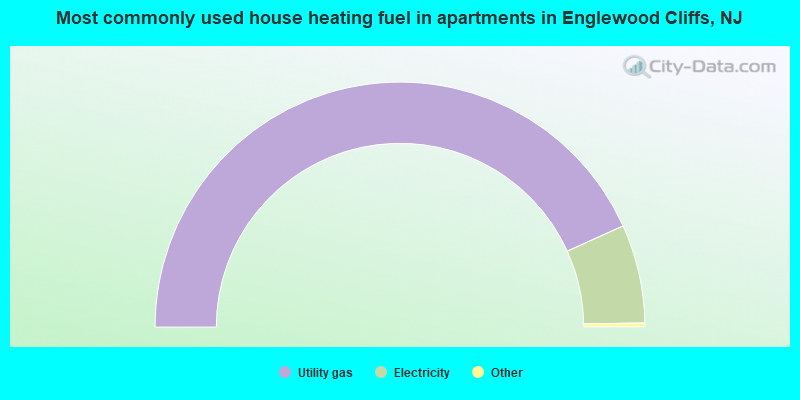
- 86.9%Utility gas
- 13.1%Electricity
Private vs. public school enrollment:
| Here: | 18.2% |
| New Jersey: | 12.3% |
| Here: | 45.7% |
| New Jersey: | 13.1% |
| Here: | 59.8% |
| New Jersey: | 33.2% |


