Englewood, CO (Colorado) Houses and Residents
| Englewood: | $539,942 |
| Colorado: | $531,100 |
Mean price in 2022:
Detached houses: $624,251
Here: $624,251 State: $676,667 Townhouses or other attached units: $604,470
Here: $604,470 State: $526,340 In 2-unit structures: $287,622
Here: $287,622 State: $431,509 In 5-or-more-unit structures: $319,481
Here: $319,481 State: $417,586 Mobile homes: $60,675
Here: $60,675 State: $115,510
Total population: 32,480 (Urban population: 31,589, Rural population: 0)
Houses: 17,068 (16,071 occupied: 7,797 owner occupied, 8,370 renter occupied)
| % of renters here: | 52% |
| State: | 34% |
Housing density: 2,605 houses/condos per square mile
Median price asked for vacant for-sale houses and condos in 2022: $4,220,375.
Median contract rent in 2022: $1,426 (lower quartile is $1,113, upper quartile is $1,831)
Median rent asked for vacant for-rent units in 2022: $1,618
Median gross rent in Englewood, CO in 2022: $1,529
Housing units in Englewood with a mortgage: 5,111 (719 second mortgage, 3 home equity loan, 622 both second mortgage and home equity loan)
Houses without a mortgage: 21
Median household income for houses/condos with a mortgage: $128,464
Median household income for apartments without a mortgage: $65,779
Median monthly housing costs: $1,526
Compare current foreclosures in Englewood, CO:
| Photo | Address | Area | Beds / Baths | Price | Details |
|---|---|---|---|---|---|

|
#1
E Briarwood Ave
Englewood, CO 80112
|
1,778 sq. feet
|
1 baths 3 beds |
show details | |

|
#2
E Davies Pl
Englewood, CO 80112
|
1,116 sq. feet
|
2 baths 4 beds |
show details | |

|
#3
S Fox St
Englewood, CO 80110
|
1,584 sq. feet
|
2 baths 4 beds |
show details | |

|
#4
S Galapago St
Englewood, CO 80110
|
1,040 sq. feet
|
2 baths 3 beds |
show details | |

|
#5
W Adriatic Pl
Englewood, CO 80110
|
1,104 sq. feet
|
1 baths 3 beds |
show details | |

|
#6
S Kalispell Ct
Englewood, CO 80112
|
1,240 sq. feet
|
2 baths 3 beds |
show details | |

|
#7
W Lehow Ave Apt 21
Englewood, CO 80110
|
702 sq. feet
|
1 baths 1 beds |
show details | |

|
#8
S Jasmine Way
Englewood, CO 80111
|
2,475 sq. feet
|
2 baths 4 beds |
show details | |

|
#9
W Union Ave
Englewood, CO 80110
|
2,326 sq. feet
|
1 baths 3 beds |
show details | |

|
#10
S Rosemary Cir
Englewood, CO 80112
|
1,887 sq. feet
|
2 baths 3 beds |
show details |
| Photo | Address | Area | Beds / Baths | Price | Details |
|---|---|---|---|---|---|

|
#11
S Geneva Cir
Englewood, CO 80111
|
4,959 sq. feet
|
4 baths 3 beds |
show details | |

|
#12
S Elati St
Englewood, CO 80110
|
1,557 sq. feet
|
1 baths 2 beds |
show details | |

|
#13
S Lima St
Englewood, CO 80111
|
2,497 sq. feet
|
2 baths 4 beds |
show details | |

|
#14
S Wabash Ct
Englewood, CO 80112
|
2,016 sq. feet
|
2 baths 4 beds |
show details | |

|
#15
E Jamison Cir
Englewood, CO 80112
|
1,938 sq. feet
|
3 baths 4 beds |
show details | |

|
#16
E Mineral Cir
Englewood, CO 80112
|
2,604 sq. feet
|
2 baths 4 beds |
show details | |

|
#17
E Nassau Ave
Englewood, CO 80113
|
2,165 sq. feet
|
2 baths 3 beds |
show details | |

|
#18
S Alcott St
Englewood, CO 80110
|
864 sq. feet
|
1 baths 2 beds |
show details | |

|
#19
S Gaylord St
Englewood, CO 80113
|
1,887 sq. feet
|
1 baths 3 beds |
show details | |

|
#20
E Phillips Ln
Englewood, CO 80112
|
2,072 sq. feet
|
2 baths 3 beds |
show details |
| Photo | Address | Area | Beds / Baths | Price | Details |
|---|---|---|---|---|---|

|
#21
E Davies Pl
Englewood, CO 80112
|
1,120 sq. feet
|
1 baths 2 beds |
show details | |

|
#22
S Elati Dr
Englewood, CO 80110
|
1,184 sq. feet
|
2 baths 2 beds |
show details | |

|
#23
E Hinsdale Ave
Englewood, CO 80112
|
1,681 sq. feet
|
2 baths 3 beds |
show details | |

|
#24
S Blackhawk St Unit 10102
Englewood, CO 80112
|
1,170 sq. feet
|
2 baths 2 beds |
show details | |

|
#25
W Tufts Ave
Englewood, CO 80110
|
2,527 sq. feet
|
2 baths 3 beds |
show details | |

|
#26
S Grant St
Englewood, CO 80113
|
2,149 sq. feet
|
2 baths 3 beds |
show details | |

|
#27
S Delaware St
Englewood, CO 80110
|
1,008 sq. feet
|
1 baths 3 beds |
show details | |

|
#28
S Jasmine Way
Englewood, CO 80111
|
2,475 sq. feet
|
2 baths 4 beds |
show details | |

|
#29
E Davies Pl
Englewood, CO 80112
|
2,076 sq. feet
|
2 baths 4 beds |
show details | |

|
#30
S Rosemary Cir
Englewood, CO 80112
|
2,270 sq. feet
|
3 baths 3 beds |
show details |
| Photo | Address | Area | Beds / Baths | Price | Details |
|---|---|---|---|---|---|

|
#31
E Mineral Dr
Englewood, CO 80112
|
2,212 sq. feet
|
2 baths 4 beds |
show details | |

|
#32
E Maplewood Cir
Englewood, CO 80111
|
3,873 sq. feet
|
4 baths 4 beds |
show details | |

|
#33
E Dry Creek Cir
Englewood, CO 80112
|
1,396 sq. feet
|
2 baths 2 beds |
show details | |

|
#34
E Lake Pl
Englewood, CO 80111
|
3,395 sq. feet
|
3 baths 5 beds |
show details | |

|
#35
S Monaco Cir E
Englewood, CO 80112
|
2,554 sq. feet
|
3 baths 2 beds |
show details | |

|
#36
E Berry Ave
Englewood, CO 80111
|
4,211 sq. feet
|
3 baths 3 beds |
show details | |

|
#37
S Dale Ct
Englewood, CO 80110
|
1,550 sq. feet
|
2 baths 3 beds |
show details | |

|
#38
E Lake Cir
Englewood, CO 80111
|
3,727 sq. feet
|
3 baths 3 beds |
show details | |

|
#39
S Rosemary Cir
Englewood, CO 80112
|
2,270 sq. feet
|
3 baths 3 beds |
show details | |

|
#40
E Berry Ave
Englewood, CO 80111
|
4,211 sq. feet
|
3 baths 3 beds |
show details |
| Photo | Address | Area | Beds / Baths | Price | Details |
|---|---|---|---|---|---|

|
#41
S Downing St
Englewood, CO 80113
|
1,241 sq. feet
|
1 baths 2 beds |
show details | |

|
#42
S Fox St
Englewood, CO 80110
|
3,174 sq. feet
|
4 baths 8 beds |
show details | |

|
#43
S Fox St
Englewood, CO 80110
|
1,450 sq. feet
|
2 baths 2 beds |
show details | |

|
#44
E Maplewood Ave
Englewood, CO 80111
|
2,683 sq. feet
|
3 baths 3 beds |
show details | |

|
#45
S Kalispell Cir
Englewood, CO 80112
|
1,240 sq. feet
|
1 baths 3 beds |
show details | |

|
#46
S Jamaica Ct
Englewood, CO 80111
|
2,296 sq. feet
|
2 baths 4 beds |
show details | |

|
#47
E Berry Ave
Englewood, CO 80111
|
2,310 sq. feet
|
2 baths 4 beds |
show details | |

|
#48
S Xanthia St
Englewood, CO 80112
|
2,422 sq. feet
|
2 baths 4 beds |
show details | |

|
#49
E Crestline Ave
Englewood, CO 80111
|
4,593 sq. feet
|
3 baths 5 beds |
show details | |

|
Check over 1 million property listings on Foreclosure.com!
|
browse all offers | |||

Latest news about housing in Englewood, CO collected exclusively by city-data.com from local newspapers, TV, and radio stations

 | Looking to buy a house in Englewood near DTC (12 replies) |
| Englewood Clarification (26 replies) |
| Where to look for homes - job in Englewood 80112 (14 replies) |
| Looking 4 Safe, Trendy neighborhood, homes under $150k (54 replies) |
| Where to rent near Englewood? (17 replies) |
| Renting conditions in south/sw subrubs (Littleton/Englewood/Lakewood) (30 replies) |

Median year apartment built: 1978
Household type by relationship:
Households: 33,703- Male householders: 8,017 (3,315 living alone), Female householders: 7,700 (3,375 living alone)
5,082 spouses (4,990 opposite-sex spouses), 1,549 unmarried partners, (1,513 opposite-sex unmarried partners), 7,010 children (6,490 natural, 265 adopted, 254 stepchildren), 648 grandchildren, 258 brothers or sisters, 327 parents, 37 foster children, 598 other relatives, 2,001 non-relatives
- In group quarters: 471
Size of family households: 3,647 2-persons, 1,378 3-persons, 1,160 4-persons, 338 5-persons, 240 6-persons, 173 7-or-more-persons.
Size of nonfamily households: 7,237 1-person, 1,912 2-persons, 320 3-persons, 104 4-persons, 20 5-persons, 5 6-persons.
3,058 married couples with children.
1,494 single-parent households (587 men, 907 women).
87.6% of residents of Englewood speak English at home.
8.4% of residents speak Spanish at home (70% speak English very well, 11% speak English well, 13% speak English not well, 6% don't speak English at all).
1.9% of residents speak other Indo-European language at home (81% speak English very well, 8% speak English well, 7% speak English not well, 3% don't speak English at all).
1.0% of residents speak Asian or Pacific Island language at home (61% speak English very well, 24% speak English well, 15% speak English not well).
0.8% of residents speak other language at home (93% speak English very well, 2% speak English well, 6% speak English not well).
Foreign born population: 2,476 (7.3%)
(43.1% of them are naturalized citizens)
| Here: | 6.3 |
| State: | 6.8 |
| Here: | 3.4 |
| State: | 4.0 |

- Bedrooms in owner-occupied houses and condos in Englewood, Colorado
- 0no bedroom
- 2581 bedroom
- 2,1642 bedrooms
- 3,3613 bedrooms
- 1,4734 bedrooms
- 5415+ bedrooms

- Bedrooms in renter-occupied apartments in Englewood, Colorado
- 569no bedroom
- 3,6111 bedroom
- 2,8882 bedrooms
- 8553 bedrooms
- 2074 bedrooms
- 2405+ bedrooms

- Cars and other vehicles available in Englewood in owner-occupied houses/condos
- 211no vehicle
- 2,4851 vehicle
- 3,2542 vehicles
- 1,1483 vehicles
- 4944 vehicles
- 2055+ vehicles

- Cars and other vehicles available in Englewood in renter-occupied apartments
- 1,176no vehicle
- 4,3611 vehicle
- 2,0002 vehicles
- 6293 vehicles
- 1294 vehicles
- 765+ vehicles

- Rooms in owner-occupied houses in Englewood, Colorado
- 01 room
- 472 rooms
- 1663 rooms
- 9134 rooms
- 1,4475 rooms
- 1,6426 rooms
- 1,1907 rooms
- 1,0838 rooms
- 1,3089+ rooms

- Rooms in renter-occupied apartments in Englewood, Colorado
- 5521 room
- 1,1782 rooms
- 2,5563 rooms
- 1,9734 rooms
- 6845 rooms
- 6366 rooms
- 3267 rooms
- 1538 rooms
- 3129+ rooms


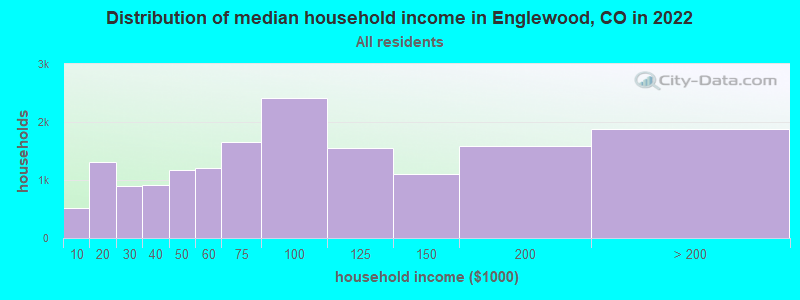
Englewood, CO household income distribution

- 524Less than $10,000
- 1,316$10,000 to $19,999
- 893$20,000 to $29,999
- 906$30,000 to $39,999
- 1,169$40,000 to $49,999
- 1,209$50,000 to $59,999
- 1,652$60,000 to $74,999
- 2,411$75,000 to $99,999
- 1,555$100,000 to $124,999
- 1,101$125,000 to $149,999
- 1,583$150,000 to $199,999
- 1,887$200,000 or more
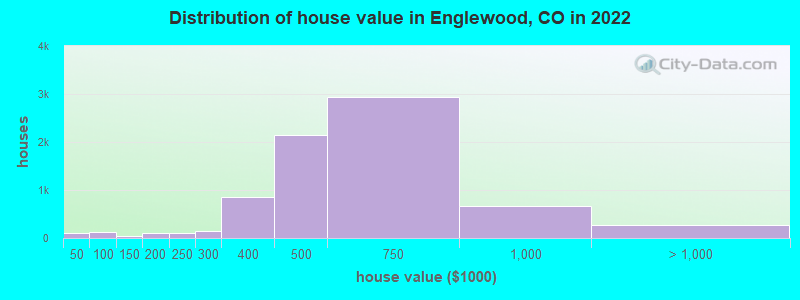
Home value of owner - occupied houses in 2022 in Englewood, CO
-
- 8$15,000 to $19,999
- 8$20,000 to $24,999
- 47$30,000 to $34,999
- 9$35,000 to $39,999
- 31$40,000 to $49,999
- 47$50,000 to $59,999
- 35$60,000 to $69,999
- 4$70,000 to $79,999
- 22$100,000 to $124,999
- 13$125,000 to $149,999
- 50$150,000 to $174,999
- 57$175,000 to $199,999
- 110$200,000 to $249,999
- 153$250,000 to $299,999
- 846$300,000 to $399,999
- 2,152$400,000 to $499,999
- 2,936$500,000 to $749,999
- 663$750,000 to $999,999
- 174$1,000,000 to $1,499,999
- 18$1,500,000 to $1,999,999
- 76$2,000,000 or more
Rent paid by renters in 2022 in Englewood, CO
-
- 26$150 to $199
- 79$200 to $249
- 59$250 to $299
- 82$350 to $399
- 36$400 to $449
- 26$500 to $549
- 142$550 to $599
- 9$600 to $649
- 113$650 to $699
- 8$700 to $749
- 144$750 to $799
- 61$800 to $899
- 497$900 to $999
- 1,655$1,000 to $1,249
- 1,143$1,250 to $1,499
- 2,673$1,500 to $1,999
- 685$2,000 to $2,499
- 325$2,500 to $2,999
- 135$3,000 to $3,499
- 125$3,500 or more
- 128No cash rent


Percentage of workers working in this county: 53.1%
Number of people working at home: 3,978 (19.4% of all workers)
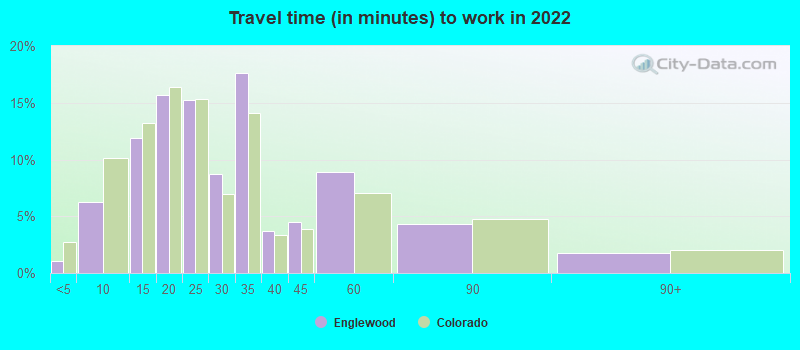
Travel time to work (commute)
- Less than 5 minutes: 379
- 5 to 9 minutes: 1,555
- 10 to 14 minutes: 2,144
- 15 to 19 minutes: 2,673
- 20 to 24 minutes: 2,970
- 25 to 29 minutes: 1,770
- 30 to 34 minutes: 2,597
- 35 to 39 minutes: 491
- 40 to 44 minutes: 562
- 45 to 59 minutes: 809
- 60 to 89 minutes: 470
- 90 or more minutes: 150

Means of transportation to work:
- Drove a car alone: 18,532 (69.2%)
- Carpooled: 2,417 (9.0%)
- Bus: 218 (0.8%)
- Light rail, streetcar or trolley: 167 (0.6%)
- Taxi: 486 (1.8%)
- Bicycle: 76 (0.3%)
- Walked: 514 (1.9%)
- Worked at home: 3,978 (14.9%)

- Unemployment by race in 2022
- Unemployment rate for White non-Hispanic residents
- 3.7%Males
- 1.1%Females
- Unemployment rate for Black residents
- 15.7%Males
- 29.7%Females
- Unemployment rate for American Indian and Alaska Native residents
- 4.4%Females
- Unemployment rate for Asian residents
- 3.4%Males
- Unemployment rate for other race residents
- 2.7%Females
- Unemployment rate for two or more race residents
- 3.2%Males
- 2.6%Females
- Unemployment rate for Hispanic or Latino residents
- 0.7%Males
- 1.9%Females

- Year of entry for the foreign-born population in Englewood, Colorado
- 6492010 or later
- 7972000 to 2009
- 5671990 to 1999
- 3731980 to 1989
- 2201970 to 1979
- 296Before 1970
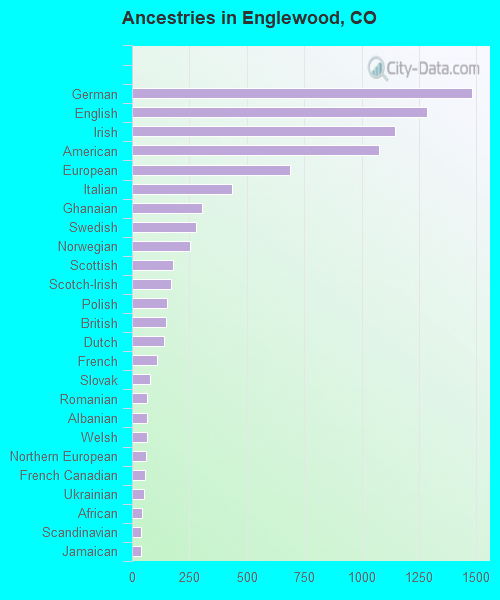
First ancestries reported:
- German: 1,481 (10.0%)
- English: 1,287 (8.7%)
- Irish: 1,144 (7.8%)
- American: 1,075 (7.3%)
- European: 687 (4.7%)
- Italian: 435 (2.9%)
- Ghanaian: 307 (2.1%)
- Swedish: 279 (1.9%)
- Norwegian: 254 (1.7%)
- Scottish: 177 (1.2%)
- Scotch-Irish: 169 (1.1%)
- Polish: 152 (1.0%)
- British: 146 (1.0%)
- Dutch: 139 (0.9%)
- French: 107 (0.7%)
- Slovak: 77 (0.5%)
- Romanian: 67 (0.5%)
- Albanian: 65 (0.4%)
- Welsh: 65 (0.4%)
- Northern European: 60 (0.4%)
- French Canadian: 56 (0.4%)
- Ukrainian: 53 (0.4%)
- African: 43 (0.3%)
- Scandinavian: 39 (0.3%)
- Jamaican: 39 (0.3%)
- Russian: 38 (0.3%)
- Canadian: 36 (0.2%)
- Greek: 34 (0.2%)
- Danish: 34 (0.2%)
- Kenyan: 25 (0.2%)
- Austrian: 21 (0.1%)
- Bulgarian: 21 (0.1%)
- Hungarian: 20 (0.1%)
- Czech: 20 (0.1%)
- Iranian: 19 (0.1%)
- Brazilian: 18 (0.1%)
- Moroccan: 16 (0.1%)
- Lithuanian: 15 (0.1%)
- Arab: 12 (0.08%)
- Croatian: 12 (0.08%)
- Swiss: 12 (0.08%)
- Basque: 10 (0.07%)
- Turkish: 9 (0.06%)
- Belizean: 9 (0.06%)
- Slovene: 8 (0.05%)
- Australian: 7 (0.05%)
- German Russian: 7 (0.05%)
- Portuguese: 6 (0.04%)
- Eastern European: 6 (0.04%)
- Nigerian: 6 (0.04%)
Most common places of birth for foreign-born residents (%):
| Englewood: | 32.7% (795) |
| Colorado: | 38.3% (209,491) |
| Englewood: | 11.7% (283) |
| Colorado: | 0.7% (3,596) |
| Englewood: | 3.7% (89) |
| Colorado: | 1.1% (6,142) |
| Englewood: | 3.7% (89) |
| Colorado: | 1.4% (7,898) |
| Englewood: | 3.6% (87) |
| Colorado: | 2.7% (15,026) |
| Englewood: | 3.1% (76) |
| Colorado: | 3.3% (17,998) |
| Englewood: | 2.7% (66) |
| Colorado: | 0.4% (2,063) |
| Englewood: | 2.5% (61) |
| Colorado: | 1.1% (5,971) |
| Englewood: | 2.3% (57) |
| Colorado: | 0.4% (1,938) |
| Englewood: | 2.3% (55) |
| Colorado: | 0.2% (1,091) |
| Englewood: | 2.1% (52) |
| Colorado: | 0.2% (1,244) |
| Englewood: | 2.1% (52) |
| Colorado: | 0.4% (1,985) |
| Englewood: | 2.0% (48) |
| Colorado: | 2.5% (13,706) |
| Englewood: | 1.9% (47) |
| Colorado: | 1.2% (6,672) |
| Englewood: | 1.9% (46) |
| Colorado: | 0.8% (4,267) |
| Englewood: | 1.9% (46) |
| Colorado: | 3.0% (16,616) |
| Englewood: | 1.8% (43) |
| Colorado: | 1.0% (5,365) |
| Englewood: | 1.7% (41) |
| Colorado: | 1.1% (5,799) |
| Englewood: | 1.6% (38) |
| Colorado: | 0.9% (4,829) |
Place of birth for U.S.-born residents:
- This state: 14,599
- Other state: 15,859
- Northeast: 2,411
- Midwest: 5,961
- South: 4,064
- West: 3,408
80.0% of Englewood residents lived in the same house 1 years ago.
Out of people who lived in different houses, 23.2% lived in this county.
Out of people who lived in different counties, 66.0% lived in Colorado.
| Englewood: | 80.0% |
| State average: | 83.6% |
Education attainment for males 25 years and older:
- No schooling: 198
- Nursery to 4th grade: 18
- 5th and 6th grade: 15
- 7th and 8th grade: 95
- 9th grade: 96
- 10th grade: 48
- 11th grade: 69
- 12th grade, no diploma: 347
- High school graduate (or equivalency): 3,421
- Less than 1 year of college: 761
- Some college more than 1 year, no degree: 1,699
- Associate degree: 803
- Bachelor's degree: 3,670
- Master's degree: 1,270
- Professional school degree: 381
- Doctorate degree: 229

Education attainment for females 25 years and older:
- No schooling: 130
- Nursery to 4th grade: 10
- 5th and 6th grade: 30
- 7th and 8th grade: 64
- 9th grade: 70
- 10th grade: 148
- 11th grade: 93
- 12th grade, no diploma: 154
- High school graduate (or equivalency): 2,624
- Less than 1 year of college: 815
- Some college more than 1 year, no degree: 1,462
- Associate degree: 699
- Bachelor's degree: 4,030
- Master's degree: 1,588
- Professional school degree: 267
- Doctorate degree: 275


Housing units in structures:
- One, detached: 8,659
- One, attached: 1,081
- Two: 515
- 3 or 4: 567
- 5 to 9: 351
- 10 to 19: 1,109
- 20 to 49: 1,869
- 50 or more: 2,757
- Mobile homes: 155
Housing units lacking complete kitchen facilities in 2022: 0.5%
House/condo owner moved in on average 12 years ago
Renter moved in on average 3 years ago

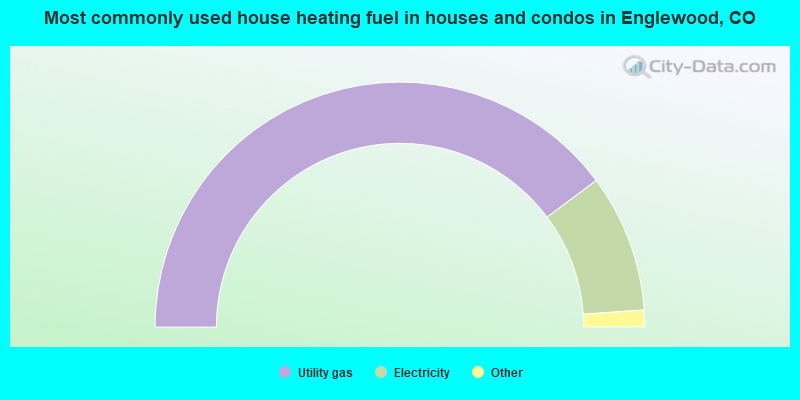
- 79.6%Utility gas
- 18.2%Electricity
- 0.8%Bottled, tank, or LP gas
- 0.7%Wood
- 0.4%Solar energy
- 0.2%No fuel used
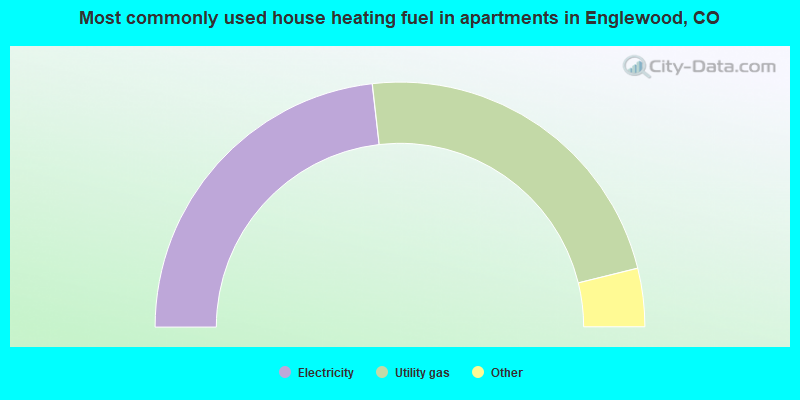
- 46.4%Electricity
- 45.9%Utility gas
- 4.0%Other fuel
- 1.7%No fuel used
- 1.6%Bottled, tank, or LP gas
- 0.3%Fuel oil, kerosene, etc.
- 0.2%Solar energy
Private vs. public school enrollment:
| Here: | 18.4% |
| Colorado: | 11.4% |
| Here: | 16.2% |
| Colorado: | 8.5% |
| Here: | 15.7% |
| Colorado: | 14.0% |


