Englewood, FL (Florida) Houses and Residents
Estimated median house or condo value in 2022: $333,530 (it was $79,900 in 2000 )
Englewood:
$333,530Florida:
$354,100
Lower value quartile - upper value quartile: $217,217 - $541,590Mean price in 2022: Detached houses: $392,424 Here:
$392,424State:
$500,941
Townhouses or other attached units: $213,935 Here:
$213,935State:
$370,869
In 2-unit structures: $1,975,583 Here:
$1,975,583State:
$423,188
In 3-to-4-unit structures: $202,121 Here:
$202,121State:
$309,944
In 5-or-more-unit structures: $205,191 Here:
$205,191State:
$447,145
Mobile homes: $107,802 Here:
$107,802State:
$113,202
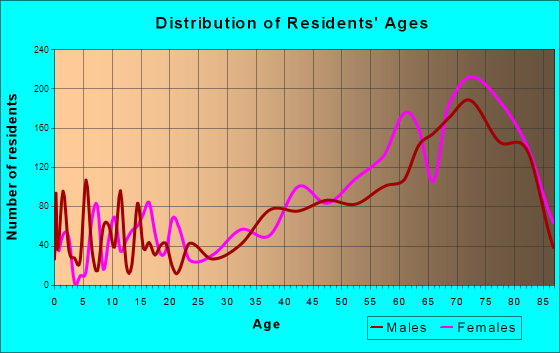
Total population: 14,863 (All urban)
Houses: 14,917 (10,591 occupied: 9,432 owner occupied, 1,501 renter occupied )
% of renters here:
14%State:
33%
Housing density: 1,517 houses/condos per square mile
Median price asked for vacant for-sale houses and condos in 2022: $125,503.
Median contract rent in 2022: $1,180 (lower quartile is $900, upper quartile is $1,583)
Median rent asked for vacant for-rent units in 2022: $4,802
Median gross rent in Englewood, FL in 2022: $1,281
Housing units in Englewood with a mortgage: 2,895 (208 second mortgage, 0 home equity loan, 197 both second mortgage and home equity loan )Houses without a mortgage: 145
Median household income for houses/condos with a mortgage: $75,581
Median household income for apartments without a mortgage: $63,490
Median monthly housing costs: $795
Data:
Median house or condo value ($)
Median house or condo value ($ change since 2000)
Median house or condo value ($) - White
Median house or condo value ($) - Black or African American
Median house or condo value ($) - Asian
Median house or condo value ($) - Hispanic or Latino
Median house or condo value ($) - American Indian and Alaska Native
Median house or condo value ($) - Multirace
Median house or condo value ($) - Other Race
Median price asked for mobile homes ($)
Household density (households per square mile)
Mean house or condo value by units in structure - 1, detached ($)
Mean house or condo value by units in structure - 1, attached ($)
Mean house or condo value by units in structure - 2 ($)
Mean house or condo value by units in structure by units in structure - 3 or 4 ($)
Mean house or condo value by units in structure - 5 or more ($)
Mean house or condo value by units in structure - Boat, RV, van, etc. ($)
Mean house or condo value by units in structure - Mobile home ($)
Median contract rent ($)
Median contract rent - Lower quartile ($)
Median contract rent - Upper quartile ($)
Median gross rent ($)
Urban houses (%)
Rural houses (%)
Houses occupied (%)
Houses occupied (% change since 2000)
Houses owner occupied (%)
Houses owner occupied (% change since 2000)
Houses renter occupied (%)
Houses renter occupied (% change since 2000)
Vacant housing units - For rent (%)
Vacant housing units - For rent (% change since 2000)
Vacant housing units - For sale only (%)
Vacant housing units - For sale only (% change since 2000)
Vacant housing units - Rented or sold, not occupied (%)
Vacant housing units - Rented or sold, not occupied (% change since 2000)
Vacant housing units - For seasonal, recreational, or occasional use (%)
Vacant housing units - For seasonal, recreational, or occasional use (% change since 2000)
Vacant housing units - For migrant workers (%)
Vacant housing units - For migrant workers (% change since 2000)
Vacant housing units - Other vacant (%)
Vacant housing units - Other vacant (% change since 2000)
Median monthly housing costs ($)
Median household income for houses/condos with a mortgage ($)
Median household income for houses/condos without a mortgage ($)
Median household income ($)
Median household income ($) - White
Median household income ($) - Black or African American
Median household income ($) - Asian
Median household income ($) - Hispanic or Latino
Median household income ($) - American Indian and Alaska Native
Median household income ($) - Multirace
Median household income ($) - Other Race
Mortgage status - with mortgage (%)
Mortgage status - with second mortgage (%)
Mortgage status - with home equity loan (%)
Mortgage status - with both second mortgage and home equity loan (%)
Mortgage status - without a mortgage (%)
Median year house/condo built
Median year apartment built
Household type by relationship - Male householder living alone (%)
Household type by relationship - Male householder not living alone (%)
Household type by relationship - Female householder living alone (%)
Household type by relationship - Female householder not living alone (%)
Household type by relationship - Opposite-Sex spouse (%)
Household type by relationship - Same-Sex spouse (%)
Household type by relationship - Opposite-Sex unmarried partner (%)
Household type by relationship - Same-Sex unmarried partner (%)
Household type by relationship - In group quarters (%)
Size of family households - 2-person household (%)
Size of family households - 3-person household (%)
Size of family households - 4-person household (%)
Size of family households - 5-person household (%)
Size of family households - 6-person household (%)
Size of family households - 7-or-more-person household (%)
Size of nonfamily households - 1-person household (%)
Size of nonfamily households - 2-person household (%)
Size of nonfamily households - 3-person household (%)
Size of nonfamily households - 4-person household (%)
Size of nonfamily households - 5-person household (%)
Size of nonfamily households - 6-person household (%)
Size of nonfamily households - 7-or-moreperson household (%)
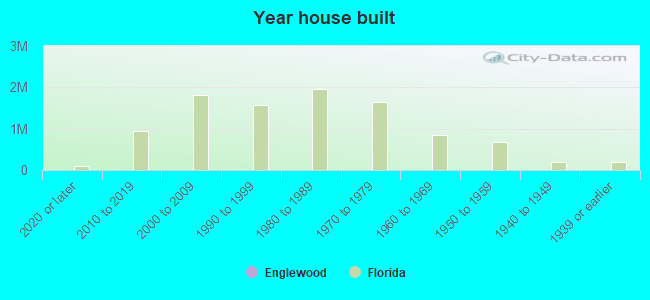
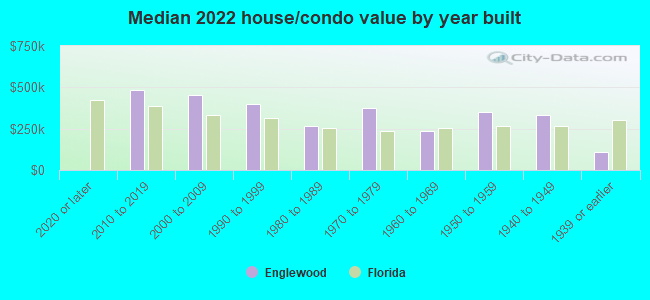
Year house built - Built 2010 or later (%)
Year house built - Built 2000 to 2009 (%)
Year house built - Built 1990 to 1999 (%)
Year house built - Built 1980 to 1989 (%)
Year house built - Built 1970 to 1979 (%)
Year house built - Built 1960 to 1969 (%)
Year house built - Built 1950 to 1959 (%)
Year house built - Built 1940 to 1949 (%)
Year house built - Built 1939 or earlier (%)
Median number of rooms in houses and condos
Median number of rooms in apartments
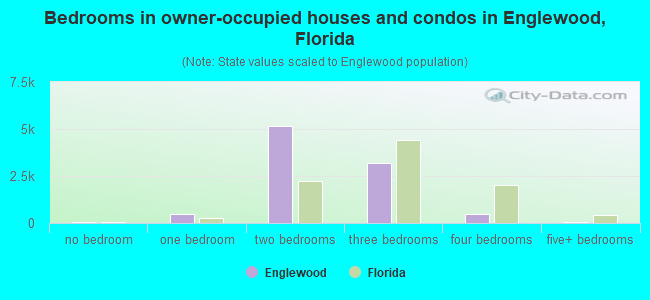
Median number of bedrooms in owner occupied houses
Mean number of bedrooms in owner occupied houses
Median number of bedrooms in renter occupied houses
Mean number of bedrooms in renter occupied houses
Median number of vehichles in owner occupied houses
Mean number of vehichles in owner occupied houses
Median number of vehichles in renter occupied houses
Mean number of vehichles in renter occupied houses
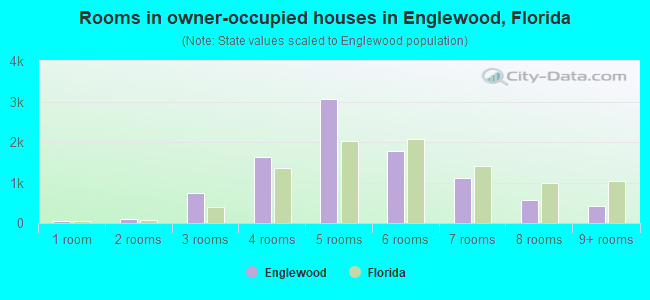
Rooms in owner-occupied houses - 1 room (%)
Rooms in owner-occupied houses - 2 rooms (%)
Rooms in owner-occupied houses - 3 rooms (%)
Rooms in owner-occupied houses - 4 rooms (%)
Rooms in owner-occupied houses - 5 rooms (%)
Rooms in owner-occupied houses - 6 rooms (%)
Rooms in owner-occupied houses - 7 rooms (%)
Rooms in owner-occupied houses - 8 rooms (%)
Rooms in owner-occupied houses - 9+ rooms (%)
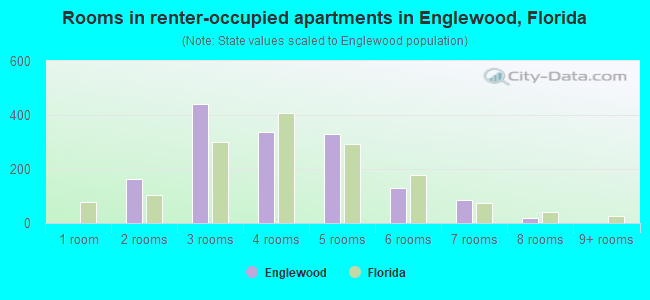
Rooms in renter-occupied houses - 1 room (%)
Rooms in renter-occupied houses - 2 rooms (%)
Rooms in renter-occupied houses - 3 rooms (%)
Rooms in renter-occupied houses - 4 rooms (%)
Rooms in renter-occupied houses - 5 rooms (%)
Rooms in renter-occupied houses - 6 rooms (%)
Rooms in renter-occupied houses - 7 rooms (%)
Rooms in renter-occupied houses - 8 rooms (%)
Rooms in renter-occupied houses - 9+ rooms (%)
Bedrooms in owner-occupied houses - no bedrooms (%)
Bedrooms in owner-occupied houses - 1 bedroom (%)
Bedrooms in owner-occupied houses - 2 bedrooms (%)
Bedrooms in owner-occupied houses - 3 bedrooms (%)
Bedrooms in owner-occupied houses - 4 bedrooms (%)
Bedrooms in owner-occupied houses - 5+ bedrooms (%)
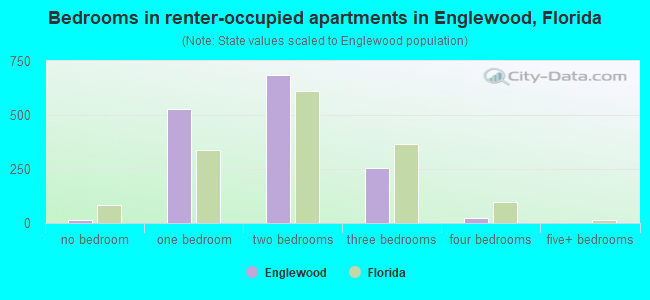
Bedrooms in renter-occupied houses - no bedrooms (%)
Bedrooms in renter-occupied houses - 1 bedroom (%)
Bedrooms in renter-occupied houses - 2 bedrooms (%)
Bedrooms in renter-occupied houses - 3 bedrooms (%)
Bedrooms in renter-occupied houses - 4 bedrooms (%)
Bedrooms in renter-occupied houses - 5+ bedrooms (%)
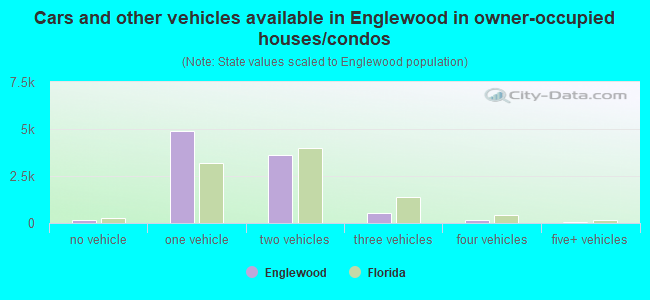
Vehicles available in owner-occupied houses - no vehicle available (%)
Vehicles available in owner-occupied houses - 1 vehicle available(%)
Vehicles available in owner-occupied houses - 2 Vehicles available (%)
Vehicles available in owner-occupied houses - 3 Vehicles available (%)
Vehicles available in owner-occupied houses - 4 Vehicles available (%)
Vehicles available in owner-occupied houses - 5+ Vehicles available (%)
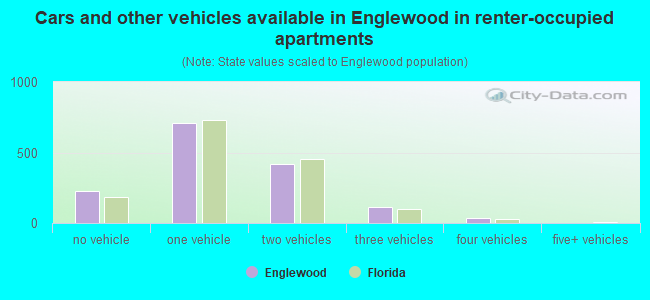
Vehicles available in renter-occupied houses - no vehicle available (%)
Vehicles available in renter-occupied houses - 1 vehicle available (%)
Vehicles available in renter-occupied houses - 2 Vehicles available (%)
Vehicles available in renter-occupied houses - 3 Vehicles available (%)
Vehicles available in renter-occupied houses - 4 Vehicles available (%)
Vehicles available in renter-occupied houses - 5+ Vehicles available (%)
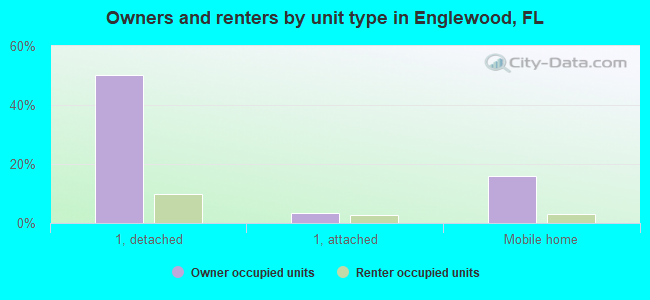
Housing units in structures - 1, detached (%)
Housing units in structures - 1, attached (%)
Housing units in structures - 2 (%)
Housing units in structures - 3 or 4 (%)
Housing units in structures - 5 to 9 (%)
Housing units in structures - 10 to 19 (%)
Housing units in structures - 20 to 49 (%)
Housing units in structures - 50 or more (%)
Housing units in structures - Mobile home (%)
Housing units in structures - Boat, RV, van, etc. (%)
Housing units in structures - Owners - 1, detached (%)
Housing units in structures - Owners - 1, attached (%)
Housing units in structures - Owners - 2 (%)
Housing units in structures - Owners - 3 or 4 (%)
Housing units in structures - Owners - 5 to 9 (%)
Housing units in structures - Owners - 10 to 19 (%)
Housing units in structures - Owners - 20 to 49 (%)
Housing units in structures - Owners - 50 or more (%)
Housing units in structures - Owners - Mobile home (%)
Housing units in structures - Owners - Boat, RV, van, etc. (%)
Housing units in structures - Renters - 1, detached (%)
Housing units in structures - Renters - 1, attached (%)
Housing units in structures - Renters - 2 (%)
Housing units in structures - Renters - 3 or 4 (%)
Housing units in structures - Renters - 5 to 9 (%)
Housing units in structures - Renters - 10 to 19 (%)
Housing units in structures - Renters - 20 to 49 (%)
Housing units in structures - Renters - 50 or more (%)
Housing units in structures - Renters - Mobile home (%)
Housing units in structures - Renters - Boat, RV, van, etc. (%)
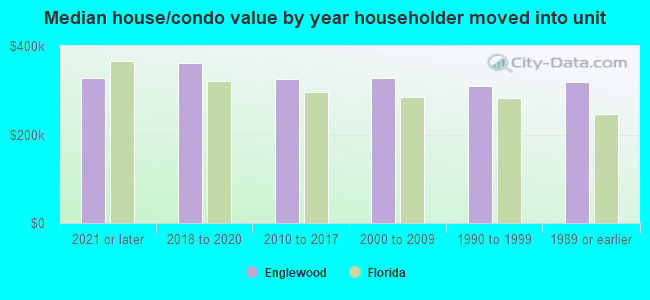
House/condo owner moved in on average (years ago)
Renter moved in on average (years ago)
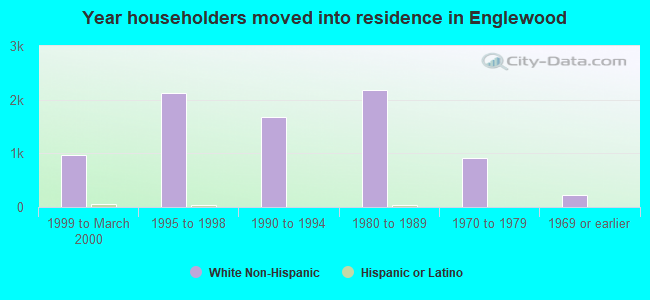
Year householder moved into unit - Moved in 1999 to March 2000 (%)
Year householder moved into unit - Moved in 1999 to March 2000 (%) - White
Year householder moved into unit - Moved in 1999 to March 2000 (%) - Black or African American
Year householder moved into unit - Moved in 1999 to March 2000 (%) - Asian
Year householder moved into unit - Moved in 1999 to March 2000 (%) - Hispanic or Latino
Year householder moved into unit - Moved in 1999 to March 2000 (%) - American Indian and Alaska Native
Year householder moved into unit - Moved in 1999 to March 2000 (%) - Multirace
Year householder moved into unit - Moved in 1999 to March 2000 (%) - Other Race
Year householder moved into unit - Moved in 1995 to 1998 (%)
Year householder moved into unit - Moved in 1995 to 1998 (%) - White
Year householder moved into unit - Moved in 1995 to 1998 (%) - Black or African American
Year householder moved into unit - Moved in 1995 to 1998 (%) - Asian
Year householder moved into unit - Moved in 1995 to 1998 (%) - Hispanic or Latino
Year householder moved into unit - Moved in 1995 to 1998 (%) - American Indian and Alaska Native
Year householder moved into unit - Moved in 1995 to 1998 (%) - Multirace
Year householder moved into unit - Moved in 1995 to 1998 (%) - Other Race
Year householder moved into unit - Moved in 1990 to 1994 (%)
Year householder moved into unit - Moved in 1990 to 1994 (%) - White
Year householder moved into unit - Moved in 1990 to 1994 (%) - Black or African American
Year householder moved into unit - Moved in 1990 to 1994 (%) - Asian
Year householder moved into unit - Moved in 1990 to 1994 (%) - Hispanic or Latino
Year householder moved into unit - Moved in 1990 to 1994 (%) - American Indian and Alaska Native
Year householder moved into unit - Moved in 1990 to 1994 (%) - Multirace
Year householder moved into unit - Moved in 1990 to 1994 (%) - Other Race
Year householder moved into unit - Moved in 1980 to 1989 (%)
Year householder moved into unit - Moved in 1980 to 1989 (%) - White
Year householder moved into unit - Moved in 1980 to 1989 (%) - Black or African American
Year householder moved into unit - Moved in 1980 to 1989 (%) - Asian
Year householder moved into unit - Moved in 1980 to 1989 (%) - Hispanic or Latino
Year householder moved into unit - Moved in 1980 to 1989 (%) - American Indian and Alaska Native
Year householder moved into unit - Moved in 1980 to 1989 (%) - Multirace
Year householder moved into unit - Moved in 1980 to 1989 (%) - Other Race
Year householder moved into unit - Moved in 1970 to 1979 (%)
Year householder moved into unit - Moved in 1970 to 1979 (%) - White
Year householder moved into unit - Moved in 1970 to 1979 (%) - Black or African American
Year householder moved into unit - Moved in 1970 to 1979 (%) - Asian
Year householder moved into unit - Moved in 1970 to 1979 (%) - Hispanic or Latino
Year householder moved into unit - Moved in 1970 to 1979 (%) - American Indian and Alaska Native
Year householder moved into unit - Moved in 1970 to 1979 (%) - Multirace
Year householder moved into unit - Moved in 1970 to 1979 (%) - Other Race
Year householder moved into unit - Moved in 1969 or earlier (%)
Year householder moved into unit - Moved in 1969 or earlier (%) - White
Year householder moved into unit - Moved in 1969 or earlier (%) - Black or African American
Year householder moved into unit - Moved in 1969 or earlier (%) - Asian
Year householder moved into unit - Moved in 1969 or earlier (%) - Hispanic or Latino
Year householder moved into unit - Moved in 1969 or earlier (%) - American Indian and Alaska Native
Year householder moved into unit - Moved in 1969 or earlier (%) - Multirace
Year householder moved into unit - Moved in 1969 or earlier (%) - Other Race
Housing units lacking complete plumbing facilities (%)
Housing units lacking complete kitchen facilities (%)
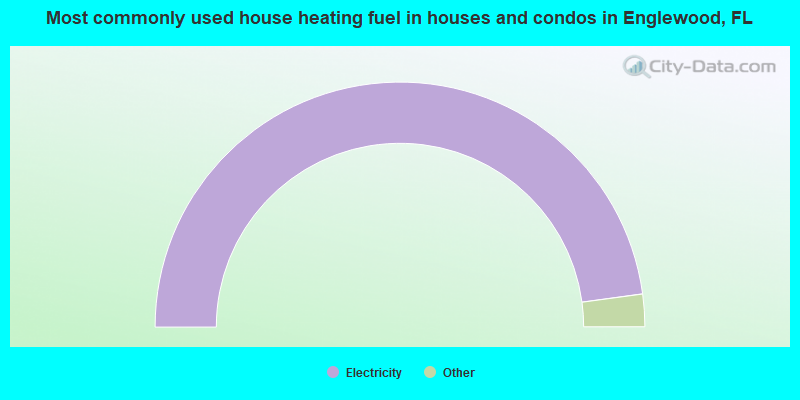
House heating fuel used in houses and condos - Utility gas (%)
House heating fuel used in houses and condos - Bottled, tank, or LP gas (%)
House heating fuel used in houses and condos - Electricity (%)
House heating fuel used in houses and condos - Fuel oil, kerosene, etc. (%)
House heating fuel used in houses and condos - Coal or coke (%)
House heating fuel used in houses and condos - Wood (%)
House heating fuel used in houses and condos - Solar energy (%)
House heating fuel used in houses and condos - Other fuel (%)
House heating fuel used in houses and condos - No fuel used (%)
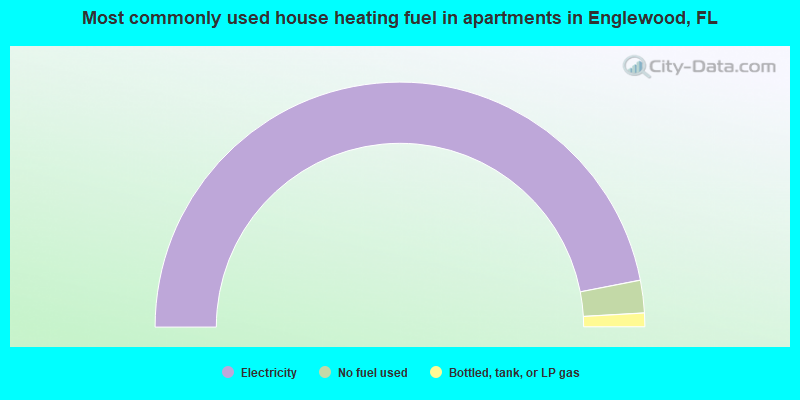
House heating fuel used in apartments - Utility gas (%)
House heating fuel used in apartments - Bottled, tank, or LP gas (%)
House heating fuel used in apartments - Electricity (%)
House heating fuel used in apartments - Fuel oil, kerosene, etc. (%)
House heating fuel used in apartments - Coal or coke (%)
House heating fuel used in apartments - Wood (%)
House heating fuel used in apartments - Solar energy (%)
House heating fuel used in apartments - Other fuel (%)
House heating fuel used in apartments - No fuel used (%)
Latest news about housing in Englewood, FL collected exclusively by city-data.com from local newspapers, TV, and radio stations
Median year house/condo built: 1985Median year apartment built: 1979Household type by relationship:
Households: 20,387
Male householders: 5,617 (1,535 living alone ), Female householders: 5,042 (2,271 living alone )5,267 spouses (5,222 opposite-sex spouses ), 624 unmarried partners , (608 opposite-sex unmarried partners ), 2,368 children (2,269 natural , 23 adopted , 75 stepchildren ), 160 grandchildren , 90 brothers or sisters , 229 parents , 0 foster children , 270 other relatives , 507 non-relatives In group quarters: 208
Size of family households: 5,187 2-persons , 548 3-persons , 402 4-persons , 90 5-persons , 28 6-persons , 57 7-or-more-persons .
Size of nonfamily households: 3,843 1-person , 617 2-persons , 88 3-persons .
654 married couples with children. single-parent households (316 men , 153 women ).
92.0% of residents of Englewood speak English at home. of residents speak Spanish at home (67% speak English very well , 26% speak English well , 6% speak English not well , 1% don't speak English at all ).of residents speak other Indo-European language at home (80% speak English very well , 15% speak English well , 5% speak English not well ).of residents speak Asian or Pacific Island language at home (53% speak English very well , 26% speak English well , 20% speak English not well ).of residents speak other language at home (33% speak English very well , 67% speak English not well ).
Foreign born population: 1,731 (8.5%)of them are naturalized citizens )
Median number of rooms in houses and condos:
Median number of rooms in apartments
Englewood, FL household income distribution 466 Less than $10,000730 $10,000 to $19,9991,157 $20,000 to $29,9991,104 $30,000 to $39,999943 $40,000 to $49,999948 $50,000 to $59,9991,290 $60,000 to $74,9991,364 $75,000 to $99,999913 $100,000 to $124,999599 $125,000 to $149,999503 $150,000 to $199,999780 $200,000 or more
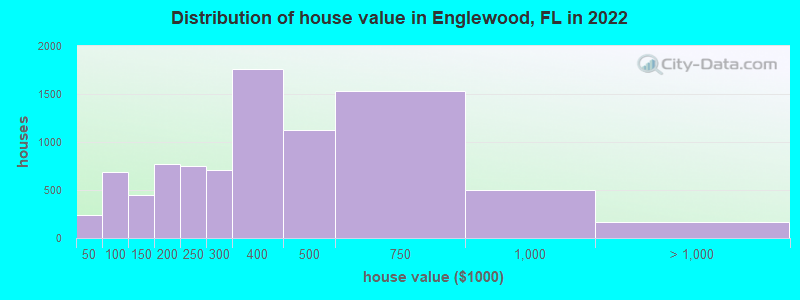
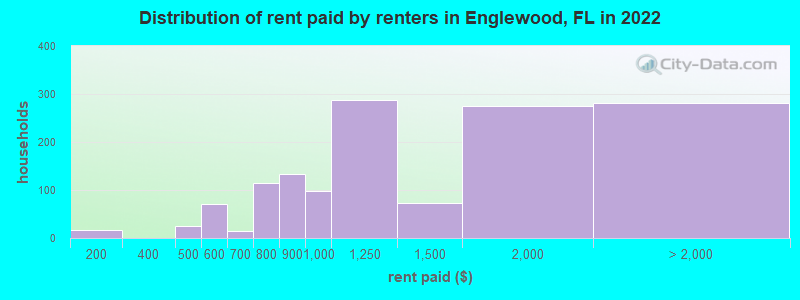
Home value of owner - occupied houses in 2022 in Englewood, FL 92 Less than $10,0007 $10,000 to $14,99929 $15,000 to $19,9996 $20,000 to $24,99952 $25,000 to $29,99914 $30,000 to $34,99914 $35,000 to $39,99926 $40,000 to $49,99987 $50,000 to $59,999134 $60,000 to $69,99964 $70,000 to $79,999157 $80,000 to $89,999220 $90,000 to $99,999281 $100,000 to $124,999171 $125,000 to $149,999545 $150,000 to $174,999223 $175,000 to $199,999748 $200,000 to $249,999704 $250,000 to $299,9991,756 $300,000 to $399,9991,129 $400,000 to $499,9991,532 $500,000 to $749,999504 $750,000 to $999,999124 $1,000,000 to $1,499,99921 $1,500,000 to $1,999,99918 $2,000,000 or moreRent paid by renters in 2022 in Englewood, FL 16 $150 to $19925 $400 to $44928 $500 to $54942 $550 to $59914 $600 to $64929 $700 to $74985 $750 to $799134 $800 to $89996 $900 to $999287 $1,000 to $1,24971 $1,250 to $1,499276 $1,500 to $1,99948 $2,000 to $2,49932 $3,000 to $3,499199 No cash rent
Percentage of workers working in this county: 70.9%Number of people working at home: 1,155 (20.6% of all workers )
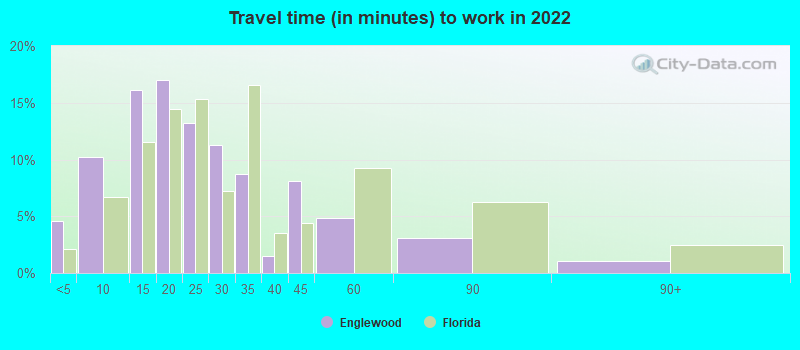
Travel time to work (commute)
Less than 5 minutes: 1975 to 9 minutes: 54510 to 14 minutes: 78815 to 19 minutes: 61420 to 24 minutes: 41125 to 29 minutes: 19930 to 34 minutes: 63235 to 39 minutes: 16740 to 44 minutes: 20545 to 59 minutes: 55360 to 89 minutes: 19990 or more minutes: 120
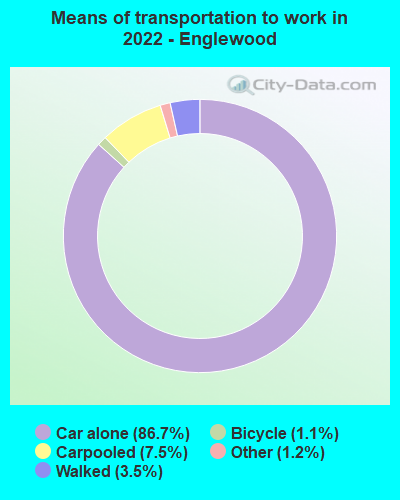
Means of transportation to work:
Drove a car alone: 4,391 (69.5%)Carpooled: 443 (7.0%)Taxi: 98 (1.6%)Bicycle: 55 (0.9%)Walked: 316 (5.0%)Worked at home: 1,155 (18.3%)
Unemployment by race in 2022
Unemployment rate for White non-Hispanic residents 3.8% Males2.7% FemalesUnemployment rate for two or more race residents 9.9% Females
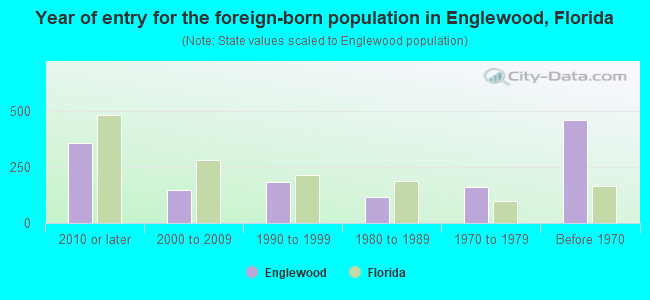
Year of entry for the foreign-born population in Englewood, Florida
360 2010 or later 148 2000 to 2009 182 1990 to 1999 118 1980 to 1989 162 1970 to 1979 463 Before 1970
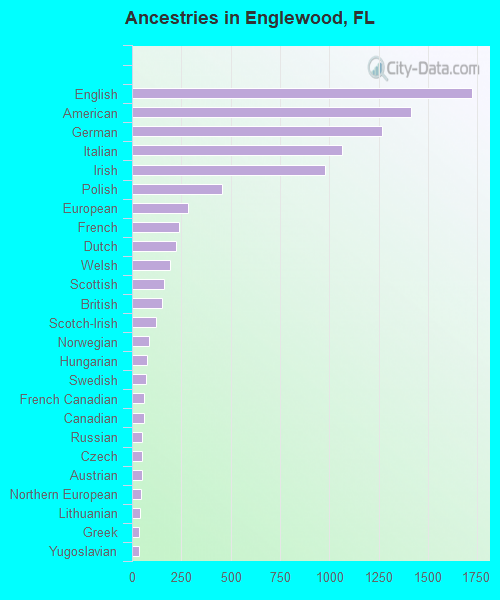
First ancestries reported:
English: 1,723 (16.5%)
American: 1,413 (13.6%)
German: 1,266 (12.2%)
Italian: 1,064 (10.2%)
Irish: 976 (9.4%)
Polish: 457 (4.4%)
European: 286 (2.7%)
French: 237 (2.3%)
Dutch: 224 (2.2%)
Welsh: 192 (1.8%)
Scottish: 160 (1.5%)
British: 151 (1.5%)
Scotch-Irish: 121 (1.2%)
Norwegian: 87 (0.8%)
Hungarian: 74 (0.7%)
Swedish: 69 (0.7%)
French Canadian: 62 (0.6%)
Canadian: 59 (0.6%)
Russian: 50 (0.5%)
Czech: 50 (0.5%)
Austrian: 49 (0.5%)
Northern European: 47 (0.5%)
Lithuanian: 41 (0.4%)
Greek: 38 (0.4%)
Yugoslavian: 38 (0.4%)
Celtic: 32 (0.3%)
Czechoslovakian: 32 (0.3%)
Finnish: 27 (0.3%)
Bulgarian: 25 (0.2%)
Macedonian: 22 (0.2%)
Danish: 21 (0.2%)
Slovak: 20 (0.2%)
Eastern European: 19 (0.2%)
Brazilian: 15 (0.1%)
Armenian: 15 (0.1%)
Syrian: 14 (0.1%)
New Zealander: 13 (0.1%)
Pennsylvania German: 13 (0.1%)
Belgian: 13 (0.1%)
Scandinavian: 12 (0.1%)
Assyrian: 11 (0.1%)
Ukrainian: 11 (0.1%)
Estonian: 10 (0.10%)
Serbian: 10 (0.10%)
Romanian: 8 (0.08%)
Swiss: 8 (0.08%)
Slovene: 8 (0.08%)
Haitian: 7 (0.07%)
Iranian: 6 (0.06%)
Most common places of birth for foreign-born residents (%): Philippines Englewood:
14.9% (227)Florida:
1.8% (84,403)
Canada Englewood:
13.8% (210)Florida:
2.4% (109,132)
China, excluding Hong Kong and Taiwan Englewood:
11.1% (170)Florida:
1.2% (56,071)
United Kingdom, excluding England and Scotland Englewood:
6.9% (106)Florida:
0.7% (34,227)
Germany Englewood:
6.2% (94)Florida:
1.2% (54,272)
England Englewood:
5.4% (83)Florida:
0.8% (37,723)
Italy Englewood:
5.0% (77)Florida:
0.7% (30,755)
Other Eastern Europe Englewood:
4.6% (71)Florida:
0.2% (9,990)
Bulgaria Englewood:
3.7% (56)Florida:
0.2% (6,883)
Austria Englewood:
2.9% (45)Florida:
0.1% (3,914)
Netherlands Englewood:
2.2% (34)Florida:
0.2% (8,103)
Ukraine Englewood:
2.0% (31)Florida:
0.5% (21,886)
Japan Englewood:
1.8% (28)Florida:
0.2% (10,425)
Sweden Englewood:
1.5% (23)Florida:
0.1% (4,700)
Malaysia Englewood:
1.5% (23)Florida:
0.1% (2,635)
Poland Englewood:
1.5% (23)Florida:
0.6% (25,219)
Place of birth for U.S.-born residents:
This state: 2,739Other state: 15,510Northeast: 6,976Midwest: 5,801South: 2,136West: 578 87.6% of Englewood residents lived in the same house 1 years ago.
Out of people who lived in different houses, 23.1% lived in this county.
Out of people who lived in different counties, 25.5% lived in Florida.
Englewood:
87.6%State average:
86.3%
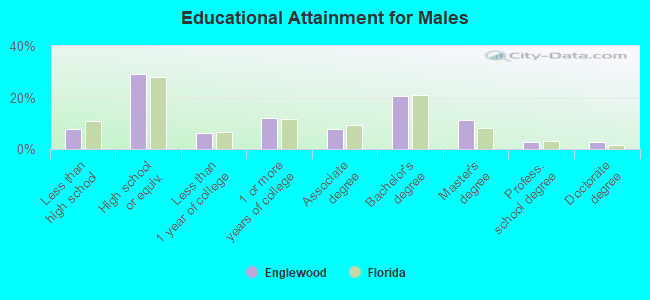
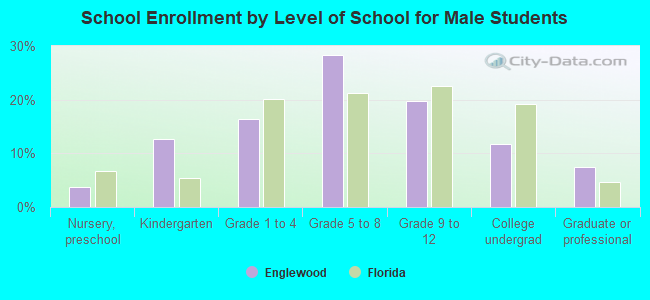
Education attainment for males 25 years and older:
No schooling: 31Nursery to 4th grade: 455th and 6th grade: 797th and 8th grade: 1699th grade: 6910th grade: 5911th grade: 15612th grade, no diploma: 72High school graduate (or equivalency): 2,608Less than 1 year of college: 556Some college more than 1 year, no degree: 1,091Associate degree: 682Bachelor's degree: 1,854Master's degree: 995Professional school degree: 242Doctorate degree: 247
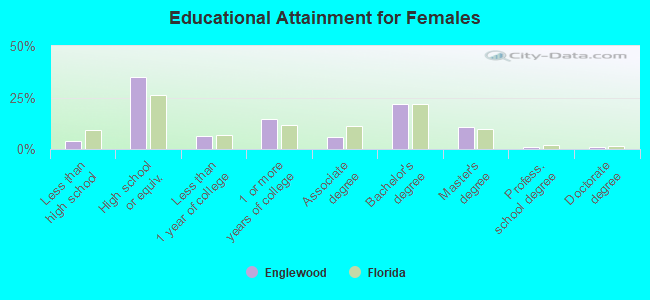
Education attainment for females 25 years and older:
No schooling: 7Nursery to 4th grade: 05th and 6th grade: 407th and 8th grade: 59th grade: 510th grade: 3211th grade: 7212th grade, no diploma: 186High school graduate (or equivalency): 3,327Less than 1 year of college: 584Some college more than 1 year, no degree: 1,390Associate degree: 551Bachelor's degree: 2,075Master's degree: 1,018Professional school degree: 110Doctorate degree: 114
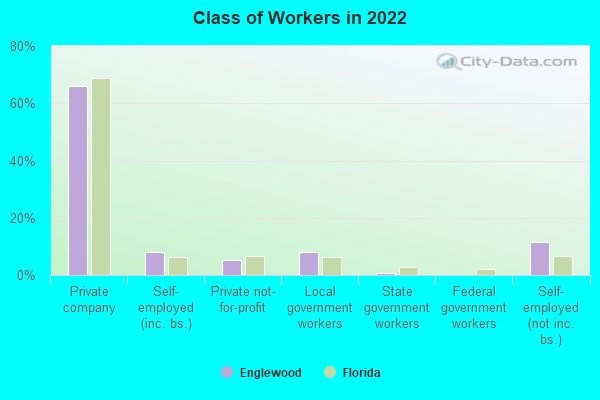
Housing units in structures:
One, detached: 8,628One, attached: 1,271Two: 5243 or 4: 2525 to 9: 23910 to 19: 22920 to 49: 16350 or more: 89Mobile homes: 3,489Boats, RVs, vans, etc.: 28Median worth of mobile homes: $171,499
Housing units lacking complete plumbing facilities in 2022: 0.4%Housing units lacking complete kitchen facilities in 2022: 1.1%House/condo owner moved in on average 7 years ago
Renter moved in on average 5 years ago
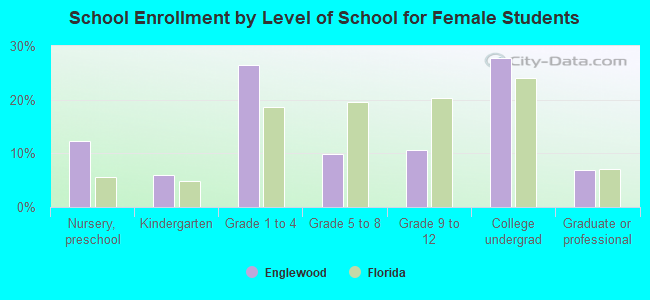
Private vs. public school enrollment:
Students in private schools in grades 1 to 8 (elementary and middle school): 64 Students in private schools in grades 9 to 12 (high school): 0 Students in private undergraduate colleges: 21