Englewood, NJ (New Jersey) Houses and Residents
Estimated median house or condo value in 2022: $467,002 (it was $198,200 in 2000 )
Englewood:
$467,002New Jersey:
$428,900
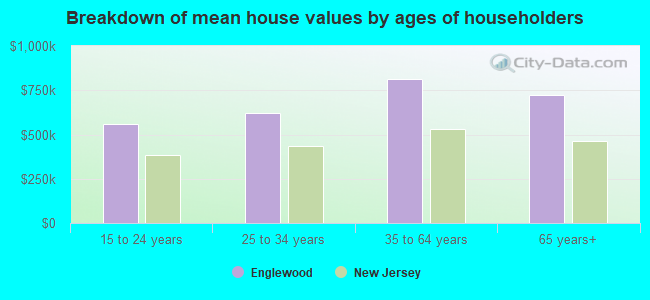
Lower value quartile - upper value quartile: $341,473 - $784,541Mean price in 2022: Detached houses: $768,816 Here:
$768,816State:
$537,591
Townhouses or other attached units: $623,127 Here:
$623,127State:
$381,113
In 2-unit structures: $495,027 Here:
$495,027State:
$444,476
In 3-to-4-unit structures: $446,283 Here:
$446,283State:
$457,463
In 5-or-more-unit structures: $380,353 Here:
$380,353State:
$368,745
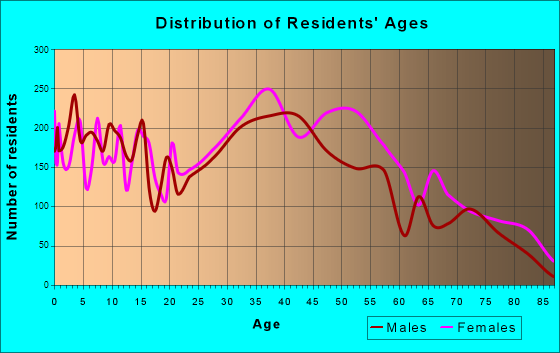
Total population: 27,670 (Urban population: 26,203, Rural population: 0)
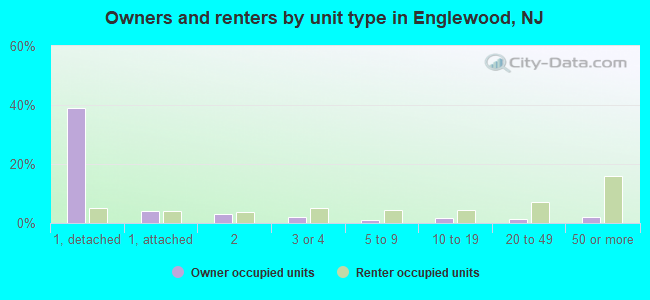
Houses: 12,354 (11,388 occupied: 6,250 owner occupied, 5,198 renter occupied )
% of renters here:
45%State:
35%
Housing density: 2,509 houses/condos per square mile
Median price asked for vacant for-sale houses and condos in 2022: $558,938.
Median contract rent in 2022: $1,525 (lower quartile is $1,022, upper quartile is over $2,000)
Median rent asked for vacant for-rent units in 2022: $2,325
Median gross rent in Englewood, NJ in 2022: $1,700
Housing units in Englewood with a mortgage: 4,458 (282 second mortgage, 0 home equity loan, 234 both second mortgage and home equity loan )Houses without a mortgage: 181
Median household income for houses/condos with a mortgage: $164,198
Median household income for apartments without a mortgage: $110,752
Median monthly housing costs: $2,085
Data:
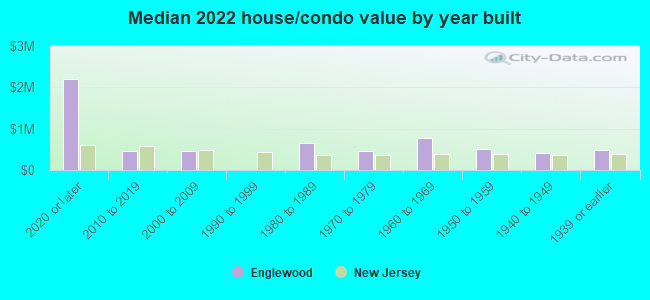
Median house or condo value ($)
Median house or condo value ($ change since 2000)
Median house or condo value ($) - White
Median house or condo value ($) - Black or African American
Median house or condo value ($) - Asian
Median house or condo value ($) - Hispanic or Latino
Median house or condo value ($) - American Indian and Alaska Native
Median house or condo value ($) - Multirace
Median house or condo value ($) - Other Race
Median price asked for mobile homes ($)
Household density (households per square mile)
Mean house or condo value by units in structure - 1, detached ($)
Mean house or condo value by units in structure - 1, attached ($)
Mean house or condo value by units in structure - 2 ($)
Mean house or condo value by units in structure by units in structure - 3 or 4 ($)
Mean house or condo value by units in structure - 5 or more ($)
Mean house or condo value by units in structure - Boat, RV, van, etc. ($)
Mean house or condo value by units in structure - Mobile home ($)
Median contract rent ($)
Median contract rent - Lower quartile ($)
Median contract rent - Upper quartile ($)
Median gross rent ($)
Urban houses (%)
Rural houses (%)
Houses occupied (%)
Houses occupied (% change since 2000)
Houses owner occupied (%)
Houses owner occupied (% change since 2000)
Houses renter occupied (%)
Houses renter occupied (% change since 2000)
Vacant housing units - For rent (%)
Vacant housing units - For rent (% change since 2000)
Vacant housing units - For sale only (%)
Vacant housing units - For sale only (% change since 2000)
Vacant housing units - Rented or sold, not occupied (%)
Vacant housing units - Rented or sold, not occupied (% change since 2000)
Vacant housing units - For seasonal, recreational, or occasional use (%)
Vacant housing units - For seasonal, recreational, or occasional use (% change since 2000)
Vacant housing units - For migrant workers (%)
Vacant housing units - For migrant workers (% change since 2000)
Vacant housing units - Other vacant (%)
Vacant housing units - Other vacant (% change since 2000)
Median monthly housing costs ($)
Median household income for houses/condos with a mortgage ($)
Median household income for houses/condos without a mortgage ($)
Median household income ($)
Median household income ($) - White
Median household income ($) - Black or African American
Median household income ($) - Asian
Median household income ($) - Hispanic or Latino
Median household income ($) - American Indian and Alaska Native
Median household income ($) - Multirace
Median household income ($) - Other Race
Mortgage status - with mortgage (%)
Mortgage status - with second mortgage (%)
Mortgage status - with home equity loan (%)
Mortgage status - with both second mortgage and home equity loan (%)
Mortgage status - without a mortgage (%)
Median year house/condo built
Median year apartment built
Household type by relationship - Male householder living alone (%)
Household type by relationship - Male householder not living alone (%)
Household type by relationship - Female householder living alone (%)
Household type by relationship - Female householder not living alone (%)
Household type by relationship - Opposite-Sex spouse (%)
Household type by relationship - Same-Sex spouse (%)
Household type by relationship - Opposite-Sex unmarried partner (%)
Household type by relationship - Same-Sex unmarried partner (%)
Household type by relationship - In group quarters (%)
Size of family households - 2-person household (%)
Size of family households - 3-person household (%)
Size of family households - 4-person household (%)
Size of family households - 5-person household (%)
Size of family households - 6-person household (%)
Size of family households - 7-or-more-person household (%)
Size of nonfamily households - 1-person household (%)
Size of nonfamily households - 2-person household (%)
Size of nonfamily households - 3-person household (%)
Size of nonfamily households - 4-person household (%)
Size of nonfamily households - 5-person household (%)
Size of nonfamily households - 6-person household (%)
Size of nonfamily households - 7-or-moreperson household (%)
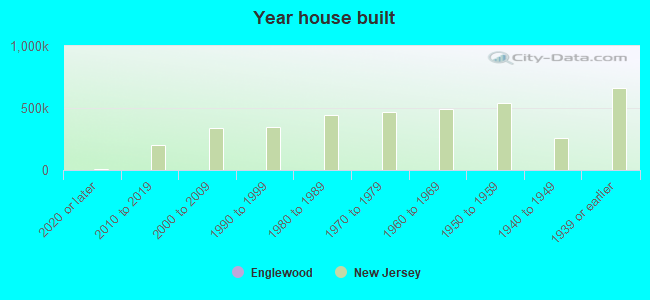
Year house built - Built 2010 or later (%)
Year house built - Built 2000 to 2009 (%)
Year house built - Built 1990 to 1999 (%)
Year house built - Built 1980 to 1989 (%)
Year house built - Built 1970 to 1979 (%)
Year house built - Built 1960 to 1969 (%)
Year house built - Built 1950 to 1959 (%)
Year house built - Built 1940 to 1949 (%)
Year house built - Built 1939 or earlier (%)
Median number of rooms in houses and condos
Median number of rooms in apartments
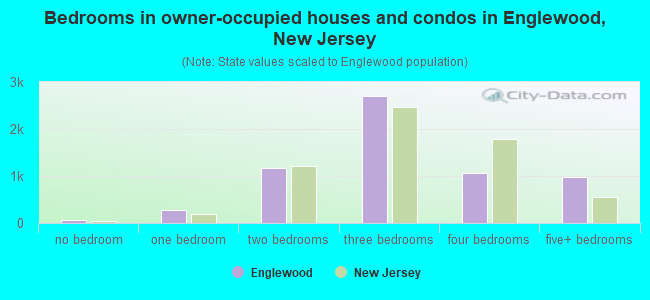
Median number of bedrooms in owner occupied houses
Mean number of bedrooms in owner occupied houses
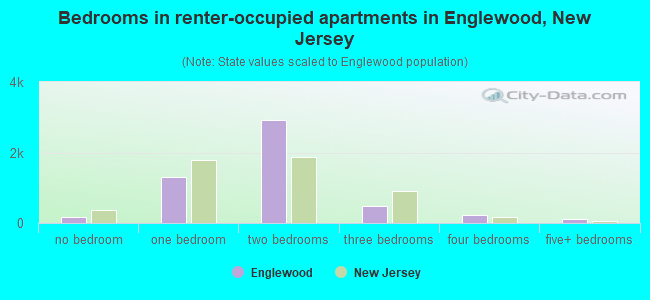
Median number of bedrooms in renter occupied houses
Mean number of bedrooms in renter occupied houses
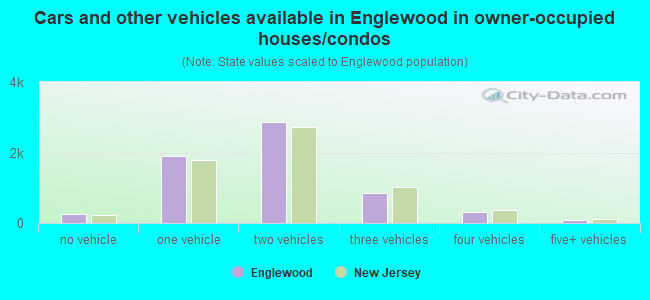
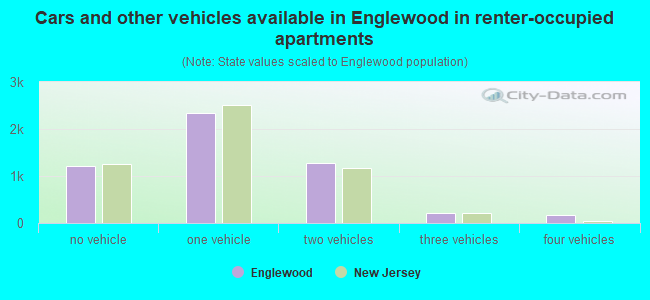
Median number of vehichles in owner occupied houses
Mean number of vehichles in owner occupied houses
Median number of vehichles in renter occupied houses
Mean number of vehichles in renter occupied houses
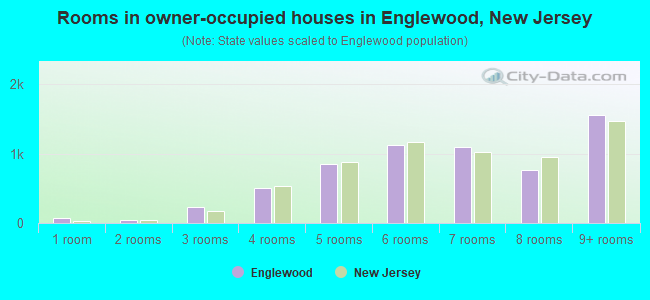
Rooms in owner-occupied houses - 1 room (%)
Rooms in owner-occupied houses - 2 rooms (%)
Rooms in owner-occupied houses - 3 rooms (%)
Rooms in owner-occupied houses - 4 rooms (%)
Rooms in owner-occupied houses - 5 rooms (%)
Rooms in owner-occupied houses - 6 rooms (%)
Rooms in owner-occupied houses - 7 rooms (%)
Rooms in owner-occupied houses - 8 rooms (%)
Rooms in owner-occupied houses - 9+ rooms (%)
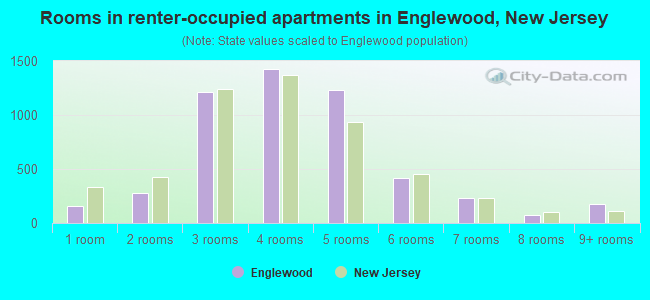
Rooms in renter-occupied houses - 1 room (%)
Rooms in renter-occupied houses - 2 rooms (%)
Rooms in renter-occupied houses - 3 rooms (%)
Rooms in renter-occupied houses - 4 rooms (%)
Rooms in renter-occupied houses - 5 rooms (%)
Rooms in renter-occupied houses - 6 rooms (%)
Rooms in renter-occupied houses - 7 rooms (%)
Rooms in renter-occupied houses - 8 rooms (%)
Rooms in renter-occupied houses - 9+ rooms (%)
Bedrooms in owner-occupied houses - no bedrooms (%)
Bedrooms in owner-occupied houses - 1 bedroom (%)
Bedrooms in owner-occupied houses - 2 bedrooms (%)
Bedrooms in owner-occupied houses - 3 bedrooms (%)
Bedrooms in owner-occupied houses - 4 bedrooms (%)
Bedrooms in owner-occupied houses - 5+ bedrooms (%)
Bedrooms in renter-occupied houses - no bedrooms (%)
Bedrooms in renter-occupied houses - 1 bedroom (%)
Bedrooms in renter-occupied houses - 2 bedrooms (%)
Bedrooms in renter-occupied houses - 3 bedrooms (%)
Bedrooms in renter-occupied houses - 4 bedrooms (%)
Bedrooms in renter-occupied houses - 5+ bedrooms (%)
Vehicles available in owner-occupied houses - no vehicle available (%)
Vehicles available in owner-occupied houses - 1 vehicle available(%)
Vehicles available in owner-occupied houses - 2 Vehicles available (%)
Vehicles available in owner-occupied houses - 3 Vehicles available (%)
Vehicles available in owner-occupied houses - 4 Vehicles available (%)
Vehicles available in owner-occupied houses - 5+ Vehicles available (%)
Vehicles available in renter-occupied houses - no vehicle available (%)
Vehicles available in renter-occupied houses - 1 vehicle available (%)
Vehicles available in renter-occupied houses - 2 Vehicles available (%)
Vehicles available in renter-occupied houses - 3 Vehicles available (%)
Vehicles available in renter-occupied houses - 4 Vehicles available (%)
Vehicles available in renter-occupied houses - 5+ Vehicles available (%)
Housing units in structures - 1, detached (%)
Housing units in structures - 1, attached (%)
Housing units in structures - 2 (%)
Housing units in structures - 3 or 4 (%)
Housing units in structures - 5 to 9 (%)
Housing units in structures - 10 to 19 (%)
Housing units in structures - 20 to 49 (%)
Housing units in structures - 50 or more (%)
Housing units in structures - Mobile home (%)
Housing units in structures - Boat, RV, van, etc. (%)
Housing units in structures - Owners - 1, detached (%)
Housing units in structures - Owners - 1, attached (%)
Housing units in structures - Owners - 2 (%)
Housing units in structures - Owners - 3 or 4 (%)
Housing units in structures - Owners - 5 to 9 (%)
Housing units in structures - Owners - 10 to 19 (%)
Housing units in structures - Owners - 20 to 49 (%)
Housing units in structures - Owners - 50 or more (%)
Housing units in structures - Owners - Mobile home (%)
Housing units in structures - Owners - Boat, RV, van, etc. (%)
Housing units in structures - Renters - 1, detached (%)
Housing units in structures - Renters - 1, attached (%)
Housing units in structures - Renters - 2 (%)
Housing units in structures - Renters - 3 or 4 (%)
Housing units in structures - Renters - 5 to 9 (%)
Housing units in structures - Renters - 10 to 19 (%)
Housing units in structures - Renters - 20 to 49 (%)
Housing units in structures - Renters - 50 or more (%)
Housing units in structures - Renters - Mobile home (%)
Housing units in structures - Renters - Boat, RV, van, etc. (%)
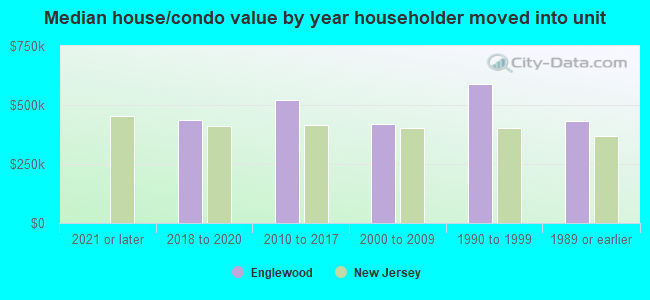
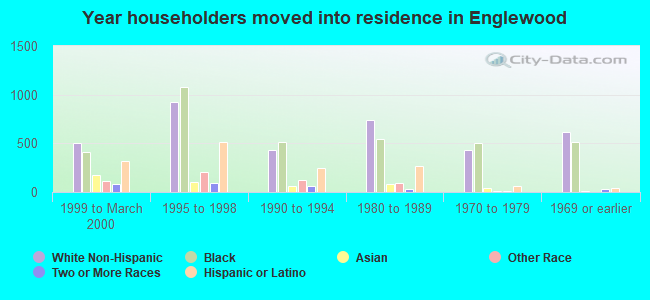
House/condo owner moved in on average (years ago)
Renter moved in on average (years ago)
Year householder moved into unit - Moved in 1999 to March 2000 (%)
Year householder moved into unit - Moved in 1999 to March 2000 (%) - White
Year householder moved into unit - Moved in 1999 to March 2000 (%) - Black or African American
Year householder moved into unit - Moved in 1999 to March 2000 (%) - Asian
Year householder moved into unit - Moved in 1999 to March 2000 (%) - Hispanic or Latino
Year householder moved into unit - Moved in 1999 to March 2000 (%) - American Indian and Alaska Native
Year householder moved into unit - Moved in 1999 to March 2000 (%) - Multirace
Year householder moved into unit - Moved in 1999 to March 2000 (%) - Other Race
Year householder moved into unit - Moved in 1995 to 1998 (%)
Year householder moved into unit - Moved in 1995 to 1998 (%) - White
Year householder moved into unit - Moved in 1995 to 1998 (%) - Black or African American
Year householder moved into unit - Moved in 1995 to 1998 (%) - Asian
Year householder moved into unit - Moved in 1995 to 1998 (%) - Hispanic or Latino
Year householder moved into unit - Moved in 1995 to 1998 (%) - American Indian and Alaska Native
Year householder moved into unit - Moved in 1995 to 1998 (%) - Multirace
Year householder moved into unit - Moved in 1995 to 1998 (%) - Other Race
Year householder moved into unit - Moved in 1990 to 1994 (%)
Year householder moved into unit - Moved in 1990 to 1994 (%) - White
Year householder moved into unit - Moved in 1990 to 1994 (%) - Black or African American
Year householder moved into unit - Moved in 1990 to 1994 (%) - Asian
Year householder moved into unit - Moved in 1990 to 1994 (%) - Hispanic or Latino
Year householder moved into unit - Moved in 1990 to 1994 (%) - American Indian and Alaska Native
Year householder moved into unit - Moved in 1990 to 1994 (%) - Multirace
Year householder moved into unit - Moved in 1990 to 1994 (%) - Other Race
Year householder moved into unit - Moved in 1980 to 1989 (%)
Year householder moved into unit - Moved in 1980 to 1989 (%) - White
Year householder moved into unit - Moved in 1980 to 1989 (%) - Black or African American
Year householder moved into unit - Moved in 1980 to 1989 (%) - Asian
Year householder moved into unit - Moved in 1980 to 1989 (%) - Hispanic or Latino
Year householder moved into unit - Moved in 1980 to 1989 (%) - American Indian and Alaska Native
Year householder moved into unit - Moved in 1980 to 1989 (%) - Multirace
Year householder moved into unit - Moved in 1980 to 1989 (%) - Other Race
Year householder moved into unit - Moved in 1970 to 1979 (%)
Year householder moved into unit - Moved in 1970 to 1979 (%) - White
Year householder moved into unit - Moved in 1970 to 1979 (%) - Black or African American
Year householder moved into unit - Moved in 1970 to 1979 (%) - Asian
Year householder moved into unit - Moved in 1970 to 1979 (%) - Hispanic or Latino
Year householder moved into unit - Moved in 1970 to 1979 (%) - American Indian and Alaska Native
Year householder moved into unit - Moved in 1970 to 1979 (%) - Multirace
Year householder moved into unit - Moved in 1970 to 1979 (%) - Other Race
Year householder moved into unit - Moved in 1969 or earlier (%)
Year householder moved into unit - Moved in 1969 or earlier (%) - White
Year householder moved into unit - Moved in 1969 or earlier (%) - Black or African American
Year householder moved into unit - Moved in 1969 or earlier (%) - Asian
Year householder moved into unit - Moved in 1969 or earlier (%) - Hispanic or Latino
Year householder moved into unit - Moved in 1969 or earlier (%) - American Indian and Alaska Native
Year householder moved into unit - Moved in 1969 or earlier (%) - Multirace
Year householder moved into unit - Moved in 1969 or earlier (%) - Other Race
Housing units lacking complete plumbing facilities (%)
Housing units lacking complete kitchen facilities (%)
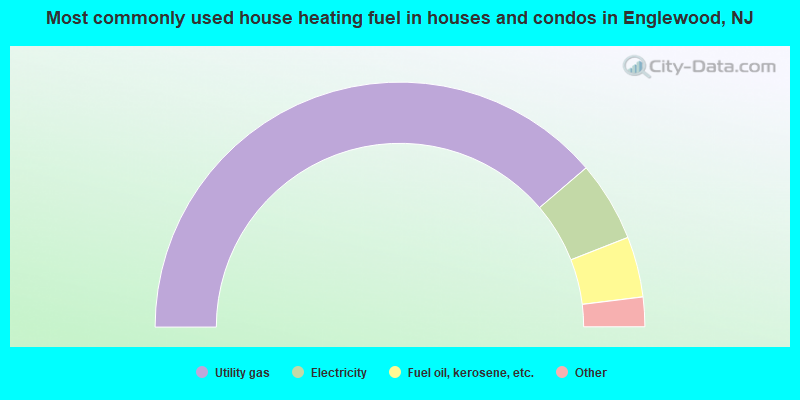
House heating fuel used in houses and condos - Utility gas (%)
House heating fuel used in houses and condos - Bottled, tank, or LP gas (%)
House heating fuel used in houses and condos - Electricity (%)
House heating fuel used in houses and condos - Fuel oil, kerosene, etc. (%)
House heating fuel used in houses and condos - Coal or coke (%)
House heating fuel used in houses and condos - Wood (%)
House heating fuel used in houses and condos - Solar energy (%)
House heating fuel used in houses and condos - Other fuel (%)
House heating fuel used in houses and condos - No fuel used (%)
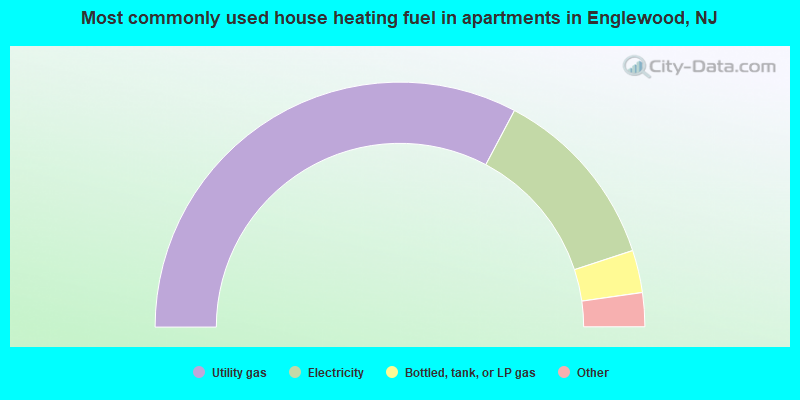
House heating fuel used in apartments - Utility gas (%)
House heating fuel used in apartments - Bottled, tank, or LP gas (%)
House heating fuel used in apartments - Electricity (%)
House heating fuel used in apartments - Fuel oil, kerosene, etc. (%)
House heating fuel used in apartments - Coal or coke (%)
House heating fuel used in apartments - Wood (%)
House heating fuel used in apartments - Solar energy (%)
House heating fuel used in apartments - Other fuel (%)
House heating fuel used in apartments - No fuel used (%)
Latest news about housing in Englewood, NJ collected exclusively by city-data.com from local newspapers, TV, and radio stations
Median year house/condo built: 1948Median year apartment built: 1980Household type by relationship:
Households: 29,101
Male householders: 5,278 (1,123 living alone ), Female householders: 6,035 (1,704 living alone )5,071 spouses (5,024 opposite-sex spouses ), 653 unmarried partners , (632 opposite-sex unmarried partners ), 8,598 children (7,995 natural , 244 adopted , 357 stepchildren ), 471 grandchildren , 631 brothers or sisters , 563 parents , 0 foster children , 665 other relatives , 917 non-relatives In group quarters: 211
Size of family households: 3,785 2-persons , 1,717 3-persons , 1,114 4-persons , 625 5-persons , 618 6-persons , 132 7-or-more-persons .
Size of nonfamily households: 2,923 1-person , 566 2-persons , 119 5-persons .
2,897 married couples with children. single-parent households (570 men , 1,646 women ).
56.8% of residents of Englewood speak English at home. of residents speak Spanish at home (46% speak English very well , 19% speak English well , 20% speak English not well , 14% don't speak English at all ).of residents speak other Indo-European language at home (75% speak English very well , 19% speak English well , 6% speak English not well ).of residents speak Asian or Pacific Island language at home (68% speak English very well , 21% speak English well , 11% speak English not well ).of residents speak other language at home (90% speak English very well , 10% speak English well ).
Foreign born population: 10,858 (37.3%)of them are naturalized citizens )
Median number of rooms in houses and condos:
Median number of rooms in apartments
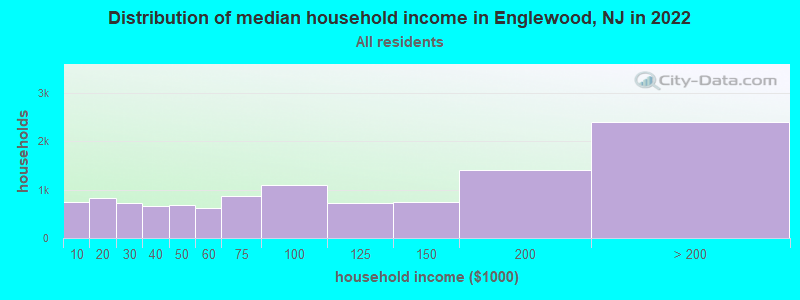
Englewood, NJ household income distribution 739 Less than $10,000828 $10,000 to $19,999728 $20,000 to $29,999668 $30,000 to $39,999686 $40,000 to $49,999611 $50,000 to $59,999879 $60,000 to $74,9991,087 $75,000 to $99,999718 $100,000 to $124,999752 $125,000 to $149,9991,410 $150,000 to $199,9992,400 $200,000 or more
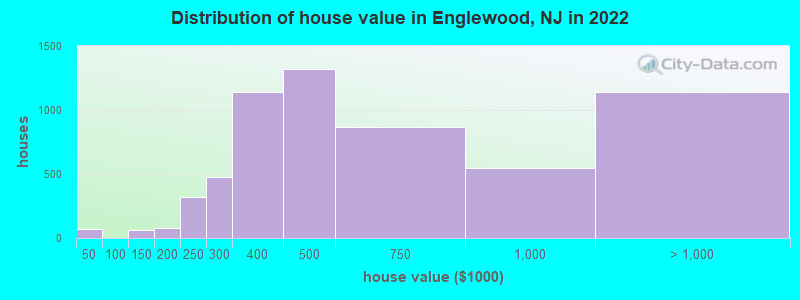
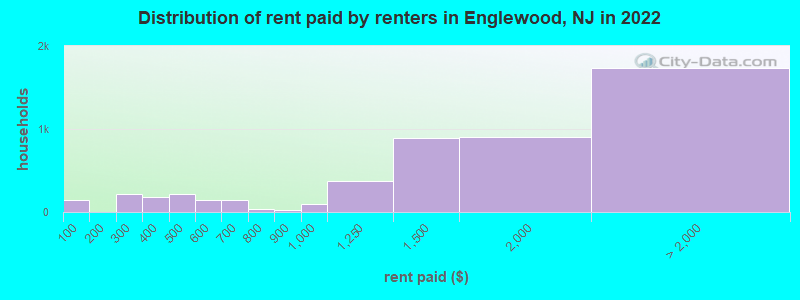
Home value of owner - occupied houses in 2022 in Englewood, NJ 41 Less than $10,00031 $35,000 to $39,9991 $50,000 to $59,99915 $100,000 to $124,99944 $125,000 to $149,9997 $150,000 to $174,99969 $175,000 to $199,999322 $200,000 to $249,999476 $250,000 to $299,9991,143 $300,000 to $399,9991,317 $400,000 to $499,999868 $500,000 to $749,999543 $750,000 to $999,999358 $1,000,000 to $1,499,999301 $1,500,000 to $1,999,999477 $2,000,000 or moreRent paid by renters in 2022 in Englewood, NJ 145 Less than $100167 $200 to $24951 $250 to $299183 $300 to $34912 $400 to $449203 $450 to $49960 $500 to $54989 $550 to $59981 $600 to $64957 $650 to $69938 $750 to $79920 $800 to $89995 $900 to $999372 $1,000 to $1,249889 $1,250 to $1,499903 $1,500 to $1,999603 $2,000 to $2,499577 $2,500 to $2,999154 $3,000 to $3,499328 $3,500 or more71 No cash rent
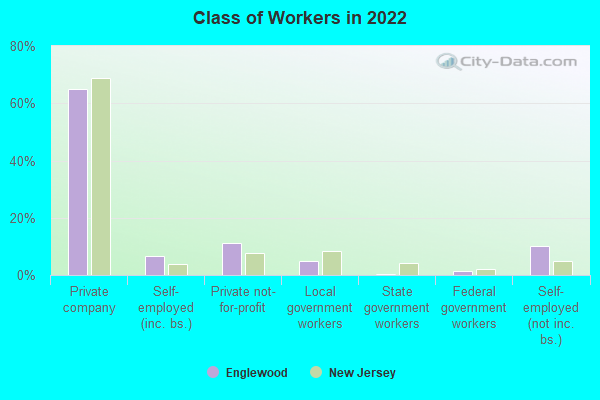
Percentage of workers working in this county: 71.5%Number of people working at home: 2,637 (17.3% of all workers )
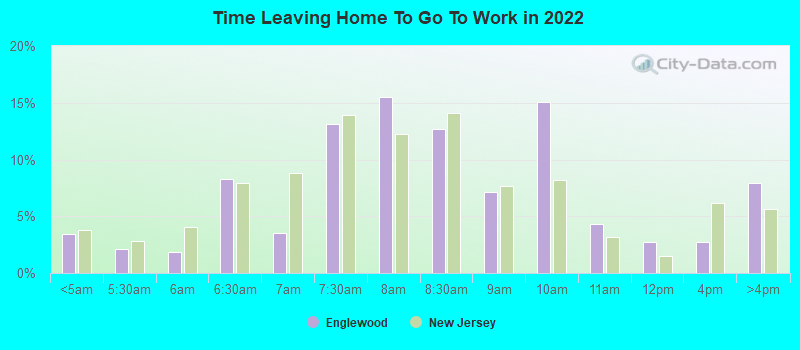
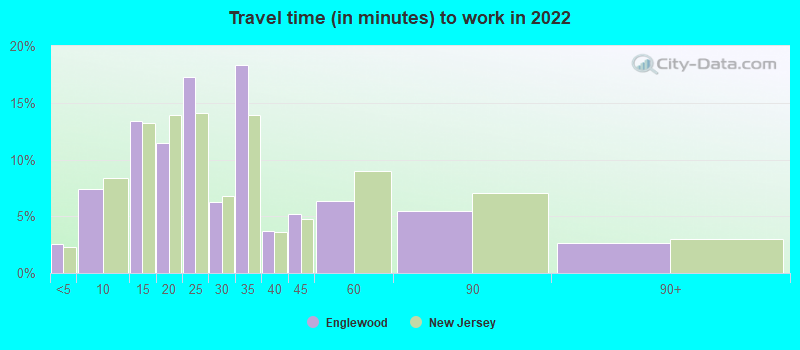
Travel time to work (commute)
Less than 5 minutes: 2575 to 9 minutes: 1,39810 to 14 minutes: 1,93215 to 19 minutes: 1,63620 to 24 minutes: 1,27025 to 29 minutes: 53330 to 34 minutes: 2,19135 to 39 minutes: 19540 to 44 minutes: 51245 to 59 minutes: 1,09460 to 89 minutes: 1,39290 or more minutes: 259
Means of transportation to work:
Drove a car alone: 11,113 (63.2%)Carpooled: 972 (5.5%)Bus : 1,018 (5.8%)Subway or elevated rail : 50 (0.3%)Long-distance train or commuter rail : 5 (0.0%)Light rail, streetcar or trolley : 44 (0.3%)Taxi: 324 (1.8%)Bicycle: 45 (0.3%)Walked: 1,051 (6.0%)Worked at home: 2,637 (15.0%)
Unemployment by race in 2022
Unemployment rate for White non-Hispanic residents 1.0% Males2.3% FemalesUnemployment rate for Black residents 12.7% Males7.7% FemalesUnemployment rate for Asian residents 4.3% Males4.1% FemalesUnemployment rate for other race residents 1.1% MalesUnemployment rate for two or more race residents 8.1% Males24.1% FemalesUnemployment rate for Hispanic or Latino residents 8.3% Males15.4% Females
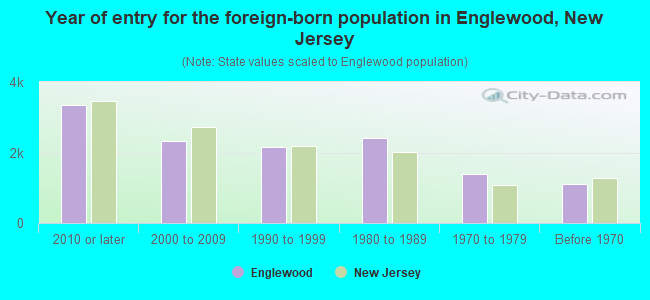
Year of entry for the foreign-born population in Englewood, New Jersey
3,335 2010 or later 2,320 2000 to 2009 2,163 1990 to 1999 2,420 1980 to 1989 1,400 1970 to 1979 1,116 Before 1970
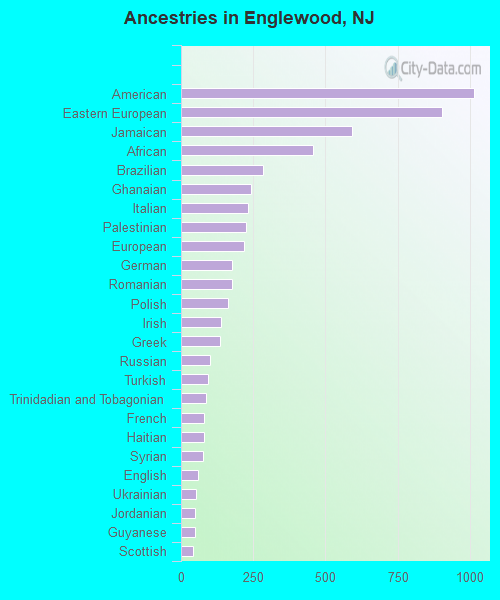
First ancestries reported:
American: 1,016 (5.5%)
Eastern European: 905 (4.9%)
Jamaican: 593 (3.2%)
African: 456 (2.5%)
Brazilian: 283 (1.5%)
Ghanaian: 243 (1.3%)
Italian: 231 (1.2%)
Palestinian: 226 (1.2%)
European: 219 (1.2%)
German: 178 (1.0%)
Romanian: 175 (0.9%)
Polish: 164 (0.9%)
Irish: 140 (0.8%)
Greek: 135 (0.7%)
Russian: 99 (0.5%)
Turkish: 93 (0.5%)
Trinidadian and Tobagonian: 85 (0.5%)
French: 80 (0.4%)
Haitian: 79 (0.4%)
Syrian: 76 (0.4%)
English: 59 (0.3%)
Ukrainian: 53 (0.3%)
Jordanian: 49 (0.3%)
Guyanese: 48 (0.3%)
Scottish: 43 (0.2%)
Iraqi: 41 (0.2%)
Egyptian: 37 (0.2%)
West Indian: 35 (0.2%)
Bulgarian: 31 (0.2%)
Israeli: 30 (0.2%)
Hungarian: 30 (0.2%)
Nigerian: 22 (0.1%)
Slavic: 19 (0.1%)
Czech: 18 (0.10%)
Iranian: 13 (0.07%)
Belgian: 12 (0.06%)
British West Indian: 9 (0.05%)
Austrian: 9 (0.05%)
Cape Verdean: 8 (0.04%)
French Canadian: 8 (0.04%)
Lebanese: 4 (0.02%) Most common places of birth for foreign-born residents (%): Colombia Englewood:
17.6% (1,916)New Jersey:
4.2% (90,817)
Dominican Republic Englewood:
13.5% (1,469)New Jersey:
9.7% (209,055)
Korea Englewood:
13.0% (1,408)New Jersey:
3.3% (70,512)
Jamaica Englewood:
5.6% (608)New Jersey:
2.2% (47,365)
Mexico Englewood:
5.6% (606)New Jersey:
4.8% (102,527)
Guyana Englewood:
4.3% (469)New Jersey:
1.2% (26,173)
Dominica Englewood:
4.0% (432)New Jersey:
0.2% (3,359)
Guatemala Englewood:
3.1% (332)New Jersey:
2.2% (46,813)
El Salvador Englewood:
2.8% (299)New Jersey:
2.3% (48,885)
China, excluding Hong Kong and Taiwan Englewood:
2.6% (284)New Jersey:
3.7% (78,969)
Philippines Englewood:
2.4% (265)New Jersey:
4.0% (85,934)
Brazil Englewood:
2.1% (231)New Jersey:
2.1% (46,020)
Ecuador Englewood:
1.8% (200)New Jersey:
4.4% (95,275)
Place of birth for U.S.-born residents:
This state: 7,617Other state: 10,459Northeast: 7,912Midwest: 359South: 1,900West: 270 89.2% of Englewood residents lived in the same house 1 years ago.
Out of people who lived in different houses, 37.5% lived in this county.
Out of people who lived in different counties, 47.5% lived in New Jersey.
Englewood:
89.2%State average:
90.4%
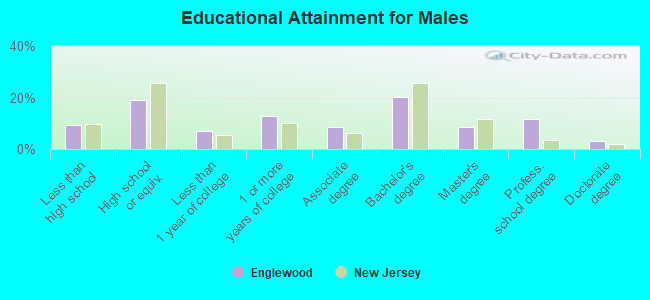
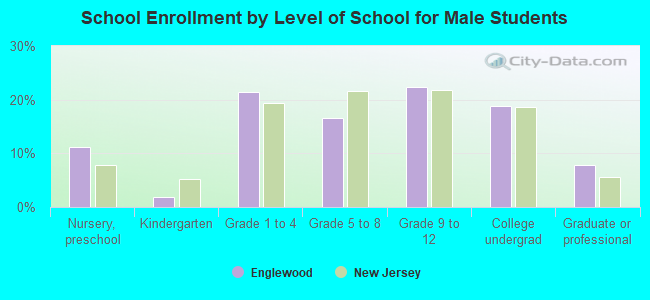
Education attainment for males 25 years and older:
No schooling: 262Nursery to 4th grade: 335th and 6th grade: 2537th and 8th grade: 1359th grade: 4310th grade: 6511th grade: 2712th grade, no diploma: 97High school graduate (or equivalency): 1,892Less than 1 year of college: 671Some college more than 1 year, no degree: 1,264Associate degree: 853Bachelor's degree: 1,976Master's degree: 842Professional school degree: 1,134Doctorate degree: 325
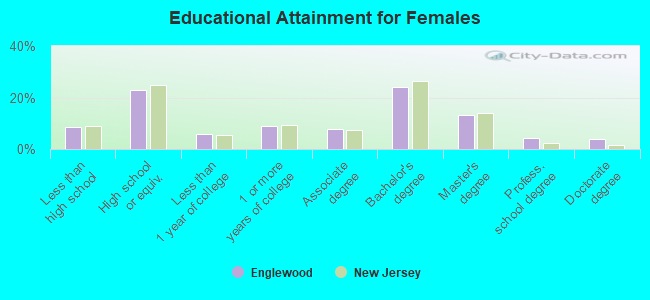
Education attainment for females 25 years and older:
No schooling: 196Nursery to 4th grade: 865th and 6th grade: 897th and 8th grade: 2649th grade: 510th grade: 20111th grade: 3112th grade, no diploma: 95High school graduate (or equivalency): 2,582Less than 1 year of college: 662Some college more than 1 year, no degree: 1,010Associate degree: 889Bachelor's degree: 2,685Master's degree: 1,489Professional school degree: 479Doctorate degree: 424
Housing units in structures:
One, detached: 5,182One, attached: 879Two: 1,0023 or 4: 5845 to 9: 1,02710 to 19: 67820 to 49: 79150 or more: 2,206Mobile homes: 1Housing units lacking complete plumbing facilities in 2022: 0.4%Housing units lacking complete kitchen facilities in 2022: 0.3%House/condo owner moved in on average 16 years ago
Renter moved in on average 3 years ago
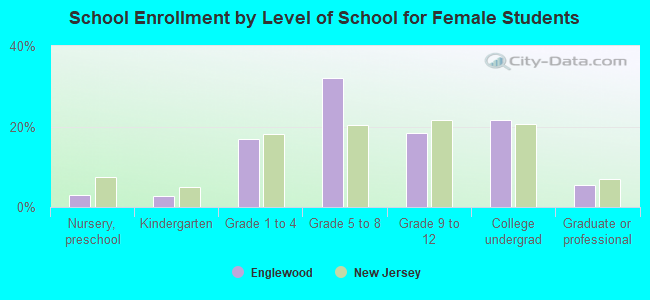
Private vs. public school enrollment:
Students in private schools in grades 1 to 8 (elementary and middle school): 1,145 Here:
36.0%New Jersey:
12.3%
Students in private schools in grades 9 to 12 (high school): 213 Here:
15.1%New Jersey:
13.1%
Students in private undergraduate colleges: 298 Here:
20.9%New Jersey:
33.2%