Englishtown, NJ (New Jersey) Houses and Residents
| Englishtown: | $465,394 |
| New Jersey: | $428,900 |
Mean price in 2022:
Detached houses: $494,888
Here: $494,888 State: $537,591 Townhouses or other attached units: $358,887
Here: $358,887 State: $381,113 In 5-or-more-unit structures: $417,937
Here: $417,937 State: $368,745
Total population: 1,962 (Urban population: 1,764, Rural population: 0)
Houses: 795 (728 occupied: 471 owner occupied, 270 renter occupied)
| % of renters here: | 36% |
| State: | 35% |
Housing density: 1,398 houses/condos per square mile
Median price asked for vacant for-sale houses and condos in 2022: $207,852.
Median contract rent in 2022: $1,463 (lower quartile is $1,011, upper quartile is $1,861)
Median rent asked for vacant for-rent units in 2022: $4,563
Median gross rent in Englishtown, NJ in 2022: $1,646
Housing units in Englishtown with a mortgage: 320 (32 second mortgage, 0 home equity loan, 32 both second mortgage and home equity loan)
Houses without a mortgage: 11
Median household income for houses/condos with a mortgage: $164,924
Median monthly housing costs: $1,886
Compare current foreclosures in Englishtown, NJ:
| Photo | Address | Area | Beds / Baths | Price | Details |
|---|---|---|---|---|---|

|
#1
Regency Way
Englishtown, NJ 07726
|
4,626 sq. feet
|
4 baths 5 beds |
show details | |

|
#2
Denise Ct
Englishtown, NJ 07726
|
3,070 sq. feet
|
3 baths 5 beds |
show details | |

|
#3
Bloomfield Rd
Englishtown, NJ 07726
|
3,053 sq. feet
|
3 baths 4 beds |
show details | |

|
#4
Kilmer Dr
Englishtown, NJ 07726
|
1,960 sq. feet
|
2 baths 4 beds |
show details | |

|
#5
Sandpiper Dr
Englishtown, NJ 07726
|
2,286 sq. feet
|
- baths - beds |
show details | |

|
#6
Station St
Englishtown, NJ 07726
|
1,400 sq. feet
|
- baths - beds |
show details | |

|
#7
Westbrook Way
Englishtown, NJ 07726
|
- sq. feet
|
- baths - beds |
show details | |

|
#8
Millhurst Rd
Englishtown, NJ 07726
|
2,439 sq. feet
|
- baths - beds |
show details | |

|
#9
Westbrook Way
Englishtown, NJ 07726
|
- sq. feet
|
- baths - beds |
show details | |

|
#10
Old Cider Mill Rd
Englishtown, NJ 07726
|
5,302 sq. feet
|
- baths - beds |
show details |
| Photo | Address | Area | Beds / Baths | Price | Details |
|---|---|---|---|---|---|

|
#11
Tarrytown Rd
Englishtown, NJ 07726
|
1,960 sq. feet
|
- baths - beds |
show details | |

|
#12
Meadow Green Cir Unit C
Englishtown, NJ 07726
|
- sq. feet
|
- baths - beds |
show details | |

|
#13
Smallwood Ln
Englishtown, NJ 07726
|
2,099 sq. feet
|
- baths - beds |
show details | |

|
#14
Shinnecock Dr
Englishtown, NJ 07726
|
1,592 sq. feet
|
- baths - beds |
show details | |

|
#15
Astor Dr
Englishtown, NJ 07726
|
2,804 sq. feet
|
- baths - beds |
show details | |

|
#16
Lasatta Ave Apt 611
Englishtown, NJ 07726
|
- sq. feet
|
- baths - beds |
show details | |

|
#17
Sunshine Ct
Englishtown, NJ 07726
|
1,082 sq. feet
|
- baths - beds |
show details | |

|
#18
Saint Andrews Pl
Englishtown, NJ 07726
|
1,592 sq. feet
|
- baths - beds |
show details | |

|
#19
Rowena Rd
Englishtown, NJ 07726
|
3,214 sq. feet
|
- baths - beds |
show details | |

|
#20
Taylors Mills Rd
Englishtown, NJ 07726
|
960 sq. feet
|
- baths - beds |
show details |
| Photo | Address | Area | Beds / Baths | Price | Details |
|---|---|---|---|---|---|

|
#21
Deer Way
Englishtown, NJ 07726
|
1,056 sq. feet
|
- baths - beds |
show details | |

|
#22
Willow Grove Way
Englishtown, NJ 07726
|
2,736 sq. feet
|
- baths - beds |
show details | |

|
#23
Shira Ln
Englishtown, NJ 07726
|
3,243 sq. feet
|
- baths - beds |
show details | |

|
#24
Sanford St
Englishtown, NJ 07726
|
1,785 sq. feet
|
- baths - beds |
show details | |

|
#25
Hamilton St
Englishtown, NJ 07726
|
2,296 sq. feet
|
- baths - beds |
show details | |

|
#26
Chestnut Way
Englishtown, NJ 07726
|
1,572 sq. feet
|
- baths - beds |
show details | |

|
#27
Cornwallis Ct
Englishtown, NJ 07726
|
4,732 sq. feet
|
- baths - beds |
show details | |

|
#28
Jared Ln
Englishtown, NJ 07726
|
2,990 sq. feet
|
- baths - beds |
show details | |

|
#29
Park Ave
Englishtown, NJ 07726
|
- sq. feet
|
- baths - beds |
show details | |

|
#30
Park Ave
Englishtown, NJ 07726
|
- sq. feet
|
- baths - beds |
show details |
| Photo | Address | Area | Beds / Baths | Price | Details |
|---|---|---|---|---|---|

|
#31
Varnum Ln
Englishtown, NJ 07726
|
1,848 sq. feet
|
- baths - beds |
show details | |

|
#32
Amberly Dr Unit F
Englishtown, NJ 07726
|
- sq. feet
|
- baths - beds |
show details | |

|
#33
Hummingbird Dr
Englishtown, NJ 07726
|
1,853 sq. feet
|
- baths - beds |
show details | |

|
#34
Taylor Lake Ct
Englishtown, NJ 07726
|
5,514 sq. feet
|
- baths - beds |
show details | |

|
#35
Wood Ave
Englishtown, NJ 07726
|
912 sq. feet
|
- baths - beds |
show details | |

|
#36
Heritage Dr
Englishtown, NJ 07726
|
2,356 sq. feet
|
- baths - beds |
show details | |

|
#37
Craig Rd
Englishtown, NJ 07726
|
- sq. feet
|
- baths - beds |
show details | |

|
#38
Amberly Dr Unit C
Englishtown, NJ 07726
|
- sq. feet
|
- baths - beds |
show details | |

|
#39
Taylors Mills Rd
Englishtown, NJ 07726
|
1,986 sq. feet
|
- baths - beds |
show details | |

|
#40
Century Way
Englishtown, NJ 07726
|
1,681 sq. feet
|
- baths - beds |
show details |
| Photo | Address | Area | Beds / Baths | Price | Details |
|---|---|---|---|---|---|

|
#41
Appomattox Dr
Englishtown, NJ 07726
|
2,413 sq. feet
|
- baths - beds |
show details | |

|
#42
Deer Way
Englishtown, NJ 07726
|
1,056 sq. feet
|
- baths - beds |
show details | |

|
#43
Lernard Rd
Englishtown, NJ 07726
|
2,938 sq. feet
|
- baths - beds |
show details | |

|
#44
Chestnut Way
Englishtown, NJ 07726
|
1,314 sq. feet
|
- baths - beds |
show details | |

|
#45
Valley Rd
Englishtown, NJ 07726
|
2,112 sq. feet
|
- baths - beds |
show details | |

|
#46
Brookview Ln
Englishtown, NJ 07726
|
1,456 sq. feet
|
- baths - beds |
show details | |

|
#47
Saint Andrews Pl
Englishtown, NJ 07726
|
1,592 sq. feet
|
- baths - beds |
show details | |

|
#48
Dancer Ln
Englishtown, NJ 07726
|
5,337 sq. feet
|
- baths - beds |
show details | |

|
#49
Cross Slope Ct Unit K
Englishtown, NJ 07726
|
- sq. feet
|
- baths - beds |
show details | |

|
Check over 1 million property listings on Foreclosure.com!
|
browse all offers | |||

Latest news about housing in Englishtown, NJ collected exclusively by city-data.com from local newspapers, TV, and radio stations

 | What's the catch? Home Searching in Williamstown, NJ (in Monroe, NJ, in Middlesex County) (13 replies) |
| Manalapan, NJ - Town Homes For Rent (7 replies) |
| Monmouth County Condos (Freehold/Aberdeen/Englishtown) (0 replies) |
| Is there a catch --Old Bridge homes? (34 replies) |
| First, Raceway Park... now, Atco Dragway (12 replies) |
| Looking to move to Iselin or Woodbridge (35 replies) |

Median year apartment built: 2004
Household type by relationship:
Households: 2,132- Male householders: 429 (100 living alone), Female householders: 296 (87 living alone)
379 spouses (379 opposite-sex spouses), 23 unmarried partners, (20 opposite-sex unmarried partners), 702 children (685 natural, 9 adopted, 8 stepchildren), 34 grandchildren, 6 brothers or sisters, 15 parents, 6 foster children, 23 other relatives, 147 non-relatives
- In group quarters: 70
Size of family households: 193 2-persons, 172 3-persons, 102 4-persons, 47 5-persons, 9 6-persons, 15 7-or-more-persons.
Size of nonfamily households: 186 1-person, 11 2-persons, 3 6-persons.
286 married couples with children.
76 single-parent households (6 men, 70 women).
62.2% of residents of Englishtown speak English at home.
13.7% of residents speak Spanish at home (83% speak English very well, 10% speak English well, 4% speak English not well, 3% don't speak English at all).
15.0% of residents speak other Indo-European language at home (62% speak English very well, 24% speak English well, 14% speak English not well).
6.1% of residents speak Asian or Pacific Island language at home (63% speak English very well, 25% speak English well, 11% speak English not well).
1.3% of residents speak other language at home (74% speak English very well, 26% speak English well).
Foreign born population: 521 (24.4%)
(80.0% of them are naturalized citizens)
| Here: | 6.5 |
| State: | 6.8 |
| Here: | 4.0 |
| State: | 3.9 |

- Bedrooms in owner-occupied houses and condos in Englishtown, New Jersey
- 6no bedroom
- 281 bedroom
- 1002 bedrooms
- 1173 bedrooms
- 2044 bedrooms
- 175+ bedrooms

- Bedrooms in renter-occupied apartments in Englishtown, New Jersey
- 47no bedroom
- 391 bedroom
- 1582 bedrooms
- 213 bedrooms
- 54 bedrooms
- 05+ bedrooms

- Cars and other vehicles available in Englishtown in owner-occupied houses/condos
- 0no vehicle
- 1101 vehicle
- 1902 vehicles
- 873 vehicles
- 614 vehicles
- 235+ vehicles

- Cars and other vehicles available in Englishtown in renter-occupied apartments
- 59no vehicle
- 1401 vehicle
- 602 vehicles
- 103 vehicles
- 04 vehicles
- 05+ vehicles

- Rooms in owner-occupied houses in Englishtown, New Jersey
- 61 room
- 122 rooms
- 83 rooms
- 244 rooms
- 595 rooms
- 1326 rooms
- 707 rooms
- 778 rooms
- 849+ rooms

- Rooms in renter-occupied apartments in Englishtown, New Jersey
- 471 room
- 72 rooms
- 653 rooms
- 344 rooms
- 535 rooms
- 586 rooms
- 57 rooms
- 08 rooms
- 09+ rooms


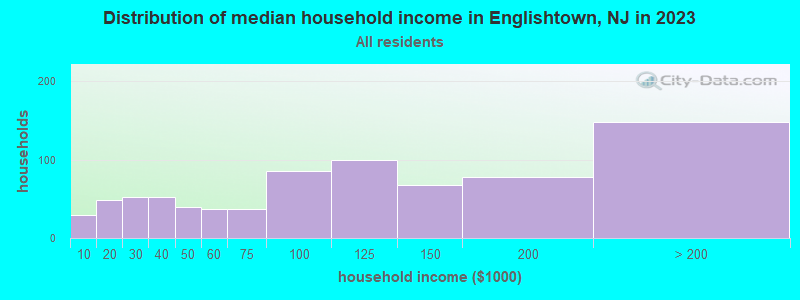
Englishtown, NJ household income distribution

- 34Less than $10,000
- 72$10,000 to $19,999
- 25$20,000 to $29,999
- 45$30,000 to $39,999
- 46$40,000 to $49,999
- 29$50,000 to $59,999
- 38$60,000 to $74,999
- 74$75,000 to $99,999
- 88$100,000 to $124,999
- 49$125,000 to $149,999
- 80$150,000 to $199,999
- 158$200,000 or more
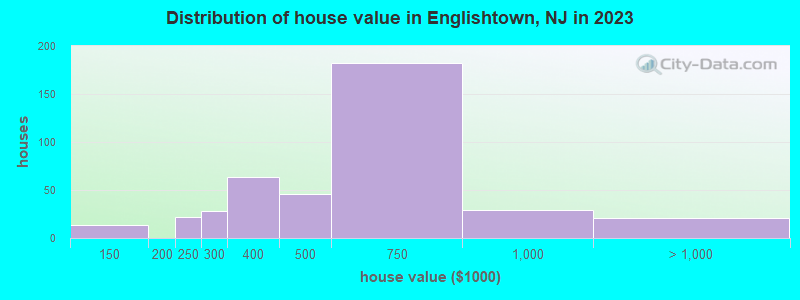
Home value of owner - occupied houses in 2022 in Englishtown, NJ
-
- 19$100,000 to $124,999
- 3$150,000 to $174,999
- 6$175,000 to $199,999
- 16$200,000 to $249,999
- 61$250,000 to $299,999
- 82$300,000 to $399,999
- 57$400,000 to $499,999
- 175$500,000 to $749,999
- 13$750,000 to $999,999
Rent paid by renters in 2022 in Englishtown, NJ
-
- 2Less than $100
- 43$600 to $649
- 35$700 to $749
- 2$800 to $899
- 4$900 to $999
- 15$1,000 to $1,249
- 53$1,250 to $1,499
- 81$1,500 to $1,999
- 34$2,000 to $2,499
- 5$3,000 to $3,499
- 3No cash rent


Percentage of workers working in this county: 66.5%
Number of people working at home: 151 (13.9% of all workers)
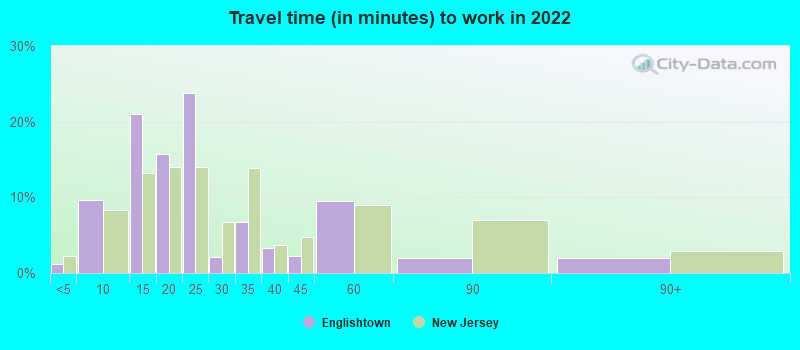
Travel time to work (commute)
- Less than 5 minutes: 27
- 5 to 9 minutes: 23
- 10 to 14 minutes: 114
- 15 to 19 minutes: 179
- 20 to 24 minutes: 53
- 25 to 29 minutes: 29
- 30 to 34 minutes: 140
- 35 to 39 minutes: 79
- 40 to 44 minutes: 50
- 45 to 59 minutes: 126
- 60 to 89 minutes: 26
- 90 or more minutes: 57
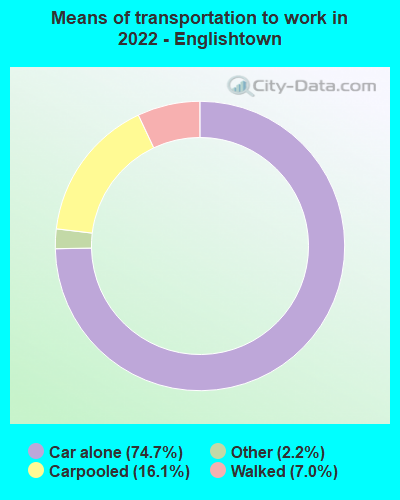
Means of transportation to work:
- Drove a car alone: 1,007 (62.2%)
- Carpooled: 259 (16.0%)
- Taxi: 45 (2.8%)
- Walked: 141 (8.7%)
- Worked at home: 151 (9.3%)

- Unemployment by race in 2022
- Unemployment rate for White non-Hispanic residents
- 8.0%Males
- 4.7%Females
- Unemployment rate for Asian residents
- 8.7%Males
- 3.7%Females

- Year of entry for the foreign-born population in Englishtown, New Jersey
- 842010 or later
- 1492000 to 2009
- 911990 to 1999
- 431980 to 1989
- 491970 to 1979
- 56Before 1970

First ancestries reported:
- Italian: 192 (15.7%)
- American: 84 (6.8%)
- Polish: 81 (6.6%)
- Irish: 49 (4.0%)
- Ukrainian: 33 (2.7%)
- Albanian: 27 (2.2%)
- Egyptian: 24 (2.0%)
- German: 21 (1.7%)
- European: 18 (1.5%)
- French: 14 (1.1%)
- Slovak: 11 (0.9%)
- Scotch-Irish: 8 (0.7%)
- English: 4 (0.3%)
- French Canadian: 3 (0.2%)
- Portuguese: 3 (0.2%)
Most common places of birth for foreign-born residents (%):
| Englishtown: | 17.1% (89) |
| New Jersey: | 4.8% (102,527) |
| Englishtown: | 9.8% (51) |
| New Jersey: | 2.3% (48,811) |
| Englishtown: | 9.0% (47) |
| New Jersey: | 1.1% (22,760) |
| Englishtown: | 7.9% (41) |
| New Jersey: | 4.0% (85,934) |
| Englishtown: | 6.2% (32) |
| New Jersey: | 12.8% (274,609) |
| Englishtown: | 5.8% (30) |
| New Jersey: | 1.5% (33,198) |
| Englishtown: | 5.4% (28) |
| New Jersey: | 1.6% (33,678) |
| Englishtown: | 3.8% (20) |
| New Jersey: | 0.8% (17,217) |
| Englishtown: | 3.7% (19) |
| New Jersey: | 9.7% (209,055) |
| Englishtown: | 2.7% (14) |
| New Jersey: | 0.5% (11,161) |
| Englishtown: | 2.7% (14) |
| New Jersey: | 1.7% (37,335) |
| Englishtown: | 2.5% (13) |
| New Jersey: | 4.4% (95,275) |
| Englishtown: | 2.3% (12) |
| New Jersey: | 0.2% (3,968) |
| Englishtown: | 2.1% (11) |
| New Jersey: | 3.3% (70,512) |
| Englishtown: | 2.1% (11) |
| New Jersey: | 0.8% (16,778) |
| Englishtown: | 1.9% (10) |
| New Jersey: | 0.9% (18,317) |
| Englishtown: | 1.7% (9) |
| New Jersey: | 0.2% (4,579) |
| Englishtown: | 1.5% (8) |
| New Jersey: | 0.1% (2,517) |
Place of birth for U.S.-born residents:
- This state: 1,080
- Other state: 484
- Northeast: 397
- Midwest: 9
- South: 69
- West: 4
98.3% of Englishtown residents lived in the same house 1 years ago.
Out of people who lived in different houses, 34.5% lived in this county.
Out of people who lived in different counties, 76.2% lived in New Jersey.
| Englishtown: | 98.3% |
| State average: | 90.4% |
Education attainment for males 25 years and older:
- No schooling: 23
- Nursery to 4th grade: 0
- 5th and 6th grade: 0
- 7th and 8th grade: 0
- 9th grade: 0
- 10th grade: 0
- 11th grade: 5
- 12th grade, no diploma: 4
- High school graduate (or equivalency): 170
- Less than 1 year of college: 87
- Some college more than 1 year, no degree: 49
- Associate degree: 28
- Bachelor's degree: 217
- Master's degree: 44
- Professional school degree: 0
- Doctorate degree: 7

Education attainment for females 25 years and older:
- No schooling: 15
- Nursery to 4th grade: 8
- 5th and 6th grade: 0
- 7th and 8th grade: 0
- 9th grade: 0
- 10th grade: 6
- 11th grade: 1
- 12th grade, no diploma: 13
- High school graduate (or equivalency): 274
- Less than 1 year of college: 30
- Some college more than 1 year, no degree: 70
- Associate degree: 123
- Bachelor's degree: 151
- Master's degree: 64
- Professional school degree: 18
- Doctorate degree: 0


Housing units in structures:
- One, detached: 446
- One, attached: 150
- Two: 39
- 3 or 4: 19
- 5 to 9: 41
- 10 to 19: 27
- 20 to 49: 14
- 50 or more: 49
- Mobile homes: 5
- Boats, RVs, vans, etc.: 3
Housing units lacking complete kitchen facilities in 2022: 5.7%
House/condo owner moved in on average 10 years ago
Renter moved in on average 5 years ago

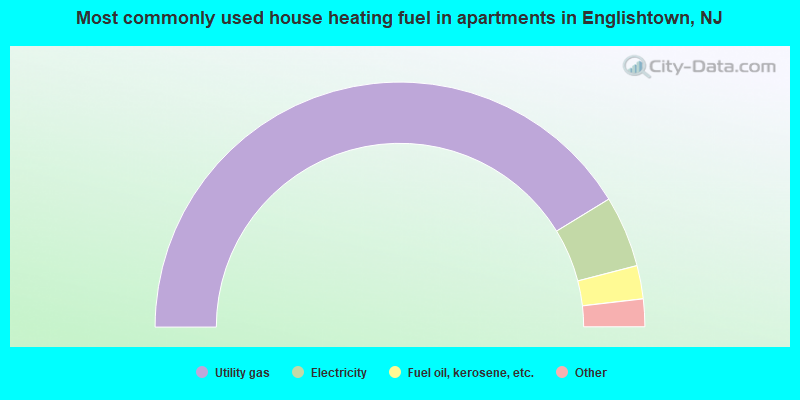
- 93.9%Utility gas
- 3.0%Electricity
- 1.5%Fuel oil, kerosene, etc.
- 1.5%Wood
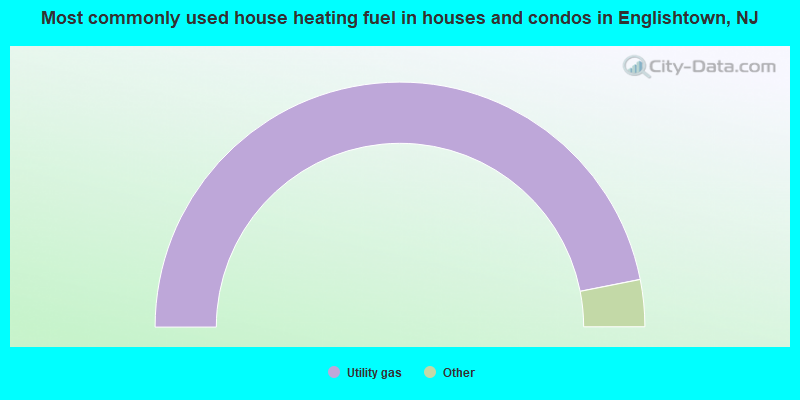
- 94.3%Utility gas
- 3.4%Fuel oil, kerosene, etc.
- 1.1%Electricity
- 1.1%No fuel used
Private vs. public school enrollment:
| Here: | 3.2% |
| New Jersey: | 12.3% |
| Here: | 2.9% |
| New Jersey: | 13.1% |
| Here: | 10.1% |
| New Jersey: | 33.2% |


