Escondido, CA (California) Houses and Residents
| Escondido: | $757,800 |
| California: | $715,900 |
Mean price in 2022:
Detached houses: $777,045
Here: $777,045 State: $988,808 Townhouses or other attached units: $566,933
Here: $566,933 State: $838,546 In 2-unit structures: $403,083
Here: $403,083 State: $1,138,100 In 3-to-4-unit structures: $432,668
Here: $432,668 State: $824,253 In 5-or-more-unit structures: $348,875
Here: $348,875 State: $730,996 Mobile homes: $199,411
Here: $199,411 State: $184,506
Total population: 150,243 (Urban population: 131,945, Rural population: 1,583 (191 farm, 1,392 nonfarm))
Houses: 52,468 (50,743 occupied: 25,776 owner occupied, 24,967 renter occupied)
| % of renters here: | 49% |
| State: | 44% |
Housing density: 1,446 houses/condos per square mile
Median price asked for vacant for-sale houses and condos in 2022: $1,000,382.
Median contract rent in 2022: $1,791 (lower quartile is $1,432, upper quartile is over $2,000)
Median rent asked for vacant for-rent units in 2022: $1,842
Median gross rent in Escondido, CA in 2022: $1,877
Housing units in Escondido with a mortgage: 19,084 (1,494 second mortgage, 0 home equity loan, 979 both second mortgage and home equity loan)
Houses without a mortgage: 227
Median household income for houses/condos with a mortgage: $134,441
Median household income for apartments without a mortgage: $81,495
Median monthly housing costs: $2,023
Compare current foreclosures in Escondido, CA:
| Photo | Address | Area | Beds / Baths | Price | Details |
|---|---|---|---|---|---|

|
#1
Paul St
Escondido, CA 92027
|
1,280 sq. feet
|
2 baths 3 beds |
show details | |

|
#2
Stanley Ct
Escondido, CA 92026
|
1,203 sq. feet
|
2 baths 3 beds |
show details | |

|
#3
Citracado Pkwy
Escondido, CA 92029
|
- sq. feet
|
2 baths 3 beds |
show details | |

|
#4
Lisbon Pl
Escondido, CA 92029
|
1,696 sq. feet
|
2 baths 3 beds |
show details | |

|
#5
Nancy St
Escondido, CA 92027
|
1,360 sq. feet
|
2 baths 3 beds |
show details | |

|
#6
Mockingbird Cir
Escondido, CA 92025
|
2,300 sq. feet
|
2 baths 3 beds |
show details | |

|
#7
Amparo Dr
Escondido, CA 92025
|
4,084 sq. feet
|
4 baths 5 beds |
show details | |

|
#8
Holly Ave
Escondido, CA 92026
|
1,651 sq. feet
|
2 baths 3 beds |
show details | |

|
#9
Megan Ter
Escondido, CA 92026
|
2,540 sq. feet
|
3 baths 4 beds |
show details | |

|
#10
W 11th Ave
Escondido, CA 92029
|
2,008 sq. feet
|
3 baths 3 beds |
show details |
| Photo | Address | Area | Beds / Baths | Price | Details |
|---|---|---|---|---|---|

|
#11
W 13th Ave
Escondido, CA 92025
|
1,305 sq. feet
|
1 baths 2 beds |
show details | |

|
#12
Citracado Pkwy Spc 44
Escondido, CA 92029
|
1,057 sq. feet
|
2 baths 3 beds |
show details | |

|
#13
S Upas St
Escondido, CA 92025
|
1,349 sq. feet
|
2 baths 4 beds |
show details | |

|
#14
W Country Club Ln
Escondido, CA 92026
|
2,012 sq. feet
|
2 baths 4 beds |
show details | |

|
#15
W 11th Ave
Escondido, CA 92029
|
2,428 sq. feet
|
3 baths 4 beds |
show details | |

|
#16
N Ash St
Escondido, CA 92027
|
969 sq. feet
|
1 baths 3 beds |
show details | |

|
#17
Mosaic Gln
Escondido, CA 92029
|
1,620 sq. feet
|
2 baths 3 beds |
show details | |

|
#18
W 2nd Ave Unit 1108
Escondido, CA 92025
|
1,864 sq. feet
|
2 baths 3 beds |
show details | |

|
#19
E 3rd Ave
Escondido, CA 92025
|
1,393 sq. feet
|
2 baths 3 beds |
show details | |

|
#20
N Cedar St
Escondido, CA 92025
|
1,753 sq. feet
|
3 baths 4 beds |
show details |
| Photo | Address | Area | Beds / Baths | Price | Details |
|---|---|---|---|---|---|

|
#21
Eldorado Dr
Escondido, CA 92025
|
2,034 sq. feet
|
2 baths 3 beds |
show details | |

|
#22
Mountain Meadow Rd
Escondido, CA 92026
|
2,142 sq. feet
|
2 baths 3 beds |
show details | |

|
#23
W 10th Ave
Escondido, CA 92025
|
1,080 sq. feet
|
2 baths 3 beds |
show details | |

|
#24
Country Pl
Escondido, CA 92026
|
1,689 sq. feet
|
2 baths 3 beds |
show details | |

|
#25
Lotus Gln
Escondido, CA 92026
|
1,440 sq. feet
|
2 baths 2 beds |
show details | |

|
#26
Citracado Pkwy Spc 244
Escondido, CA 92029
|
1,248 sq. feet
|
2 baths 2 beds |
show details | |

|
#27
Rosehill Rd
Escondido, CA 92025
|
3,036 sq. feet
|
2 baths 4 beds |
show details | |

|
#28
Lisbon Pl
Escondido, CA 92029
|
1,696 sq. feet
|
2 baths 3 beds |
show details | |

|
#29
Vistamonte Gln
Escondido, CA 92027
|
4,450 sq. feet
|
3 baths 5 beds |
show details | |

|
#30
Amber Ln
Escondido, CA 92026
|
1,774 sq. feet
|
2 baths 3 beds |
show details |
| Photo | Address | Area | Beds / Baths | Price | Details |
|---|---|---|---|---|---|

|
#31
Vistamonte Gln
Escondido, CA 92027
|
4,450 sq. feet
|
3 baths 5 beds |
show details | |

|
#32
Idaho Ave
Escondido, CA 92027
|
4,040 sq. feet
|
3 baths 3 beds |
show details | |

|
#33
Gale St
Escondido, CA 92027
|
1,422 sq. feet
|
2 baths 4 beds |
show details | |

|
#34
Holly Ave
Escondido, CA 92027
|
1,588 sq. feet
|
2 baths 3 beds |
show details | |

|
#35
N Ash St
Escondido, CA 92027
|
1,040 sq. feet
|
1 baths 3 beds |
show details | |

|
#36
Badger Gln
Escondido, CA 92029
|
1,489 sq. feet
|
2 baths 3 beds |
show details | |

|
#37
Citrus Hills Ln
Escondido, CA 92027
|
2,240 sq. feet
|
3 baths 4 beds |
show details | |

|
#38
Windyridge Gln
Escondido, CA 92026
|
1,635 sq. feet
|
2 baths 3 beds |
show details | |

|
#39
Marjorie Pl
Escondido, CA 92027
|
1,399 sq. feet
|
2 baths 4 beds |
show details | |

|
#40
Shadetree Ln
Escondido, CA 92029
|
2,324 sq. feet
|
3 baths 4 beds |
show details |
| Photo | Address | Area | Beds / Baths | Price | Details |
|---|---|---|---|---|---|

|
#41
Sundown Gln
Escondido, CA 92026
|
1,054 sq. feet
|
2 baths 2 beds |
show details | |

|
#42
Buckskin Gln
Escondido, CA 92027
|
1,602 sq. feet
|
3 baths 4 beds |
show details | |

|
#43
Mockingbird Cir
Escondido, CA 92025
|
1,950 sq. feet
|
2 baths 3 beds |
show details | |

|
#44
Fleetwood St
Escondido, CA 92029
|
1,366 sq. feet
|
2 baths 3 beds |
show details | |

|
#45
Goldenrod St
Escondido, CA 92027
|
1,600 sq. feet
|
1 baths 5 beds |
show details | |

|
#46
Erica St
Escondido, CA 92027
|
1,845 sq. feet
|
2 baths 4 beds |
show details | |

|
#47
Angeles Gln
Escondido, CA 92029
|
1,669 sq. feet
|
2 baths 4 beds |
show details | |

|
#48
N Escondido Blvd Apt 56
Escondido, CA 92026
|
835 sq. feet
|
1 baths 2 beds |
show details | |

|
#49
Valley View Gln
Escondido, CA 92026
|
2,660 sq. feet
|
3 baths 5 beds |
show details | |

|
Check over 1 million property listings on Foreclosure.com!
|
browse all offers | |||

Latest news about housing in Escondido, CA collected exclusively by city-data.com from local newspapers, TV, and radio stations

 | San Marcos - land + 2 homes (11 replies) |
| CA Cities(Pop 65,000+) by Median Household Income, 2019 (8 replies) |
| Looking for condo, townhome or apartment to rent (2 replies) |
| Driving from NorCal to Escondido - Recommended Route? (11 replies) |
| Starter home for young family (suggestions) (34 replies) |
| Cheap Apartments In North County? (3 replies) |

Median year apartment built: 1980
Household type by relationship:
Households: 150,258- Male householders: 26,348 (5,468 living alone), Female householders: 24,395 (4,918 living alone)
25,461 spouses (24,934 opposite-sex spouses), 4,539 unmarried partners, (4,430 opposite-sex unmarried partners), 45,564 children (43,656 natural, 54 adopted, 1,854 stepchildren), 2,822 grandchildren, 2,938 brothers or sisters, 5,181 parents, 0 foster children, 3,185 other relatives, 6,722 non-relatives
- In group quarters: 3,103
Size of family households: 12,736 2-persons, 9,329 3-persons, 7,532 4-persons, 4,687 5-persons, 1,203 6-persons, 916 7-or-more-persons.
Size of nonfamily households: 10,386 1-person, 3,242 2-persons, 335 3-persons, 195 6-persons, 182 7-or-more-persons.
19,267 married couples with children.
9,131 single-parent households (1,876 men, 7,255 women).
58.6% of residents of Escondido speak English at home.
34.3% of residents speak Spanish at home (55% speak English very well, 18% speak English well, 18% speak English not well, 10% don't speak English at all).
1.8% of residents speak other Indo-European language at home (68% speak English very well, 27% speak English well, 5% speak English not well).
4.3% of residents speak Asian or Pacific Island language at home (50% speak English very well, 31% speak English well, 15% speak English not well, 4% don't speak English at all).
0.4% of residents speak other language at home (68% speak English very well, 20% speak English well, 12% speak English not well).
Foreign born population: 43,491 (28.9%)
(43.8% of them are naturalized citizens)
| Here: | 6.0 |
| State: | 6.0 |
| Here: | 4.2 |
| State: | 3.9 |

- Bedrooms in owner-occupied houses and condos in Escondido, California
- 75no bedroom
- 4561 bedroom
- 4,0102 bedrooms
- 10,8023 bedrooms
- 8,6814 bedrooms
- 1,7525+ bedrooms

- Bedrooms in renter-occupied apartments in Escondido, California
- 1,983no bedroom
- 5,3671 bedroom
- 10,5232 bedrooms
- 5,4783 bedrooms
- 1,1164 bedrooms
- 5005+ bedrooms

- Cars and other vehicles available in Escondido in owner-occupied houses/condos
- 649no vehicle
- 4,9881 vehicle
- 10,5362 vehicles
- 6,1493 vehicles
- 2,2214 vehicles
- 1,2335+ vehicles

- Cars and other vehicles available in Escondido in renter-occupied apartments
- 1,551no vehicle
- 8,9431 vehicle
- 9,3042 vehicles
- 3,9753 vehicles
- 6654 vehicles
- 5295+ vehicles

- Rooms in owner-occupied houses in Escondido, California
- 751 room
- 1432 rooms
- 8423 rooms
- 3,3724 rooms
- 5,0955 rooms
- 6,5916 rooms
- 3,5667 rooms
- 3,3208 rooms
- 2,7729+ rooms

- Rooms in renter-occupied apartments in Escondido, California
- 1,8271 room
- 1,5392 rooms
- 4,4213 rooms
- 6,7904 rooms
- 7,3045 rooms
- 1,3846 rooms
- 6907 rooms
- 3438 rooms
- 6699+ rooms


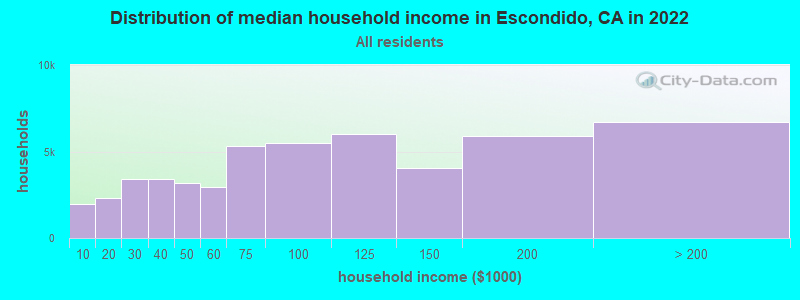
Escondido, CA household income distribution

- 1,961Less than $10,000
- 2,308$10,000 to $19,999
- 3,390$20,000 to $29,999
- 3,397$30,000 to $39,999
- 3,206$40,000 to $49,999
- 2,962$50,000 to $59,999
- 5,355$60,000 to $74,999
- 5,488$75,000 to $99,999
- 6,010$100,000 to $124,999
- 4,032$125,000 to $149,999
- 5,915$150,000 to $199,999
- 6,719$200,000 or more
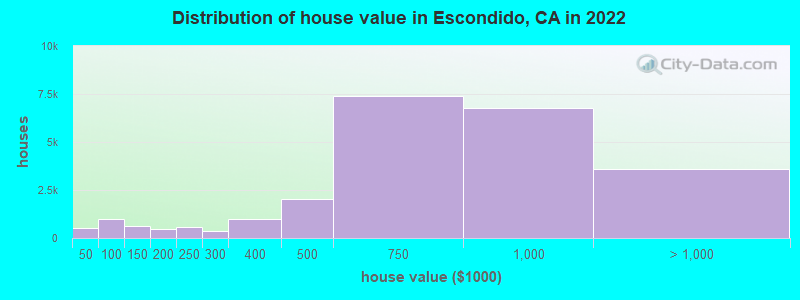
Home value of owner - occupied houses in 2022 in Escondido, CA
-
- 223Less than $10,000
- 46$10,000 to $14,999
- 34$15,000 to $19,999
- 19$20,000 to $24,999
- 143$25,000 to $29,999
- 76$40,000 to $49,999
- 354$50,000 to $59,999
- 119$60,000 to $69,999
- 217$70,000 to $79,999
- 147$80,000 to $89,999
- 61$90,000 to $99,999
- 395$100,000 to $124,999
- 211$125,000 to $149,999
- 224$150,000 to $174,999
- 225$175,000 to $199,999
- 548$200,000 to $249,999
- 355$250,000 to $299,999
- 995$300,000 to $399,999
- 2,055$400,000 to $499,999
- 7,403$500,000 to $749,999
- 6,778$750,000 to $999,999
- 2,980$1,000,000 to $1,499,999
- 455$1,500,000 to $1,999,999
- 169$2,000,000 or more
Rent paid by renters in 2022 in Escondido, CA
-
- 78$100 to $149
- 67$150 to $199
- 62$200 to $249
- 84$250 to $299
- 228$300 to $349
- 183$350 to $399
- 149$400 to $449
- 169$450 to $499
- 289$500 to $549
- 153$550 to $599
- 58$600 to $649
- 142$650 to $699
- 99$700 to $749
- 99$750 to $799
- 290$800 to $899
- 394$900 to $999
- 2,053$1,000 to $1,249
- 2,981$1,250 to $1,499
- 9,230$1,500 to $1,999
- 4,508$2,000 to $2,499
- 1,414$2,500 to $2,999
- 642$3,000 to $3,499
- 559$3,500 or more
- 529No cash rent


Percentage of workers working in this county: 97.8%
Number of people working at home: 11,364 (14.5% of all workers)
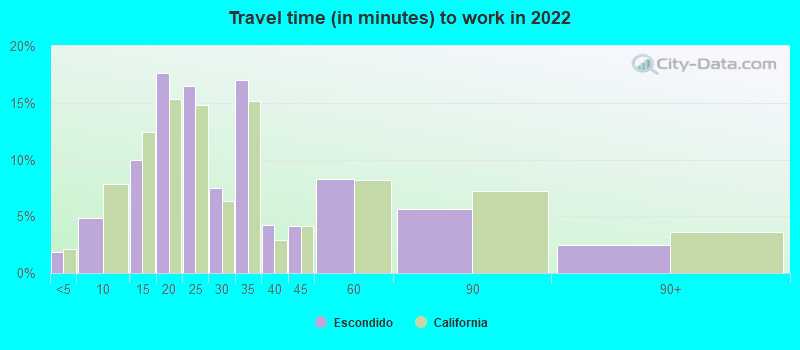
Travel time to work (commute)
- Less than 5 minutes: 1,084
- 5 to 9 minutes: 2,695
- 10 to 14 minutes: 5,280
- 15 to 19 minutes: 9,192
- 20 to 24 minutes: 11,629
- 25 to 29 minutes: 4,686
- 30 to 34 minutes: 13,908
- 35 to 39 minutes: 1,959
- 40 to 44 minutes: 3,922
- 45 to 59 minutes: 8,235
- 60 to 89 minutes: 2,913
- 90 or more minutes: 1,507
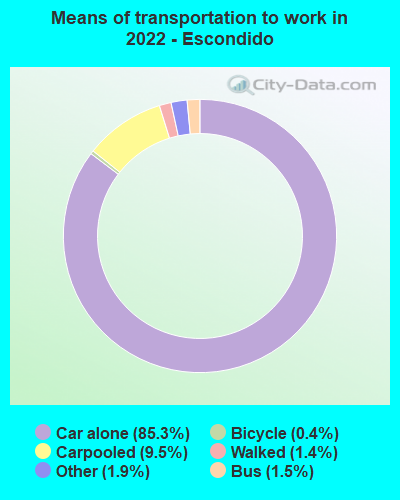
Means of transportation to work:
- Drove a car alone: 43,184 (69.7%)
- Carpooled: 4,786 (7.7%)
- Bus: 763 (1.2%)
- Light rail, streetcar or trolley: 34 (0.1%)
- Taxi: 947 (1.5%)
- Bicycle: 191 (0.3%)
- Walked: 718 (1.2%)
- Worked at home: 11,364 (18.3%)

- Unemployment by race in 2022
- Unemployment rate for White non-Hispanic residents
- 4.5%Males
- 3.9%Females
- Unemployment rate for Black residents
- 2.7%Males
- 8.2%Females
- Unemployment rate for American Indian and Alaska Native residents
- 0.7%Males
- 6.9%Females
- Unemployment rate for Asian residents
- 3.5%Females
- Unemployment rate for other race residents
- 0.4%Males
- 4.4%Females
- Unemployment rate for two or more race residents
- 3.2%Males
- 4.8%Females
- Unemployment rate for Hispanic or Latino residents
- 0.5%Males
- 2.6%Females

- Year of entry for the foreign-born population in Escondido, California
- 6,6972010 or later
- 10,1202000 to 2009
- 9,0951990 to 1999
- 12,5941980 to 1989
- 4,3381970 to 1979
- 3,369Before 1970

First ancestries reported:
- German: 3,365 (3.8%)
- English: 2,935 (3.3%)
- American: 1,983 (2.2%)
- Irish: 1,859 (2.1%)
- Italian: 1,473 (1.7%)
- European: 1,411 (1.6%)
- Dutch: 715 (0.8%)
- Polish: 538 (0.6%)
- Serbian: 507 (0.6%)
- Scottish: 451 (0.5%)
- Norwegian: 389 (0.4%)
- Iranian: 352 (0.4%)
- Scotch-Irish: 316 (0.4%)
- Jamaican: 278 (0.3%)
- Hungarian: 268 (0.3%)
- Lebanese: 252 (0.3%)
- Russian: 241 (0.3%)
- Canadian: 216 (0.2%)
- British: 213 (0.2%)
- French: 164 (0.2%)
- Eastern European: 150 (0.2%)
- Swedish: 144 (0.2%)
- Northern European: 138 (0.2%)
- Nigerian: 137 (0.2%)
- Greek: 136 (0.2%)
- African: 131 (0.1%)
- Afghan: 121 (0.1%)
- West Indian: 114 (0.1%)
- Welsh: 110 (0.1%)
- Portuguese: 106 (0.1%)
- Danish: 93 (0.1%)
- Egyptian: 88 (0.10%)
- French Canadian: 79 (0.09%)
- Scandinavian: 73 (0.08%)
- Arab: 59 (0.07%)
- Austrian: 55 (0.06%)
- Czech: 54 (0.06%)
- Bulgarian: 52 (0.06%)
- Armenian: 51 (0.06%)
- Ghanaian: 50 (0.06%)
- Ethiopian: 40 (0.05%)
- Iraqi: 39 (0.04%)
- Ukrainian: 38 (0.04%)
- Lithuanian: 34 (0.04%)
- Slovak: 33 (0.04%)
- Syrian: 31 (0.04%)
- Belgian: 30 (0.03%)
- Finnish: 29 (0.03%)
- Celtic: 23 (0.03%)
- Czechoslovakian: 22 (0.02%)
- Trinidadian and Tobagonian: 16 (0.02%)
- Basque: 11 (0.01%)
- Israeli: 11 (0.01%)
- Swiss: 11 (0.01%)
- Yugoslavian: 11 (0.01%)
- Icelander: 8 (0.01%)
- Ugandan: 7 (0.01%)
- New Zealander: 5 (0.01%)
- Haitian: 5 (0.01%)
Most common places of birth for foreign-born residents (%):
| Escondido: | 65.7% (26,940) |
| California: | 37.2% (3,881,193) |
| Escondido: | 6.4% (2,616) |
| California: | 7.8% (818,297) |
| Escondido: | 4.4% (1,823) |
| California: | 2.8% (290,436) |
| Escondido: | 3.3% (1,355) |
| California: | 4.9% (512,335) |
Place of birth for U.S.-born residents:
- This state: 77,131
- Other state: 28,707
- Northeast: 6,963
- Midwest: 8,033
- South: 8,012
- West: 5,699
90.6% of Escondido residents lived in the same house 1 years ago.
Out of people who lived in different houses, 42.9% lived in this county.
Out of people who lived in different counties, 30.9% lived in California.
| Escondido: | 90.6% |
| State average: | 88.9% |
Education attainment for males 25 years and older:
- No schooling: 3,330
- Nursery to 4th grade: 1,166
- 5th and 6th grade: 1,211
- 7th and 8th grade: 1,096
- 9th grade: 266
- 10th grade: 291
- 11th grade: 744
- 12th grade, no diploma: 1,183
- High school graduate (or equivalency): 12,447
- Less than 1 year of college: 4,097
- Some college more than 1 year, no degree: 6,872
- Associate degree: 3,732
- Bachelor's degree: 10,836
- Master's degree: 2,846
- Professional school degree: 1,573
- Doctorate degree: 584

Education attainment for females 25 years and older:
- No schooling: 2,994
- Nursery to 4th grade: 286
- 5th and 6th grade: 1,663
- 7th and 8th grade: 1,165
- 9th grade: 581
- 10th grade: 258
- 11th grade: 478
- 12th grade, no diploma: 1,174
- High school graduate (or equivalency): 13,781
- Less than 1 year of college: 5,193
- Some college more than 1 year, no degree: 7,537
- Associate degree: 4,010
- Bachelor's degree: 8,811
- Master's degree: 3,477
- Professional school degree: 1,272
- Doctorate degree: 700


Housing units in structures:
- One, detached: 26,651
- One, attached: 3,476
- Two: 449
- 3 or 4: 2,652
- 5 to 9: 1,776
- 10 to 19: 2,741
- 20 to 49: 2,813
- 50 or more: 8,641
- Mobile homes: 2,918
- Boats, RVs, vans, etc.: 351
Median worth of mobile homes: $192,800
Housing units lacking complete kitchen facilities in 2022: 0.5%
House/condo owner moved in on average 10 years ago
Renter moved in on average 4 years ago

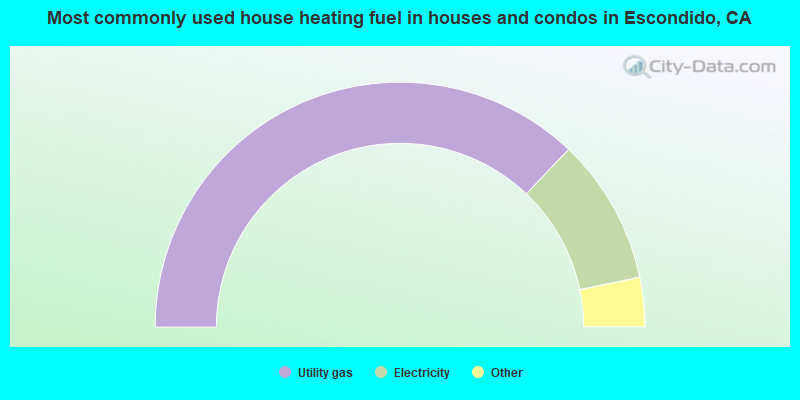
- 74.2%Utility gas
- 19.3%Electricity
- 2.7%Solar energy
- 1.6%Bottled, tank, or LP gas
- 1.5%No fuel used
- 0.3%Wood
- 0.2%Other fuel
- 0.2%Fuel oil, kerosene, etc.
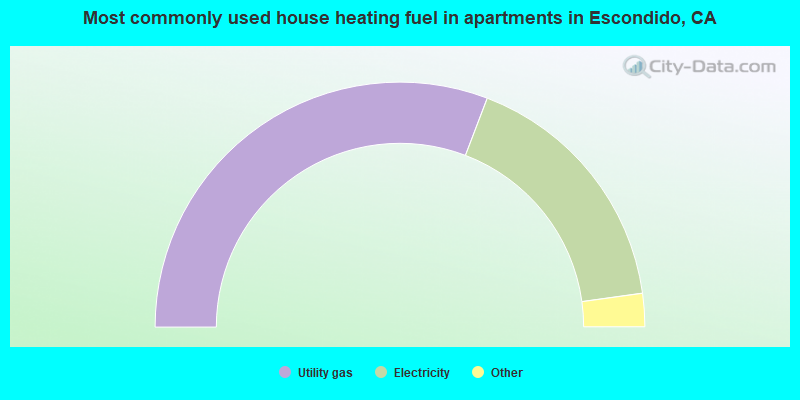
- 61.6%Utility gas
- 34.0%Electricity
- 2.8%No fuel used
- 1.1%Bottled, tank, or LP gas
- 0.3%Solar energy
- 0.2%Wood
Private vs. public school enrollment:
| Here: | 7.5% |
| California: | 10.5% |
| Here: | 3.8% |
| California: | 8.5% |
| Here: | 17.4% |
| California: | 15.9% |


