Eureka, IL (Illinois) Houses and Residents
| Eureka: | $158,579 |
| Illinois: | $251,600 |
Total population: 5,373 (Urban population: 4,967 (all inside urban clusters), Rural population: 69 (all nonfarm))
Houses: 2,409 (2,323 occupied: 1,547 owner occupied, 805 renter occupied)
| % of renters here: | 34% |
| State: | 33% |
Housing density: 895 houses/condos per square mile
Median price asked for vacant for-sale houses and condos in 2022 in this county: $51,922.
Median contract rent in 2022: $702 (lower quartile is $413, upper quartile is $910)
Median rent asked for vacant for-rent units in 2022: $871
Median gross rent in Eureka, IL in 2022: $837
Housing units in Eureka with a mortgage: 760 (72 second mortgage, 0 home equity loan, 62 both second mortgage and home equity loan)
Houses without a mortgage: 0
Median household income for houses/condos with a mortgage: $82,818
Median household income for apartments without a mortgage: $53,902
Median monthly housing costs: $858
Compare current foreclosures near Eureka, IL:
| Photo | Address | Area | Beds / Baths | Price | Details |
|---|---|---|---|---|---|

|
#1
S Liberty St
Eureka, IL 61530
|
- sq. feet
|
- baths - beds |
show details | |

|
#2
Hickory Point Rd
Metamora, IL 61548
|
- sq. feet
|
1 baths 2 beds |
$114,900
|
show details |

|
#3
E Madison St
Morton, IL 61550
|
1,638 sq. feet
|
1 baths 3 beds |
show details | |

|
#4
Court Dr
Washington, IL 61571
|
1,760 sq. feet
|
1 baths 3 beds |
show details | |

|
#5
N Safford Dr
Peoria, IL 61615
|
912 sq. feet
|
1 baths 2 beds |
show details | |

|
#6
E Willcox Ave
Peoria, IL 61603
|
844 sq. feet
|
1 baths 2 beds |
show details | |

|
#7
Jim Ct
East Peoria, IL 61611
|
1,788 sq. feet
|
1 baths 3 beds |
show details | |

|
#8
Sun Valley Ct
East Peoria, IL 61611
|
1,060 sq. feet
|
1 baths 3 beds |
show details | |

|
#9
N Galena Rd
Peoria Heights, IL 61616
|
2,494 sq. feet
|
3 baths 3 beds |
show details | |

|
#10
E Corrington Ave
Peoria, IL 61603
|
2,218 sq. feet
|
1 baths 4 beds |
show details |
| Photo | Address | Area | Beds / Baths | Price | Details |
|---|---|---|---|---|---|

|
#11
Meadow Ave
East Peoria, IL 61611
|
- sq. feet
|
1 baths 2 beds |
show details | |

|
#12
S Cedar St
Washington, IL 61571
|
1,264 sq. feet
|
1 baths 3 beds |
show details | |

|
#13
E 1st St
El Paso, IL 61738
|
1,930 sq. feet
|
3 baths 6 beds |
show details | |

|
#14
Us Highway 150
Goodfield, IL 61742
|
2,300 sq. feet
|
2 baths 5 beds |
show details | |

|
#15
Peoria St
Washington, IL 61571
|
1,518 sq. feet
|
1 baths 3 beds |
show details | |

|
#16
Spring St
East Peoria, IL 61611
|
1,350 sq. feet
|
1 baths 4 beds |
show details | |

|
#17
Briar Ct
East Peoria, IL 61611
|
1,244 sq. feet
|
2 baths 3 beds |
show details | |

|
#18
NE Monroe St
Peoria, IL 61603
|
1,715 sq. feet
|
3 baths 6 beds |
show details | |

|
#19
E Duryea Ave
Peoria Heights, IL 61616
|
1,216 sq. feet
|
1 baths 2 beds |
show details | |

|
#20
Thornton Ct
East Peoria, IL 61611
|
1,624 sq. feet
|
2 baths 3 beds |
show details |
| Photo | Address | Area | Beds / Baths | Price | Details |
|---|---|---|---|---|---|

|
#21
NE Monroe St
Peoria, IL 61603
|
2,484 sq. feet
|
2 baths 4 beds |
show details | |

|
#22
E Glen Ave
Peoria Heights, IL 61616
|
968 sq. feet
|
1 baths 2 beds |
show details | |

|
#23
NE Glendale Ave
Peoria, IL 61603
|
1,292 sq. feet
|
1 baths 3 beds |
show details | |

|
#24
Laveille St
Peoria, IL 61603
|
1,775 sq. feet
|
1 baths 2 beds |
show details | |

|
#25
E Tripp Ave
Peoria, IL 61603
|
1,040 sq. feet
|
1 baths 3 beds |
show details | |

|
#26
Glenridge Dr
East Peoria, IL 61611
|
1,674 sq. feet
|
1 baths 3 beds |
show details | |

|
#27
S East Ln
Peoria, IL 61605
|
925 sq. feet
|
1 baths 2 beds |
show details | |

|
#28
Springfield Rd
East Peoria, IL 61611
|
1,673 sq. feet
|
2 baths 4 beds |
show details | |

|
#29
Terrace Ln
East Peoria, IL 61611
|
2,439 sq. feet
|
2 baths 6 beds |
show details | |

|
#30
Stoneman St
East Peoria, IL 61611
|
1,152 sq. feet
|
1 baths 2 beds |
show details |
| Photo | Address | Area | Beds / Baths | Price | Details |
|---|---|---|---|---|---|

|
#31
Park Ave
Peoria, IL 61603
|
1,494 sq. feet
|
2 baths 3 beds |
show details | |

|
#32
Alexander Ave
Peoria, IL 61603
|
933 sq. feet
|
1 baths 2 beds |
show details | |

|
#33
Alexander Ave
Peoria, IL 61603
|
1,260 sq. feet
|
1 baths 2 beds |
show details | |

|
#34
NE Madison Ave
Peoria, IL 61603
|
420 sq. feet
|
1 baths 2 beds |
show details | |

|
#35
Homestead Ave
Peoria, IL 61603
|
1,111 sq. feet
|
1 baths 3 beds |
show details | |

|
#36
Linden Ln
East Peoria, IL 61611
|
1,032 sq. feet
|
1 baths 4 beds |
show details | |

|
#37
W Illinois St
East Peoria, IL 61611
|
- sq. feet
|
2 baths 3 beds |
show details | |

|
#38
Sun Valley Ct
East Peoria, IL 61611
|
580 sq. feet
|
1 baths 3 beds |
show details | |

|
#39
Sherry Ln
East Peoria, IL 61611
|
1,220 sq. feet
|
1 baths 3 beds |
show details | |

|
#40
Indian Cir
East Peoria, IL 61611
|
1,874 sq. feet
|
1 baths 3 beds |
show details |
| Photo | Address | Area | Beds / Baths | Price | Details |
|---|---|---|---|---|---|

|
#41
E Ridge Rd
East Peoria, IL 61611
|
1,456 sq. feet
|
1 baths 3 beds |
show details | |

|
#42
E Corrington Ave
Peoria, IL 61603
|
1,879 sq. feet
|
2 baths 3 beds |
show details | |

|
#43
Stewart St
East Peoria, IL 61611
|
1,164 sq. feet
|
1 baths 4 beds |
show details | |

|
#44
N Maryland St
Peoria, IL 61603
|
670 sq. feet
|
1 baths 1 beds |
show details | |

|
#45
Crescent Ave
East Peoria, IL 61611
|
1,296 sq. feet
|
1 baths 4 beds |
show details | |

|
#46
N Bigelow St
Peoria, IL 61604
|
2 sq. feet
|
1 baths 4 beds |
show details | |

|
#47
N Bigelow St
Peoria, IL 61604
|
1,176 sq. feet
|
1 baths 3 beds |
show details | |

|
#48
W Forrest Hill Ave
Peoria, IL 61604
|
1,867 sq. feet
|
2 baths 3 beds |
show details | |

|
#49
W Beverly Ct
Peoria, IL 61604
|
3,010 sq. feet
|
2 baths 5 beds |
show details | |

|
Check over 1 million property listings on Foreclosure.com!
|
browse all offers | |||

Latest news about housing in Eureka, IL collected exclusively by city-data.com from local newspapers, TV, and radio stations

 | Trouble finding rental homes in Peoria Area (4 replies) |
| Moving to Peoria for Caterpillar, where to rent? (15 replies) |
| Peoria/Chicago—where to live in between? (21 replies) |
| Would I get a good deal with buying a 1 bedroom house in Henry, IL? (1 reply) |
| Looking to buy an out of the way house (20 replies) |
| Many people are leaving Illinois (313 replies) |

Median year apartment built: 1975
Household type by relationship:
Households: 5,428- Male householders: 697 (171 living alone), Female householders: 1,583 (636 living alone)
1,155 spouses (1,155 opposite-sex spouses), 140 unmarried partners, (140 opposite-sex unmarried partners), 1,169 children (1,129 natural, 18 adopted, 21 stepchildren), 35 grandchildren, 6 brothers or sisters, 6 parents, 0 foster children, 0 other relatives, 57 non-relatives
- In group quarters: 574
Size of family households: 788 2-persons, 249 3-persons, 261 4-persons, 106 5-persons, 27 6-persons.
Size of nonfamily households: 850 1-person, 57 2-persons, 14 4-persons.
673 married couples with children.
202 single-parent households (30 men, 172 women).
97.8% of residents of Eureka speak English at home.
1.1% of residents speak Spanish at home (58% speak English very well, 16% speak English well, 26% speak English not well).
0.5% of residents speak other Indo-European language at home (100% speak English very well).
0.2% of residents speak other language at home (100% speak English very well).
Foreign born population: 36 (0.7%)
(41.7% of them are naturalized citizens)
| Here: | 7.0 |
| State: | 6.4 |
| Here: | 4.3 |
| State: | 4.1 |

- Bedrooms in owner-occupied houses and condos in Eureka, Illinois
- 0no bedroom
- 1181 bedroom
- 2082 bedrooms
- 7853 bedrooms
- 3074 bedrooms
- 1305+ bedrooms

- Bedrooms in renter-occupied apartments in Eureka, Illinois
- 37no bedroom
- 2841 bedroom
- 2492 bedrooms
- 2233 bedrooms
- 134 bedrooms
- 05+ bedrooms

- Cars and other vehicles available in Eureka in owner-occupied houses/condos
- 49no vehicle
- 4521 vehicle
- 7522 vehicles
- 1993 vehicles
- 704 vehicles
- 255+ vehicles

- Cars and other vehicles available in Eureka in renter-occupied apartments
- 113no vehicle
- 3931 vehicle
- 2872 vehicles
- 03 vehicles
- 134 vehicles
- 05+ vehicles

- Rooms in owner-occupied houses in Eureka, Illinois
- 01 room
- 902 rooms
- 03 rooms
- 714 rooms
- 1835 rooms
- 2916 rooms
- 2657 rooms
- 2258 rooms
- 4239+ rooms

- Rooms in renter-occupied apartments in Eureka, Illinois
- 371 room
- 512 rooms
- 613 rooms
- 2874 rooms
- 2985 rooms
- 06 rooms
- 137 rooms
- 318 rooms
- 289+ rooms


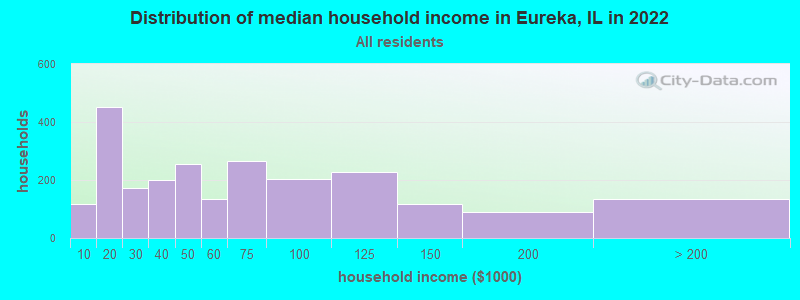
Eureka, IL household income distribution

- 118Less than $10,000
- 451$10,000 to $19,999
- 172$20,000 to $29,999
- 201$30,000 to $39,999
- 254$40,000 to $49,999
- 133$50,000 to $59,999
- 265$60,000 to $74,999
- 203$75,000 to $99,999
- 227$100,000 to $124,999
- 117$125,000 to $149,999
- 91$150,000 to $199,999
- 135$200,000 or more
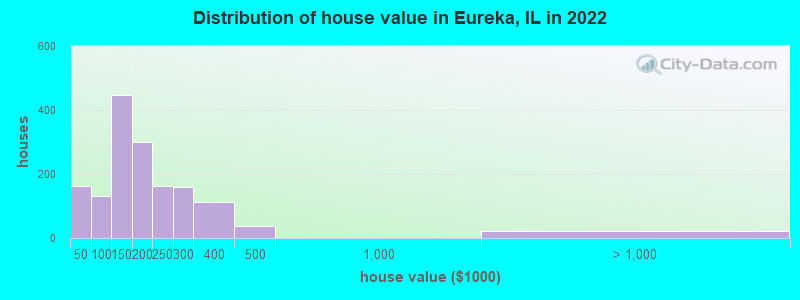
Home value of owner - occupied houses in 2022 in Eureka, IL
-
- 154Less than $10,000
- 9$40,000 to $49,999
- 15$60,000 to $69,999
- 40$80,000 to $89,999
- 64$90,000 to $99,999
- 285$100,000 to $124,999
- 162$125,000 to $149,999
- 241$150,000 to $174,999
- 59$175,000 to $199,999
- 161$200,000 to $249,999
- 158$250,000 to $299,999
- 112$300,000 to $399,999
- 36$400,000 to $499,999
- 23$2,000,000 or more
Rent paid by renters in 2022 in Eureka, IL
-
- 33$100 to $149
- 14$150 to $199
- 58$200 to $249
- 54$250 to $299
- 18$300 to $349
- 19$400 to $449
- 9$450 to $499
- 19$500 to $549
- 9$550 to $599
- 99$600 to $649
- 44$650 to $699
- 97$700 to $749
- 60$750 to $799
- 30$800 to $899
- 174$900 to $999
- 16$1,000 to $1,249
- 14$1,250 to $1,499
- 27No cash rent


Percentage of workers working in this county: 57.1%
Number of people working at home: 221 (8.1% of all workers)
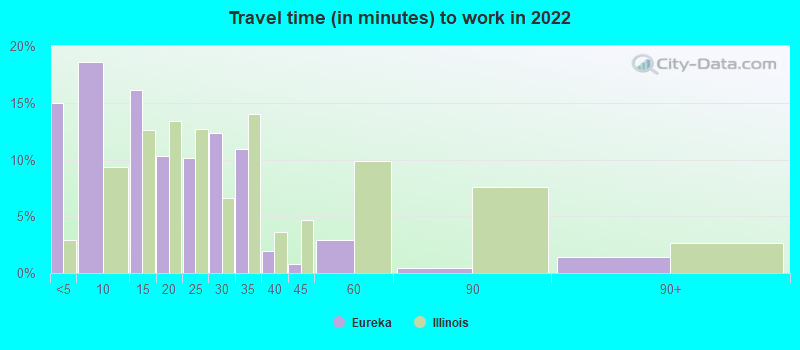
Travel time to work (commute)
- Less than 5 minutes: 352
- 5 to 9 minutes: 435
- 10 to 14 minutes: 229
- 15 to 19 minutes: 115
- 20 to 24 minutes: 317
- 25 to 29 minutes: 208
- 30 to 34 minutes: 345
- 35 to 39 minutes: 67
- 40 to 44 minutes: 148
- 45 to 59 minutes: 40
- 60 to 89 minutes: 37
- 90 or more minutes: 148
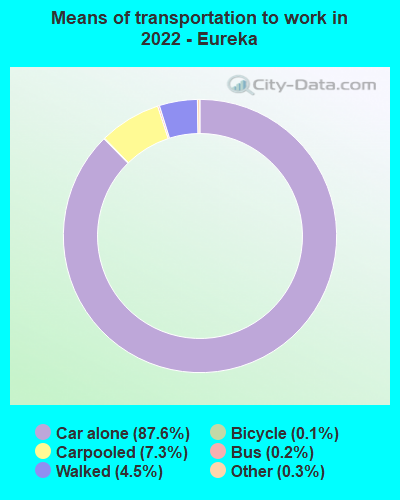
Means of transportation to work:
- Drove a car alone: 2,182 (79.2%)
- Carpooled: 194 (7.0%)
- Bus: 3 (0.1%)
- Taxi: 7 (0.3%)
- Bicycle: 3 (0.1%)
- Walked: 114 (4.1%)
- Worked at home: 221 (8.0%)

- Unemployment by race in 2022
- Unemployment rate for White non-Hispanic residents
- 9.7%Males
- 1.0%Females
- Unemployment rate for Black residents
- 2.9%Females
- Unemployment rate for two or more race residents
- 32.1%Males
- 36.5%Females
- Unemployment rate for Hispanic or Latino residents
- 10.4%Males

- Year of entry for the foreign-born population in Eureka, Illinois
- 82010 or later
- 182000 to 2009
- 01990 to 1999
- 481980 to 1989
- 81970 to 1979
- 21Before 1970

First ancestries reported:
- German: 862 (39.9%)
- European: 254 (11.8%)
- American: 223 (10.3%)
- Irish: 149 (6.9%)
- Polish: 73 (3.4%)
- Dutch: 66 (3.1%)
- English: 66 (3.1%)
- Scandinavian: 65 (3.0%)
- Norwegian: 40 (1.9%)
- Lebanese: 34 (1.6%)
- Italian: 21 (1.0%)
- Swedish: 21 (1.0%)
- Czech: 20 (0.9%)
- Danish: 20 (0.9%)
- Guyanese: 17 (0.8%)
- Scottish: 12 (0.6%)
- Egyptian: 10 (0.5%)
- Eastern European: 7 (0.3%)
- Russian: 3 (0.1%)
Most common places of birth for foreign-born residents (%):
| Eureka: | 25.0% (9) |
| Illinois: | 0.3% (4,938) |
| Eureka: | 25.0% (9) |
| Illinois: | 0.1% (1,178) |
| Eureka: | 22.2% (8) |
| Illinois: | 1.0% (18,753) |
| Eureka: | 16.7% (6) |
| Illinois: | 0.1% (2,269) |
Place of birth for U.S.-born residents:
- This state: 4,391
- Other state: 957
- Northeast: 49
- Midwest: 541
- South: 232
- West: 135
84.7% of Eureka residents lived in the same house 1 years ago.
Out of people who lived in different houses, 34.5% lived in this county.
Out of people who lived in different counties, 86.0% lived in Illinois.
| Eureka: | 84.7% |
| State average: | 88.3% |
Education attainment for males 25 years and older:
- No schooling: 0
- Nursery to 4th grade: 0
- 5th and 6th grade: 6
- 7th and 8th grade: 31
- 9th grade: 6
- 10th grade: 7
- 11th grade: 6
- 12th grade, no diploma: 67
- High school graduate (or equivalency): 528
- Less than 1 year of college: 80
- Some college more than 1 year, no degree: 259
- Associate degree: 134
- Bachelor's degree: 321
- Master's degree: 160
- Professional school degree: 41
- Doctorate degree: 26

Education attainment for females 25 years and older:
- No schooling: 0
- Nursery to 4th grade: 0
- 5th and 6th grade: 0
- 7th and 8th grade: 11
- 9th grade: 0
- 10th grade: 32
- 11th grade: 20
- 12th grade, no diploma: 0
- High school graduate (or equivalency): 515
- Less than 1 year of college: 97
- Some college more than 1 year, no degree: 283
- Associate degree: 308
- Bachelor's degree: 368
- Master's degree: 162
- Professional school degree: 8
- Doctorate degree: 51


Housing units in structures:
- One, detached: 1,716
- One, attached: 188
- Two: 40
- 3 or 4: 99
- 5 to 9: 90
- 10 to 19: 64
- 20 to 49: 25
- 50 or more: 81
- Mobile homes: 102
House/condo owner moved in on average 14 years ago
Renter moved in on average 6 years ago

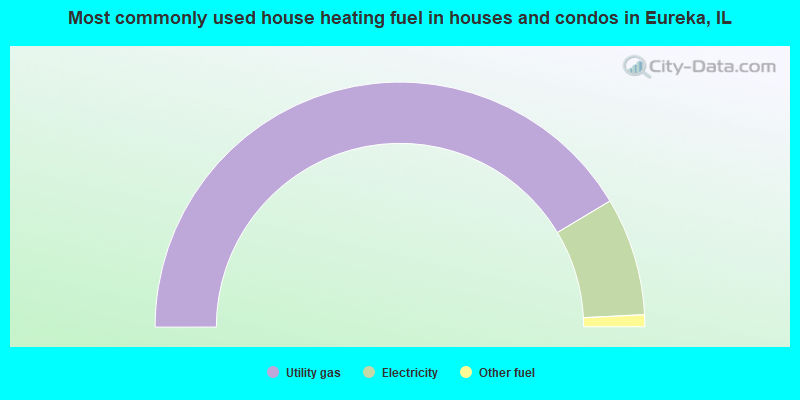
- 82.8%Utility gas
- 15.6%Electricity
- 1.6%Other fuel
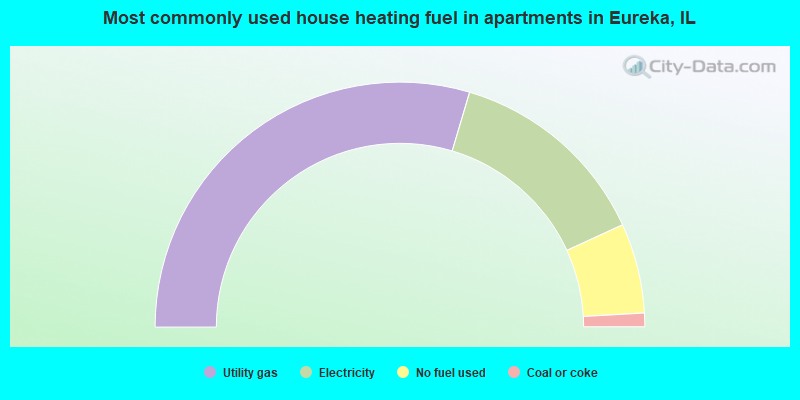
- 59.2%Utility gas
- 27.1%Electricity
- 11.9%No fuel used
- 1.8%Coal or coke
Private vs. public school enrollment:
| Here: | 4.6% |
| Illinois: | 13.3% |
| Here: | 0.0% |
| Illinois: | 9.9% |
| Here: | 64.0% |
| Illinois: | 27.4% |


