Factoryville, PA (Pennsylvania) Houses and Residents
| Factoryville: | $203,172 |
| Pennsylvania: | $245,500 |
Total population: 1,214 (Urban population: 1,144, Rural population: 0)
Houses: 352 (309 occupied: 186 owner occupied, 125 renter occupied)
| % of renters here: | 40% |
| State: | 31% |
Housing density: 472 houses/condos per square mile
Median price asked for vacant for-sale houses and condos in 2022: $662,364.
Median contract rent in 2022: $712 (lower quartile is $519, upper quartile is $866)
Median rent asked for vacant for-rent units in 2022: $587
Median gross rent in Factoryville, PA in 2022: $862
Housing units in Factoryville with a mortgage: 114 (11 second mortgage, 0 home equity loan, 10 both second mortgage and home equity loan)
Houses without a mortgage: 11
Median household income for houses/condos with a mortgage: $92,483
Median household income for apartments without a mortgage: $52,167
Median monthly housing costs: $957
Compare current foreclosures near Factoryville, PA:
| Photo | Address | Area | Beds / Baths | Price | Details |
|---|---|---|---|---|---|

|
#1
Mahon Ave
Factoryville, PA 18419
|
- sq. feet
|
- baths - beds |
show details | |

|
#2
Dalton Rd
Factoryville, PA 18419
|
- sq. feet
|
- baths - beds |
show details | |

|
#3
W Harrison St
Tunkhannock, PA 18657
|
1,710 sq. feet
|
1 baths 3 beds |
$228,900
|
show details |

|
#4
Liberty St
Pittston, PA 18641
|
960 sq. feet
|
1 baths 2 beds |
$152,500
|
show details |

|
#5
Burcher Ave
Clarks Summit, PA 18411
|
1,800 sq. feet
|
2 baths 3 beds |
$445,500
|
show details |

|
#6
Dymond Hollow Rd
Falls, PA 18615
|
1,358 sq. feet
|
1 baths 3 beds |
$295,500
|
show details |

|
#7
Searle St
Pittston, PA 18640
|
1,176 sq. feet
|
1 baths 2 beds |
$169,900
|
show details |

|
#8
Maple St
Scranton, PA 18505
|
1,500 sq. feet
|
1 baths 3 beds |
$195,500
|
show details |

|
#9
Cedar Ave
Scranton, PA 18505
|
1,500 sq. feet
|
1 baths 3 beds |
$26,900
|
show details |

|
#10
Allen St
Scranton, PA 18512
|
1,045 sq. feet
|
1 baths 2 beds |
$231,000
|
show details |
| Photo | Address | Area | Beds / Baths | Price | Details |
|---|---|---|---|---|---|

|
#11
Mathewson Ter
Factoryville, PA 18419
|
- sq. feet
|
- baths - beds |
show details | |

|
#12
College Ave
Factoryville, PA 18419
|
- sq. feet
|
- baths - beds |
show details | |

|
#13
Mahon Ave
Factoryville, PA 18419
|
- sq. feet
|
- baths - beds |
show details | |

|
#14
Old Mill Rd
Dalton, PA 18414
|
- sq. feet
|
1 baths 2 beds |
$114,400
|
show details |

|
#15
Rachel Dr
Archbald, PA 18403
|
2,050 sq. feet
|
2 baths 3 beds |
show details | |

|
#16
5th St
Jermyn, PA 18433
|
2,100 sq. feet
|
1 baths 3 beds |
show details | |

|
#17
Grace St
Scranton, PA 18509
|
1,220 sq. feet
|
2 baths 4 beds |
show details | |

|
#18
S Main St
Archbald, PA 18403
|
1,529 sq. feet
|
2 baths 3 beds |
show details | |

|
#19
Circle Dr
Pittston, PA 18643
|
- sq. feet
|
1 baths 3 beds |
show details | |

|
#20
N Main Ave
Scranton, PA 18508
|
1,400 sq. feet
|
1 baths 3 beds |
show details |
| Photo | Address | Area | Beds / Baths | Price | Details |
|---|---|---|---|---|---|

|
#21
Spring St
Carbondale, PA 18407
|
1,276 sq. feet
|
1 baths 3 beds |
show details | |

|
#22
Wilson St
Jessup, PA 18434
|
1,548 sq. feet
|
2 baths 3 beds |
show details | |

|
#23
S Church St
Carbondale, PA 18407
|
3,100 sq. feet
|
3 baths 4 beds |
show details | |

|
#24
Whitmore Ave
Jermyn, PA 18433
|
870 sq. feet
|
1 baths 2 beds |
show details | |

|
#25
Poplar St
Dickson City, PA 18519
|
1,160 sq. feet
|
1 baths 3 beds |
show details | |

|
#26
Reservoir St
Carbondale, PA 18407
|
- sq. feet
|
2 baths 6 beds |
show details | |

|
#27
Lower Powderly St
Carbondale, PA 18407
|
- sq. feet
|
2 baths 3 beds |
show details | |

|
#28
N Sumner Ave
Scranton, PA 18508
|
1,025 sq. feet
|
1 baths 2 beds |
show details | |

|
#29
Laurel Creek Dr
Dickson City, PA 18519
|
2,099 sq. feet
|
2 baths 4 beds |
show details | |

|
#30
Pittston Ave
Scranton, PA 18505
|
1,856 sq. feet
|
2 baths 2 beds |
show details |
| Photo | Address | Area | Beds / Baths | Price | Details |
|---|---|---|---|---|---|

|
#31
Main St
Peckville, PA 18452
|
1,768 sq. feet
|
1 baths 4 beds |
show details | |

|
#32
N Garfield Ave
Scranton, PA 18504
|
1,776 sq. feet
|
1 baths 4 beds |
show details | |

|
#33
Shady Lane Rd
Clarks Summit, PA 18411
|
2,648 sq. feet
|
2 baths 5 beds |
show details | |

|
#34
Sanderson Ave
Olyphant, PA 18447
|
- sq. feet
|
1 baths 3 beds |
show details | |

|
#35
Evergreen Dr
Clarks Summit, PA 18411
|
1,100 sq. feet
|
1 baths 3 beds |
show details | |

|
#36
Linden St
Pittston, PA 18643
|
2,428 sq. feet
|
3 baths 3 beds |
show details | |

|
#37
Sr 92 N
Tunkhannock, PA 18657
|
1 sq. feet
|
2 baths 2 beds |
show details | |

|
#38
S Hyde Park Ave
Scranton, PA 18504
|
1,760 sq. feet
|
2 baths 4 beds |
show details | |

|
#39
Petrilak Rd
Carbondale, PA 18407
|
1,400 sq. feet
|
1 baths 3 beds |
show details | |

|
#40
Church St
Pittston, PA 18640
|
1,668 sq. feet
|
1 baths 4 beds |
show details |
| Photo | Address | Area | Beds / Baths | Price | Details |
|---|---|---|---|---|---|

|
#41
Elkview Dr
Forest City, PA 18421
|
1,080 sq. feet
|
1 baths 3 beds |
show details | |

|
#42
Grace St
Scranton, PA 18509
|
- sq. feet
|
- baths - beds |
$39,900
|
show details |

|
#43
Dymond Ter
Tunkhannock, PA 18657
|
- sq. feet
|
1 baths 2 beds |
show details | |

|
#44
Oak St
Taylor, PA 18517
|
- sq. feet
|
1 baths 4 beds |
show details | |

|
#45
Thomas St
Archbald, PA 18403
|
- sq. feet
|
2 baths 2 beds |
show details | |

|
#46
W Grove St
Taylor, PA 18517
|
- sq. feet
|
1 baths 3 beds |
show details | |

|
#47
Griffin Pond Rd
Clarks Summit, PA 18411
|
- sq. feet
|
2 baths 3 beds |
show details | |

|
#48
Main St
Archbald, PA 18403
|
- sq. feet
|
- baths - beds |
$24,900
|
show details |

|
#49
N Irving Ave
Scranton, PA 18510
|
1,770 sq. feet
|
2 baths 3 beds |
show details | |

|
Check over 1 million property listings on Foreclosure.com!
|
browse all offers | |||

Latest news about housing in Factoryville, PA collected exclusively by city-data.com from local newspapers, TV, and radio stations

 | Looking for interior painter for new home in Factoryville (2 replies) |
| Is eastern PA really as bad as it sounds? (23 replies) |
| Visiting WilkesBarre from Seattle... help? (33 replies) |
| Foliage 2015 (11 replies) |
| Rentals? (17 replies) |
| Dallas or Abington Heights schools-please advise! (4 replies) |

Median year apartment built: 1987
Household type by relationship:
Households: 1,222- Male householders: 151 (60 living alone), Female householders: 153 (48 living alone)
140 spouses (135 opposite-sex spouses), 14 unmarried partners, (12 opposite-sex unmarried partners), 270 children (259 natural, 7 adopted, 2 stepchildren), 7 grandchildren, 13 brothers or sisters, 10 parents, 0 foster children, 12 other relatives, 0 non-relatives
- In group quarters: 444
Size of family households: 61 2-persons, 71 3-persons, 9 4-persons, 23 5-persons, 2 6-persons, 11 7-or-more-persons.
Size of nonfamily households: 113 1-person, 17 2-persons.
174 married couples with children.
41 single-parent households (0 men, 41 women).
95.6% of residents of Factoryville speak English at home.
1.7% of residents speak Spanish at home (100% speak English very well).
1.3% of residents speak other Indo-European language at home (100% speak English very well).
0.2% of residents speak other language at home (100% speak English very well).
Foreign born population: 18 (1.5%)
(105.6% of them are naturalized citizens)
| Here: | 7.0 |
| State: | 6.8 |
| Here: | 4.3 |
| State: | 4.3 |

- Bedrooms in owner-occupied houses and condos in Factoryville, Pennsylvania
- 0no bedroom
- 01 bedroom
- 102 bedrooms
- 1173 bedrooms
- 394 bedrooms
- 205+ bedrooms

- Bedrooms in renter-occupied apartments in Factoryville, Pennsylvania
- 0no bedroom
- 501 bedroom
- 512 bedrooms
- 163 bedrooms
- 84 bedrooms
- 05+ bedrooms

- Cars and other vehicles available in Factoryville in owner-occupied houses/condos
- 0no vehicle
- 391 vehicle
- 912 vehicles
- 443 vehicles
- 64 vehicles
- 75+ vehicles

- Cars and other vehicles available in Factoryville in renter-occupied apartments
- 17no vehicle
- 751 vehicle
- 312 vehicles
- 23 vehicles
- 04 vehicles
- 05+ vehicles

- Rooms in owner-occupied houses in Factoryville, Pennsylvania
- 01 room
- 02 rooms
- 03 rooms
- 04 rooms
- 55 rooms
- 696 rooms
- 417 rooms
- 318 rooms
- 419+ rooms

- Rooms in renter-occupied apartments in Factoryville, Pennsylvania
- 01 room
- 142 rooms
- 283 rooms
- 284 rooms
- 305 rooms
- 166 rooms
- 37 rooms
- 58 rooms
- 29+ rooms


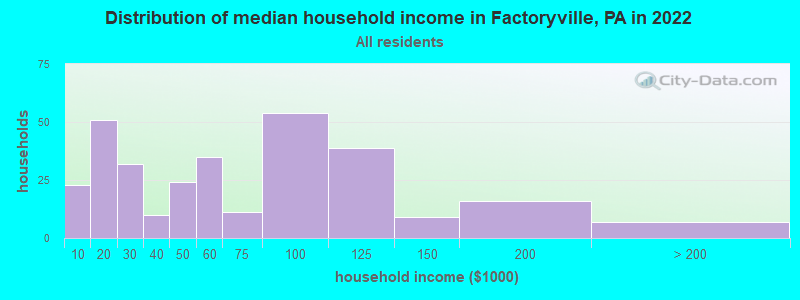
Factoryville, PA household income distribution

- 23Less than $10,000
- 51$10,000 to $19,999
- 32$20,000 to $29,999
- 10$30,000 to $39,999
- 24$40,000 to $49,999
- 35$50,000 to $59,999
- 11$60,000 to $74,999
- 54$75,000 to $99,999
- 39$100,000 to $124,999
- 9$125,000 to $149,999
- 16$150,000 to $199,999
- 7$200,000 or more
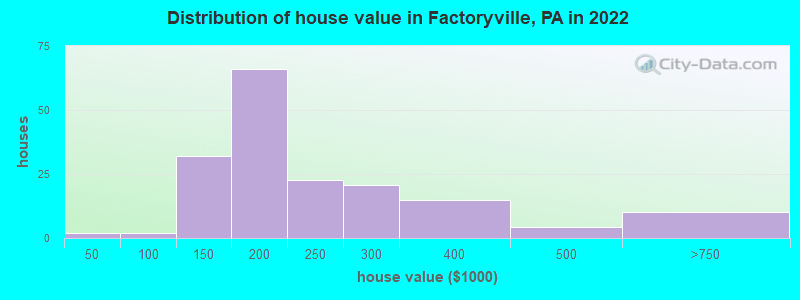
Home value of owner - occupied houses in 2022 in Factoryville, PA
-
- 2$20,000 to $24,999
- 1$80,000 to $89,999
- 9$100,000 to $124,999
- 22$125,000 to $149,999
- 26$150,000 to $174,999
- 39$175,000 to $199,999
- 22$200,000 to $249,999
- 20$250,000 to $299,999
- 14$300,000 to $399,999
- 4$400,000 to $499,999
- 10$500,000 to $749,999
Rent paid by renters in 2022 in Factoryville, PA
-
- 16$200 to $249
- 2$300 to $349
- 7$350 to $399
- 19$500 to $549
- 4$550 to $599
- 10$600 to $649
- 3$650 to $699
- 3$700 to $749
- 13$750 to $799
- 21$800 to $899
- 9$900 to $999
- 6$1,500 to $1,999
- 10No cash rent

Percentage of workers working in this county: 53.0%
Number of people working at home: 44 (11.8% of all workers)
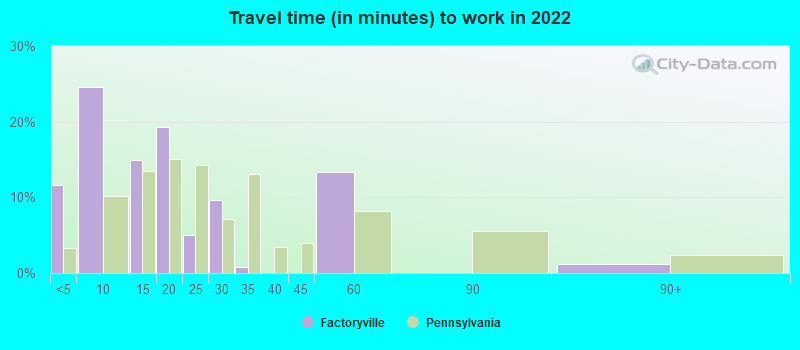
Travel time to work (commute)
- Less than 5 minutes: 31
- 5 to 9 minutes: 77
- 10 to 14 minutes: 34
- 15 to 19 minutes: 35
- 20 to 24 minutes: 44
- 25 to 29 minutes: 16
- 30 to 34 minutes: 34
- 35 to 39 minutes: 19
- 40 to 44 minutes: 12
- 45 to 59 minutes: 10
- 60 to 89 minutes: 4
- 90 or more minutes: 5
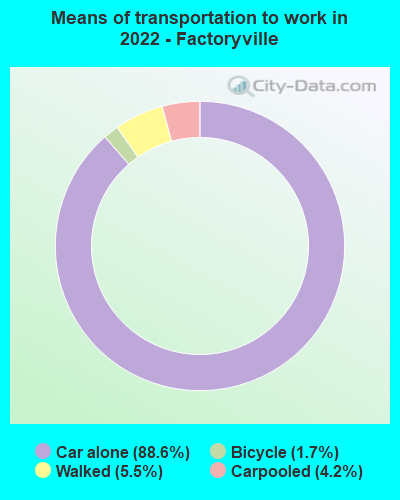
Means of transportation to work:
- Drove a car alone: 349 (79.0%)
- Carpooled: 16 (3.6%)
- Bicycle: 8 (1.8%)
- Walked: 21 (4.8%)
- Worked at home: 44 (10.0%)
- Unemployment by race in 2022
- Unemployment rate for White non-Hispanic residents
- 6.4%Males
- 9.5%Females
- Unemployment rate for two or more race residents
- 71.3%Females

- Year of entry for the foreign-born population in Factoryville, Pennsylvania
- 02010 or later
- 42000 to 2009
- 01990 to 1999
- 71980 to 1989
- 01970 to 1979
- 7Before 1970

First ancestries reported:
- Irish: 62 (20.6%)
- German: 47 (15.7%)
- English: 29 (9.7%)
- Italian: 27 (9.0%)
- Polish: 12 (4.0%)
- American: 11 (3.7%)
- African: 5 (1.7%)
- Welsh: 5 (1.7%)
- Scottish: 3 (1.0%)
- Swedish: 3 (1.0%)
- Hungarian: 1 (0.3%)
- Nigerian: 1 (0.3%)
- Yugoslavian: 1 (0.3%)
Most common places of birth for foreign-born residents (%):
| Factoryville: | 61.1% (11) |
| Pennsylvania: | 0.2% (1,752) |
| Factoryville: | 27.8% (5) |
| Pennsylvania: | 1.9% (18,065) |
| Factoryville: | 11.1% (2) |
| Pennsylvania: | 1.0% (9,205) |
| Factoryville: | 11.1% (2) |
| Pennsylvania: | 7.2% (67,704) |
| Factoryville: | 5.6% (1) |
| Pennsylvania: | 2.2% (21,039) |
| Factoryville: | 5.6% (1) |
| Pennsylvania: | 0.1% (544) |
Place of birth for U.S.-born residents:
- This state: 809
- Other state: 397
- Northeast: 176
- Midwest: 51
- South: 145
- West: 23
79.5% of Factoryville residents lived in the same house 1 years ago.
Out of people who lived in different houses, 9.1% lived in this county.
Out of people who lived in different counties, 49.8% lived in Pennsylvania.
| Factoryville: | 79.5% |
| State average: | 89.3% |
Education attainment for males 25 years and older:
- No schooling: 0
- Nursery to 4th grade: 0
- 5th and 6th grade: 0
- 7th and 8th grade: 0
- 9th grade: 1
- 10th grade: 5
- 11th grade: 4
- 12th grade, no diploma: 12
- High school graduate (or equivalency): 73
- Less than 1 year of college: 23
- Some college more than 1 year, no degree: 20
- Associate degree: 7
- Bachelor's degree: 46
- Master's degree: 19
- Professional school degree: 2
- Doctorate degree: 7

Education attainment for females 25 years and older:
- No schooling: 2
- Nursery to 4th grade: 0
- 5th and 6th grade: 0
- 7th and 8th grade: 1
- 9th grade: 0
- 10th grade: 0
- 11th grade: 5
- 12th grade, no diploma: 3
- High school graduate (or equivalency): 94
- Less than 1 year of college: 9
- Some college more than 1 year, no degree: 67
- Associate degree: 11
- Bachelor's degree: 49
- Master's degree: 36
- Professional school degree: 5
- Doctorate degree: 2


Housing units in structures:
- One, detached: 239
- One, attached: 10
- Two: 32
- 3 or 4: 44
- 5 to 9: 6
- 10 to 19: 14
- Mobile homes: 6
House/condo owner moved in on average 22 years ago
Renter moved in on average 1 years ago

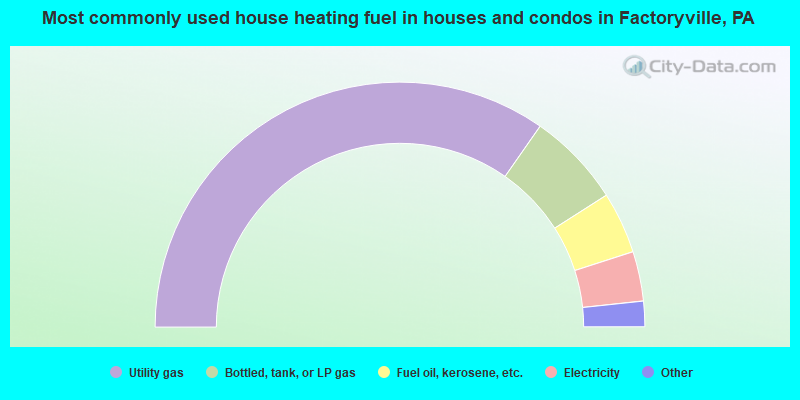
- 69.9%Utility gas
- 12.6%Bottled, tank, or LP gas
- 8.2%Fuel oil, kerosene, etc.
- 6.6%Electricity
- 1.6%Wood
- 1.1%Other fuel

- 47.2%Electricity
- 39.8%Utility gas
- 7.3%Wood
- 5.7%Fuel oil, kerosene, etc.
Private vs. public school enrollment:
| Here: | 74.5% |
| Pennsylvania: | 15.7% |
| Here: | 70.0% |
| Pennsylvania: | 13.4% |
| Here: | 77.8% |
| Pennsylvania: | 39.8% |


