Housing density: 1,688 houses/condos per square mile
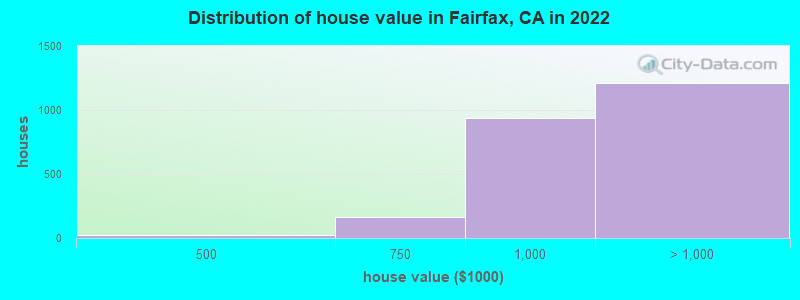
Median price asked for vacant for-sale houses and condos in 2022 in this county: $3,364,178.
Median contract rent in 2022: over $2,000 (lower quartile is $1,498, upper quartile is over $2,000)
Median rent asked for vacant for-rent units in 2022: $1,536
Median gross rent in Fairfax, CA in 2022: over $2,000
Housing units in Fairfax with a mortgage: 1,259 (296 second mortgage, 34 home equity loan, 235 both second mortgage and home equity loan) Houses without a mortgage: 34
Median household income for houses/condos with a mortgage: $181,297
Median household income for apartments without a mortgage: $119,251
764 married couples with children.
418 single-parent households (117 men, 301 women).
88.9% of residents of Fairfax speak English at home.
6.2% of residents speak Spanish at home (57% speak English very well, 19% speak English well, 24% speak English not well).
1.8% of residents speak other Indo-European language at home (100% speak English very well).
1.3% of residents speak Asian or Pacific Island language at home (71% speak English very well, 29% speak English well).
1.5% of residents speak other language at home (100% speak English very well).
Foreign born population: 812 (10.9%)
(73.3% of them are naturalized citizens)
Percentage of workers working in this county: 88.4% Number of people working at home: 1,606 (42.1% of all workers)
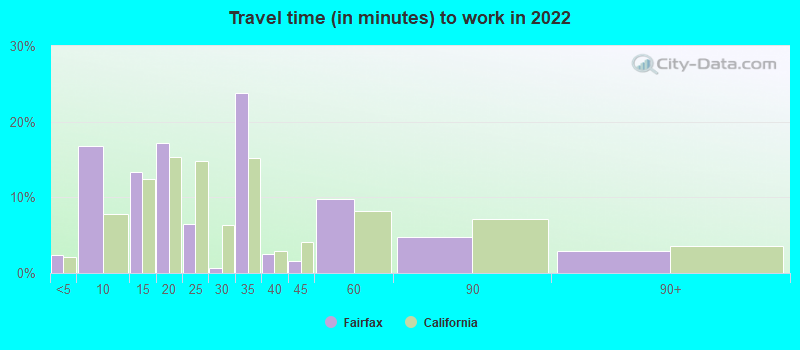
Travel time to work (commute)
Less than 5 minutes: 127
5 to 9 minutes: 261
10 to 14 minutes: 225
15 to 19 minutes: 296
20 to 24 minutes: 246
25 to 29 minutes: 79
30 to 34 minutes: 265
35 to 39 minutes: 114
40 to 44 minutes: 157
45 to 59 minutes: 134
60 to 89 minutes: 335
90 or more minutes: 46
Means of transportation to work:
Drove a car alone: 1,192 (38.9%)
Carpooled: 112 (3.7%)
Bus: 57 (1.9%)
Long-distance train or commuter rail: 19 (0.6%)
Bicycle: 178 (5.8%)
Walked: 146 (4.8%)
Worked at home: 1,606 (52.4%)
Unemployment by race in 2022
Unemployment rate for White non-Hispanic residents
11.6%Males
11.0%Females
Unemployment rate for other race residents
19.1%Females
Unemployment rate for Hispanic or Latino residents
16.2%Females
Year of entry for the foreign-born population in Fairfax, California
1792010 or later
972000 to 2009
2171990 to 1999
2101980 to 1989
731970 to 1979
194Before 1970
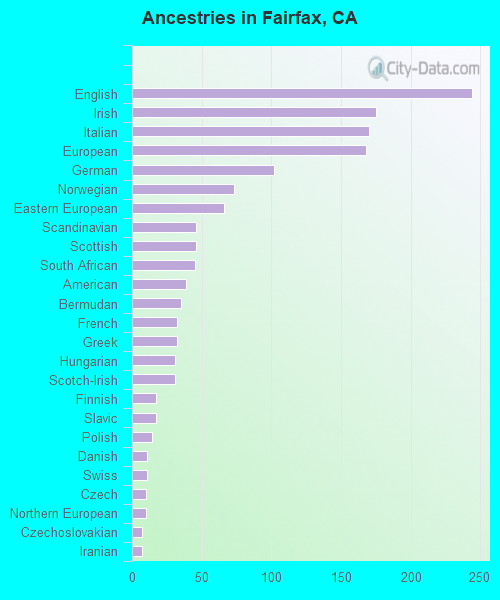
First ancestries reported:
English: 244 (10.8%)
Irish: 175 (7.7%)
Italian: 170 (7.5%)
European: 168 (7.4%)
German: 102 (4.5%)
Norwegian: 73 (3.2%)
Eastern European: 66 (2.9%)
Scandinavian: 46 (2.0%)
Scottish: 46 (2.0%)
South African: 45 (2.0%)
American: 39 (1.7%)
Bermudan: 35 (1.5%)
French: 32 (1.4%)
Greek: 32 (1.4%)
Hungarian: 31 (1.4%)
Scotch-Irish: 31 (1.4%)
Finnish: 17 (0.8%)
Slavic: 17 (0.8%)
Polish: 14 (0.6%)
Danish: 11 (0.5%)
Swiss: 11 (0.5%)
Czech: 10 (0.4%)
Northern European: 10 (0.4%)
Czechoslovakian: 7 (0.3%)
Iranian: 7 (0.3%)
Swedish: 7 (0.3%)
Most common places of birth for foreign-born residents (%):
South Africa
Fairfax:
12.2% (100)
California:
0.2% (20,614)
Guatemala
Fairfax:
11.4% (93)
California:
2.8% (290,436)
Israel
Fairfax:
8.1% (66)
California:
0.3% (33,029)
France
Fairfax:
6.0% (49)
California:
0.4% (40,224)
Hong Kong
Fairfax:
5.3% (43)
California:
1.0% (105,215)
Mexico
Fairfax:
5.1% (42)
California:
37.2% (3,881,193)
Nicaragua
Fairfax:
5.1% (42)
California:
0.6% (58,161)
Fiji
Fairfax:
5.0% (41)
California:
0.3% (33,937)
Germany
Fairfax:
4.0% (33)
California:
0.7% (73,304)
Canada
Fairfax:
4.0% (33)
California:
1.2% (127,477)
Other Northern America
Fairfax:
3.4% (28)
California:
0.0% (476)
England
Fairfax:
3.3% (27)
California:
0.6% (57,953)
Sri Lanka
Fairfax:
3.1% (25)
California:
0.1% (11,287)
Thailand
Fairfax:
2.9% (24)
California:
0.6% (65,335)
Italy
Fairfax:
2.7% (22)
California:
0.3% (31,439)
El Salvador
Fairfax:
2.6% (21)
California:
4.2% (440,287)
China, excluding Hong Kong and Taiwan
Fairfax:
2.3% (19)
California:
6.6% (684,672)
Argentina
Fairfax:
2.2% (18)
California:
0.3% (33,960)
Other Eastern Africa
Fairfax:
1.8% (15)
California:
0.0% (4,776)
Place of birth for U.S.-born residents:
This state: 4,182
Other state: 2,324
Northeast: 868
Midwest: 636
South: 263
West: 559
90.2% of Fairfax residents lived in the same house 1 years ago. Out of people who lived in different houses, 20.9% lived in this county. Out of people who lived in different counties, 48.5% lived in California.
Fairfax:
90.2%
State average:
88.9%
Education attainment for males 25 years and older:
No schooling: 0
Nursery to 4th grade: 0
5th and 6th grade: 0
7th and 8th grade: 0
9th grade: 55
10th grade: 8
11th grade: 9
12th grade, no diploma: 63
High school graduate (or equivalency): 316
Less than 1 year of college: 210
Some college more than 1 year, no degree: 203
Associate degree: 178
Bachelor's degree: 821
Master's degree: 412
Professional school degree: 318
Doctorate degree: 97
Education attainment for females 25 years and older:
No schooling: 0
Nursery to 4th grade: 0
5th and 6th grade: 0
7th and 8th grade: 0
9th grade: 0
10th grade: 0
11th grade: 10
12th grade, no diploma: 15
High school graduate (or equivalency): 169
Less than 1 year of college: 100
Some college more than 1 year, no degree: 300
Associate degree: 106
Bachelor's degree: 1,461
Master's degree: 630
Professional school degree: 100
Doctorate degree: 146
Housing units in structures:
One, detached: 2,413
One, attached: 275
Two: 314
3 or 4: 94
5 to 9: 143
10 to 19: 128
20 to 49: 143
50 or more: 72
Mobile homes: 6
Housing units lacking complete plumbing facilities in 2022: 1.8%
Housing units lacking complete kitchen facilities in 2022: 1.8%
House/condo owner moved in on average 13 years ago