Housing density: 1,054 houses/condos per square mile
Median price asked for vacant for-sale houses and condos in 2022: $505,083.
Median contract rent in 2022: $1,905 (lower quartile is $1,449, upper quartile is over $2,000)
Median rent asked for vacant for-rent units in 2022: $1,128
Median gross rent in Fairfield, CA in 2022: over $2,000
Housing units in Fairfield with a mortgage: 18,822 (1,894 second mortgage, 43 home equity loan, 1,107 both second mortgage and home equity loan) Houses without a mortgage: 511
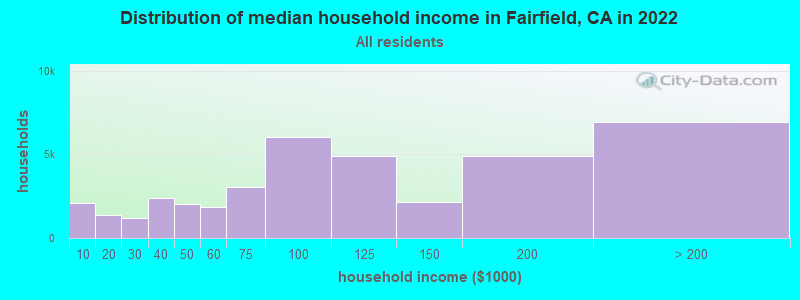
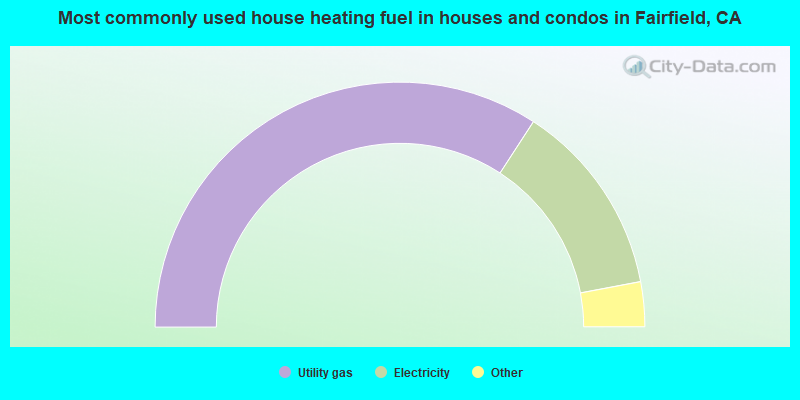
Median household income for houses/condos with a mortgage: $121,760
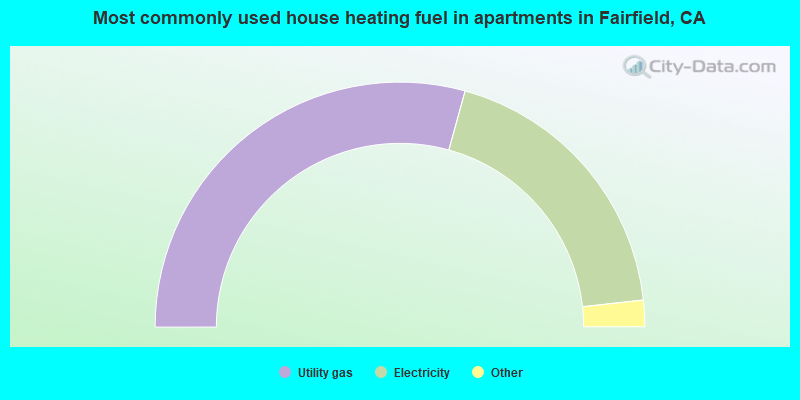
Median household income for apartments without a mortgage: $76,755
19,323 married couples with children.
6,628 single-parent households (2,518 men, 4,110 women).
64.2% of residents of Fairfield speak English at home.
21.1% of residents speak Spanish at home (52% speak English very well, 21% speak English well, 18% speak English not well, 9% don't speak English at all).
3.1% of residents speak other Indo-European language at home (61% speak English very well, 28% speak English well, 9% speak English not well, 2% don't speak English at all).
10.9% of residents speak Asian or Pacific Island language at home (62% speak English very well, 25% speak English well, 12% speak English not well, 2% don't speak English at all).
0.5% of residents speak other language at home (74% speak English very well, 19% speak English well, 3% speak English not well, 4% don't speak English at all).
Foreign born population: 26,302 (22.0%)
(57.6% of them are naturalized citizens)
Percentage of workers working in this county: 66.7% Number of people working at home: 7,372 (13.3% of all workers)
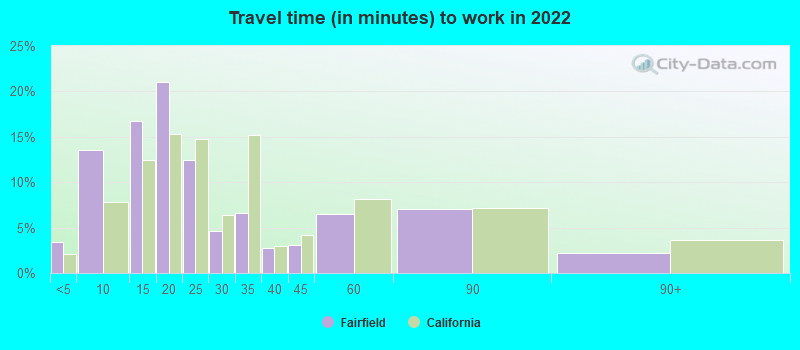
Travel time to work (commute)
Less than 5 minutes: 890
5 to 9 minutes: 4,452
10 to 14 minutes: 6,306
15 to 19 minutes: 6,690
20 to 24 minutes: 5,274
25 to 29 minutes: 2,349
30 to 34 minutes: 4,898
35 to 39 minutes: 265
40 to 44 minutes: 1,749
45 to 59 minutes: 5,038
60 to 89 minutes: 7,937
90 or more minutes: 2,126
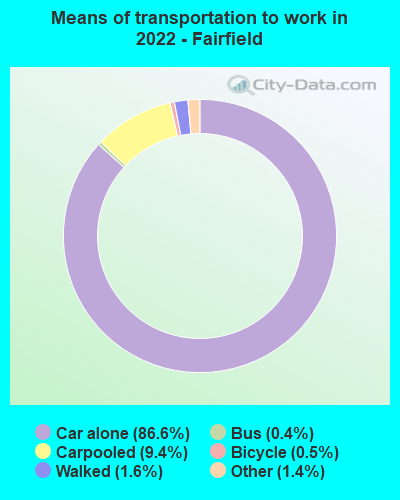
Means of transportation to work:
Drove a car alone: 37,432 (72.7%)
Carpooled: 4,869 (9.5%)
Bus: 133 (0.3%)
Subway or elevated rail: 10 (0.0%)
Long-distance train or commuter rail: 31 (0.1%)
Ferryboat: 18 (0.0%)
Taxi: 558 (1.1%)
Bicycle: 259 (0.5%)
Walked: 595 (1.2%)
Worked at home: 7,251 (14.1%)
Unemployment by race in 2022
Unemployment rate for White non-Hispanic residents
5.1%Males
0.7%Females
Unemployment rate for Black residents
7.0%Males
5.0%Females
Unemployment rate for Asian residents
0.9%Males
5.3%Females
Unemployment rate for other race residents
3.1%Males
10.8%Females
Unemployment rate for two or more race residents
9.5%Males
3.1%Females
Unemployment rate for Hispanic or Latino residents
5.9%Males
2.1%Females
Year of entry for the foreign-born population in Fairfield, California
6,8322010 or later
7,6482000 to 2009
6,0741990 to 1999
4,6601980 to 1989
2,8021970 to 1979
2,955Before 1970
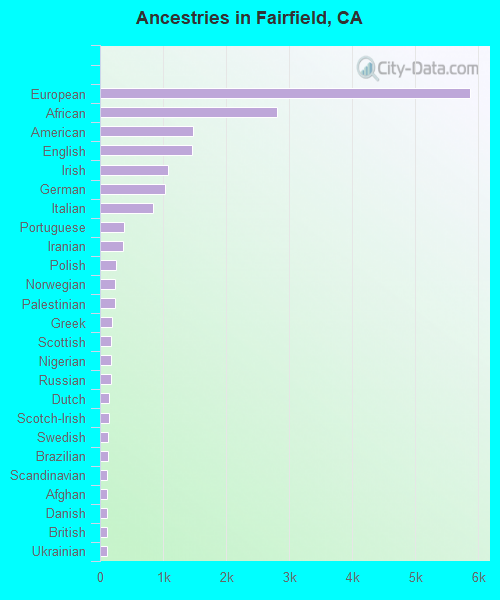
First ancestries reported:
European: 5,876 (8.1%)
African: 2,810 (3.9%)
American: 1,468 (2.0%)
English: 1,457 (2.0%)
Irish: 1,083 (1.5%)
German: 1,031 (1.4%)
Italian: 834 (1.1%)
Portuguese: 374 (0.5%)
Iranian: 360 (0.5%)
Polish: 248 (0.3%)
Norwegian: 234 (0.3%)
Palestinian: 232 (0.3%)
Greek: 195 (0.3%)
Scottish: 170 (0.2%)
Nigerian: 169 (0.2%)
Russian: 167 (0.2%)
Dutch: 148 (0.2%)
Scotch-Irish: 136 (0.2%)
Swedish: 126 (0.2%)
Brazilian: 119 (0.2%)
Scandinavian: 114 (0.2%)
Afghan: 113 (0.2%)
Danish: 111 (0.2%)
British: 108 (0.1%)
Ukrainian: 105 (0.1%)
Ethiopian: 97 (0.1%)
French: 96 (0.1%)
Northern European: 82 (0.1%)
Kenyan: 73 (0.1%)
Moroccan: 66 (0.09%)
West Indian: 63 (0.09%)
Ghanaian: 58 (0.08%)
Hungarian: 52 (0.07%)
French Canadian: 52 (0.07%)
Eastern European: 52 (0.07%)
Canadian: 52 (0.07%)
Swiss: 44 (0.06%)
Arab: 30 (0.04%)
Egyptian: 29 (0.04%)
New Zealander: 27 (0.04%)
Finnish: 26 (0.04%)
Romanian: 25 (0.03%)
Armenian: 25 (0.03%)
Belizean: 24 (0.03%)
Welsh: 23 (0.03%)
Iraqi: 22 (0.03%)
Turkish: 22 (0.03%)
Croatian: 21 (0.03%)
Senegalese: 21 (0.03%)
Celtic: 20 (0.03%)
Maltese: 18 (0.02%)
Slavic: 15 (0.02%)
Haitian: 15 (0.02%)
British West Indian: 13 (0.02%)
Slovene: 12 (0.02%)
Syrian: 11 (0.02%)
Lithuanian: 9 (0.01%)
South African: 9 (0.01%)
Jamaican: 9 (0.01%)
Trinidadian and Tobagonian: 9 (0.01%)
Icelander: 5 (0.01%)
Most common places of birth for foreign-born residents (%):
Mexico
Fairfield:
35.5% (9,423)
California:
37.2% (3,881,193)
Philippines
Fairfield:
26.4% (7,004)
California:
7.8% (818,297)
India
Fairfield:
5.9% (1,571)
California:
5.2% (539,184)
China, excluding Hong Kong and Taiwan
Fairfield:
3.0% (793)
California:
6.6% (684,672)
El Salvador
Fairfield:
2.2% (578)
California:
4.2% (440,287)
Vietnam
Fairfield:
2.0% (529)
California:
4.9% (512,335)
Canada
Fairfield:
1.6% (431)
California:
1.2% (127,477)
Guatemala
Fairfield:
1.6% (420)
California:
2.8% (290,436)
Place of birth for U.S.-born residents:
This state: 70,296
Other state: 19,478
Northeast: 2,919
Midwest: 5,288
South: 7,405
West: 3,866
90.9% of Fairfield residents lived in the same house 1 years ago. Out of people who lived in different houses, 31.4% lived in this county. Out of people who lived in different counties, 83.5% lived in California.
Fairfield:
90.9%
State average:
88.9%
Education attainment for males 25 years and older:
No schooling: 1,112
Nursery to 4th grade: 0
5th and 6th grade: 1,061
7th and 8th grade: 1,014
9th grade: 292
10th grade: 478
11th grade: 853
12th grade, no diploma: 1,103
High school graduate (or equivalency): 9,205
Less than 1 year of college: 3,190
Some college more than 1 year, no degree: 6,314
Associate degree: 4,346
Bachelor's degree: 7,332
Master's degree: 1,949
Professional school degree: 533
Doctorate degree: 303
Education attainment for females 25 years and older:
No schooling: 1,800
Nursery to 4th grade: 493
5th and 6th grade: 212
7th and 8th grade: 585
9th grade: 669
10th grade: 208
11th grade: 363
12th grade, no diploma: 739
High school graduate (or equivalency): 8,483
Less than 1 year of college: 3,475
Some college more than 1 year, no degree: 6,097
Associate degree: 4,884
Bachelor's degree: 7,931
Master's degree: 2,627
Professional school degree: 261
Doctorate degree: 354
Housing units in structures:
One, detached: 28,835
One, attached: 1,738
Two: 570
3 or 4: 2,142
5 to 9: 1,167
10 to 19: 325
20 to 49: 827
50 or more: 3,156
Mobile homes: 944
Median worth of mobile homes: $175,900
Housing units lacking complete plumbing facilities in 2022: 0.3%
Housing units lacking complete kitchen facilities in 2022: 0.7%
House/condo owner moved in on average 10 years ago