Housing density: 634 houses/condos per square mile
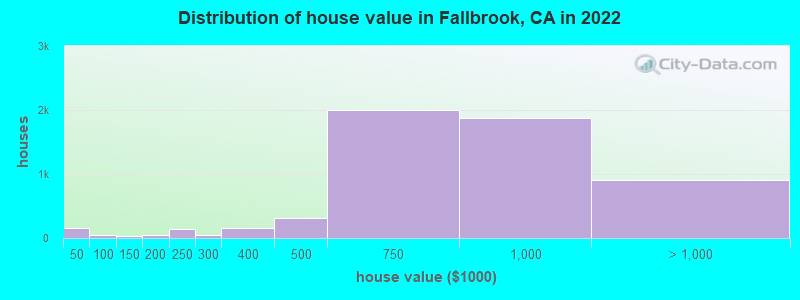
Median price asked for vacant for-sale houses and condos in 2022: $1,735,708.
Median contract rent in 2022: $1,452 (lower quartile is $1,207, upper quartile is $1,938)
Median rent asked for vacant for-rent units in 2022: $1,170
Median gross rent in Fallbrook, CA in 2022: $1,581
Housing units in Fallbrook with a mortgage: 4,338 (452 second mortgage, 54 home equity loan, 356 both second mortgage and home equity loan) Houses without a mortgage: 18
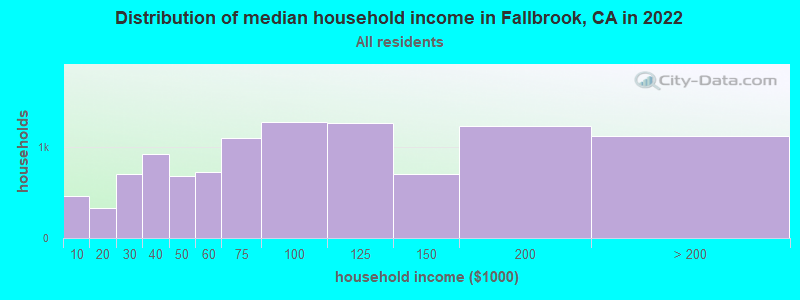
Median household income for houses/condos with a mortgage: $116,243
Median household income for apartments without a mortgage: $89,531
Size of family households: 3,137 2-persons, 1,354 3-persons, 1,814 4-persons, 1,057 5-persons, 475 6-persons, 342 7-or-more-persons.
Size of nonfamily households: 1,697 1-person, 568 2-persons, 27 3-persons.
4,856 married couples with children.
1,706 single-parent households (955 men, 751 women).
58.4% of residents of Fallbrook speak English at home.
38.4% of residents speak Spanish at home (63% speak English very well, 15% speak English well, 14% speak English not well, 9% don't speak English at all).
1.5% of residents speak other Indo-European language at home (70% speak English very well, 24% speak English well, 6% speak English not well).
1.0% of residents speak Asian or Pacific Island language at home (74% speak English very well, 14% speak English well, 2% speak English not well, 9% don't speak English at all).
0.1% of residents speak other language at home (63% speak English very well, 7% speak English well, 27% speak English not well, 3% don't speak English at all).
Foreign born population: 7,929 (23.6%)
(50.4% of them are naturalized citizens)
Percentage of workers working in this county: 91.0% Number of people working at home: 1,585 (10.9% of all workers)
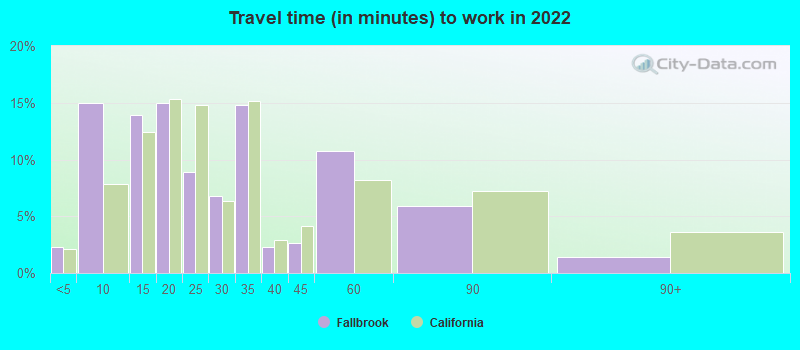
Travel time to work (commute)
Less than 5 minutes: 356
5 to 9 minutes: 1,162
10 to 14 minutes: 1,106
15 to 19 minutes: 1,122
20 to 24 minutes: 1,321
25 to 29 minutes: 581
30 to 34 minutes: 2,762
35 to 39 minutes: 506
40 to 44 minutes: 928
45 to 59 minutes: 1,342
60 to 89 minutes: 983
90 or more minutes: 343
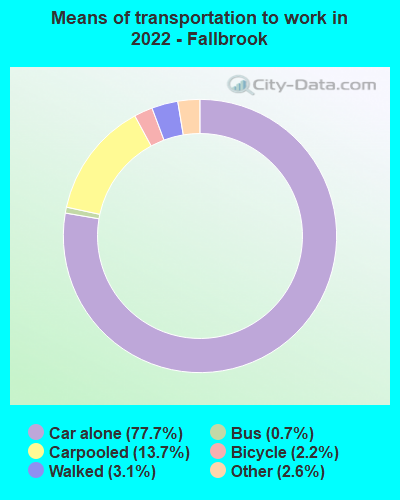
Means of transportation to work:
Drove a car alone: 6,205 (64.1%)
Carpooled: 1,147 (11.9%)
Bus: 53 (0.5%)
Taxi: 214 (2.2%)
Bicycle: 186 (1.9%)
Walked: 272 (2.8%)
Worked at home: 1,585 (16.4%)
Unemployment by race in 2022
Unemployment rate for White non-Hispanic residents
6.6%Males
5.4%Females
Unemployment rate for Black residents
2.1%Males
6.3%Females
Unemployment rate for American Indian and Alaska Native residents
1.0%Males
Unemployment rate for Asian residents
14.4%Females
Unemployment rate for other race residents
3.9%Males
2.2%Females
Unemployment rate for two or more race residents
8.9%Males
7.1%Females
Unemployment rate for Hispanic or Latino residents
5.4%Males
4.4%Females
Year of entry for the foreign-born population in Fallbrook, California
1,6272010 or later
2,0172000 to 2009
1,7541990 to 1999
2,1691980 to 1989
9391970 to 1979
884Before 1970
First ancestries reported:
German: 563 (3.0%)
English: 563 (3.0%)
American: 526 (2.8%)
Irish: 495 (2.6%)
Italian: 418 (2.2%)
Norwegian: 282 (1.5%)
Scottish: 195 (1.0%)
Polish: 194 (1.0%)
European: 178 (0.9%)
Croatian: 116 (0.6%)
French: 112 (0.6%)
Dutch: 90 (0.5%)
Russian: 78 (0.4%)
Swedish: 77 (0.4%)
Iranian: 71 (0.4%)
British: 70 (0.4%)
Brazilian: 60 (0.3%)
Jamaican: 52 (0.3%)
Northern European: 45 (0.2%)
Scotch-Irish: 43 (0.2%)
Welsh: 43 (0.2%)
Ukrainian: 34 (0.2%)
Romanian: 33 (0.2%)
Canadian: 30 (0.2%)
Eastern European: 25 (0.1%)
Czechoslovakian: 25 (0.1%)
Scandinavian: 23 (0.1%)
Lithuanian: 20 (0.1%)
Hungarian: 16 (0.08%)
Danish: 14 (0.07%)
Basque: 14 (0.07%)
Afghan: 14 (0.07%)
French Canadian: 13 (0.07%)
Kenyan: 13 (0.07%)
Greek: 13 (0.07%)
Iraqi: 11 (0.06%)
Czech: 11 (0.06%)
Belgian: 10 (0.05%)
Serbian: 9 (0.05%)
Swiss: 9 (0.05%)
Portuguese: 7 (0.04%)
Austrian: 6 (0.03%)
African: 6 (0.03%)
Estonian: 5 (0.03%)
Slovene: 4 (0.02%)
Armenian: 3 (0.02%)
Most common places of birth for foreign-born residents (%):
Mexico
Fallbrook:
67.6% (5,360)
California:
37.2% (3,881,193)
Guatemala
Fallbrook:
13.8% (1,091)
California:
2.8% (290,436)
Philippines
Fallbrook:
2.0% (156)
California:
7.8% (818,297)
Canada
Fallbrook:
1.8% (141)
California:
1.2% (127,477)
Place of birth for U.S.-born residents:
This state: 18,446
Other state: 6,913
Northeast: 1,504
Midwest: 1,805
South: 2,086
West: 1,515
90.1% of Fallbrook residents lived in the same house 1 years ago. Out of people who lived in different houses, 37.9% lived in this county. Out of people who lived in different counties, 71.5% lived in California.
Fallbrook:
90.1%
State average:
88.9%
Education attainment for males 25 years and older:
No schooling: 540
Nursery to 4th grade: 80
5th and 6th grade: 332
7th and 8th grade: 177
9th grade: 51
10th grade: 175
11th grade: 73
12th grade, no diploma: 282
High school graduate (or equivalency): 2,728
Less than 1 year of college: 668
Some college more than 1 year, no degree: 1,728
Associate degree: 610
Bachelor's degree: 2,052
Master's degree: 595
Professional school degree: 264
Doctorate degree: 111
Education attainment for females 25 years and older:
No schooling: 317
Nursery to 4th grade: 115
5th and 6th grade: 388
7th and 8th grade: 119
9th grade: 112
10th grade: 161
11th grade: 106
12th grade, no diploma: 115
High school graduate (or equivalency): 2,753
Less than 1 year of college: 825
Some college more than 1 year, no degree: 1,805
Associate degree: 814
Bachelor's degree: 1,848
Master's degree: 951
Professional school degree: 164
Doctorate degree: 159
Housing units in structures:
One, detached: 7,043
One, attached: 383
Two: 212
3 or 4: 359
5 to 9: 592
10 to 19: 762
20 to 49: 571
50 or more: 568
Mobile homes: 606
Housing units lacking complete plumbing facilities in 2022: 0.4%
Housing units lacking complete kitchen facilities in 2022: 1.3%
House/condo owner moved in on average 14 years ago