Farmer City, IL (Illinois) Houses and Residents
| Farmer City: | $133,429 |
| Illinois: | $251,600 |
Mean price in 2022:
Detached houses: $136,974
Here: $136,974 State: $310,164 Mobile homes: $93,133
Here: $93,133 State: $78,855
Total population: 2,005 (Urban population: 0, Rural population: 2,069 (all nonfarm))
Houses: 852 (765 occupied: 647 owner occupied, 128 renter occupied)
| % of renters here: | 17% |
| State: | 33% |
Housing density: 370 houses/condos per square mile
Median price asked for vacant for-sale houses and condos in 2022: $234,544.
Median contract rent in 2022: $677
Median rent asked for vacant for-rent units in 2022: $612
Median gross rent in Farmer City, IL in 2022: $924
Housing units in Farmer City with a mortgage: 341 (39 second mortgage, 0 home equity loan, 39 both second mortgage and home equity loan)
Houses without a mortgage: 6
Median household income for houses/condos with a mortgage: $93,779
Median household income for apartments without a mortgage: $46,080
Median monthly housing costs: $817
Compare current foreclosures near Farmer City, IL:
| Photo | Address | Area | Beds / Baths | Price | Details |
|---|---|---|---|---|---|

|
#1
W Clinton Ave
Farmer City, IL 61842
|
1,180 sq. feet
|
1 baths 5 beds |
show details | |

|
#2
1/2 N Main St, Lot 2
Farmer City, IL 61842
|
- sq. feet
|
- baths - beds |
show details | |

|
#3
N William St Apt 3
Farmer City, IL 61842
|
- sq. feet
|
- baths - beds |
show details | |

|
#4
Maple St
Weldon, IL 61882
|
879 sq. feet
|
1 baths 2 beds |
show details | |

|
#5
Autumn Rd
Wapella, IL 61777
|
1,973 sq. feet
|
3 baths 4 beds |
show details | |

|
#6
S Hemlock St
Le Roy, IL 61752
|
528 sq. feet
|
1 baths - beds |
show details | |

|
#7
Allen St
Le Roy, IL 61752
|
1,104 sq. feet
|
1 baths - beds |
show details | |

|
#8
W Elm St
Le Roy, IL 61752
|
864 sq. feet
|
2 baths - beds |
show details | |

|
#9
Meadow Lane St
Le Roy, IL 61752
|
948 sq. feet
|
1 baths - beds |
show details | |

|
#10
County Road O E
Mahomet, IL 61853
|
- sq. feet
|
- baths - beds |
show details |
| Photo | Address | Area | Beds / Baths | Price | Details |
|---|---|---|---|---|---|

|
#11
Pheasant Ridge Rd
Mahomet, IL 61853
|
- sq. feet
|
- baths - beds |
show details | |

|
#12
Macon St
Mahomet, IL 61853
|
- sq. feet
|
- baths - beds |
show details | |

|
#13
Jennifer Dr # A
Mahomet, IL 61853
|
- sq. feet
|
- baths - beds |
show details | |

|
#14
W South St
Ellsworth, IL 61737
|
- sq. feet
|
- baths - beds |
show details | |

|
#15
E Franklin St
Mahomet, IL 61853
|
- sq. feet
|
- baths - beds |
show details | |

|
#16
Feather Ln
Saybrook, IL 61770
|
- sq. feet
|
- baths - beds |
show details | |

|
#17
N 1225 East Rd
Monticello, IL 61856
|
- sq. feet
|
- baths - beds |
show details | |

|
#18
North St
Fisher, IL 61843
|
- sq. feet
|
- baths - beds |
show details | |

|
#19
W William St
Monticello, IL 61856
|
- sq. feet
|
- baths - beds |
show details | |

|
#20
S Garden Ct
Mahomet, IL 61853
|
- sq. feet
|
- baths - beds |
show details |
| Photo | Address | Area | Beds / Baths | Price | Details |
|---|---|---|---|---|---|

|
#21
Riverwood Pt
Mahomet, IL 61853
|
- sq. feet
|
- baths - beds |
show details | |

|
#22
S Center St
Mahomet, IL 61853
|
- sq. feet
|
- baths - beds |
show details | |

|
#23
N Main St
Mansfield, IL 61854
|
- sq. feet
|
- baths - beds |
show details | |

|
#24
Hilltop Ct
Mahomet, IL 61853
|
- sq. feet
|
- baths - beds |
show details | |

|
#25
N 1450 East Rd
White Heath, IL 61884
|
- sq. feet
|
- baths - beds |
show details | |

|
#26
E Cedar St
Le Roy, IL 61752
|
- sq. feet
|
- baths - beds |
show details | |

|
#27
W Oak St
Mahomet, IL 61853
|
- sq. feet
|
- baths - beds |
show details | |

|
Check over 1 million property listings on Foreclosure.com!
|
browse all offers | |||


 | Bloomington Illinois sitting in a bowl? (40 replies) |
| To live between Bloomington and Champaign? (18 replies) |

Median year apartment built: 1978
Household type by relationship:
Households: 1,835- Male householders: 329 (131 living alone), Female householders: 422 (161 living alone)
391 spouses (391 opposite-sex spouses), 57 unmarried partners, (57 opposite-sex unmarried partners), 548 children (513 natural, 0 adopted, 34 stepchildren), 19 grandchildren, 0 brothers or sisters, 0 parents, 0 foster children, 7 other relatives, 9 non-relatives
- In group quarters: 49
Size of family households: 229 2-persons, 81 3-persons, 82 4-persons, 22 5-persons, 24 6-persons.
Size of nonfamily households: 308 1-person, 29 2-persons.
305 married couples with children.
67 single-parent households (0 men, 67 women).
97.0% of residents of Farmer City speak English at home.
2.0% of residents speak Spanish at home (100% speak English very well).
0.5% of residents speak Asian or Pacific Island language at home (100% speak English well).
Foreign born population: 9 (0.5%)
(100.0% of them are naturalized citizens)
| Here: | 6.8 |
| State: | 6.4 |
| Here: | 5.5 |
| State: | 4.1 |

- Bedrooms in owner-occupied houses and condos in Farmer City, Illinois
- 6no bedroom
- 131 bedroom
- 1872 bedrooms
- 2513 bedrooms
- 1894 bedrooms
- 05+ bedrooms

- Bedrooms in renter-occupied apartments in Farmer City, Illinois
- 0no bedroom
- 351 bedroom
- 312 bedrooms
- 633 bedrooms
- 04 bedrooms
- 05+ bedrooms

- Cars and other vehicles available in Farmer City in owner-occupied houses/condos
- 12no vehicle
- 2161 vehicle
- 2872 vehicles
- 563 vehicles
- 464 vehicles
- 315+ vehicles

- Cars and other vehicles available in Farmer City in renter-occupied apartments
- 5no vehicle
- 791 vehicle
- 362 vehicles
- 83 vehicles
- 04 vehicles
- 05+ vehicles

- Rooms in owner-occupied houses in Farmer City, Illinois
- 01 room
- 02 rooms
- 93 rooms
- 514 rooms
- 715 rooms
- 1516 rooms
- 1407 rooms
- 1248 rooms
- 1019+ rooms

- Rooms in renter-occupied apartments in Farmer City, Illinois
- 01 room
- 252 rooms
- 43 rooms
- 254 rooms
- 05 rooms
- 626 rooms
- 57 rooms
- 08 rooms
- 69+ rooms


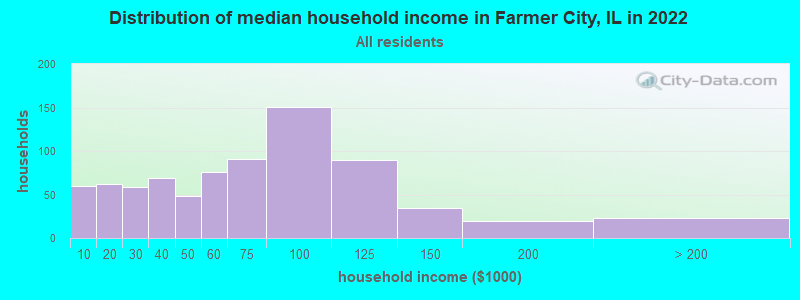
Farmer City, IL household income distribution

- 60Less than $10,000
- 62$10,000 to $19,999
- 59$20,000 to $29,999
- 69$30,000 to $39,999
- 48$40,000 to $49,999
- 76$50,000 to $59,999
- 91$60,000 to $74,999
- 151$75,000 to $99,999
- 90$100,000 to $124,999
- 34$125,000 to $149,999
- 20$150,000 to $199,999
- 23$200,000 or more
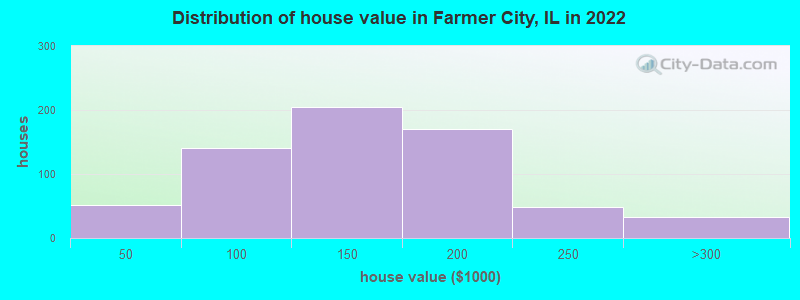
Home value of owner - occupied houses in 2022 in Farmer City, IL
-
- 7Less than $10,000
- 5$15,000 to $19,999
- 3$30,000 to $34,999
- 34$40,000 to $49,999
- 7$50,000 to $59,999
- 39$70,000 to $79,999
- 22$80,000 to $89,999
- 35$90,000 to $99,999
- 140$100,000 to $124,999
- 62$125,000 to $149,999
- 124$150,000 to $174,999
- 45$175,000 to $199,999
- 49$200,000 to $249,999
- 33$250,000 to $299,999
Rent paid by renters in 2022 in Farmer City, IL
-
- 4$100 to $149
- 31$150 to $199
- 11$350 to $399
- 19$650 to $699
- 6$750 to $799
- 29$800 to $899
- 18$1,000 to $1,249
- 13No cash rent


Percentage of workers working in this county: 37.4%
Number of people working at home: 41 (4.3% of all workers)
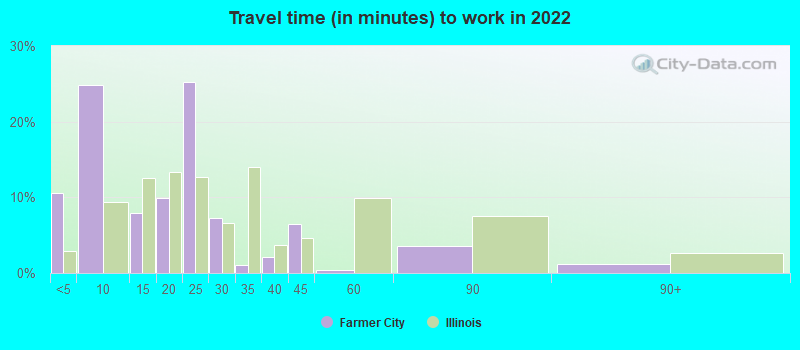
Travel time to work (commute)
- Less than 5 minutes: 75
- 5 to 9 minutes: 169
- 10 to 14 minutes: 76
- 15 to 19 minutes: 47
- 20 to 24 minutes: 68
- 25 to 29 minutes: 219
- 30 to 34 minutes: 137
- 35 to 39 minutes: 25
- 40 to 44 minutes: 7
- 45 to 59 minutes: 26
- 60 to 89 minutes: 13
- 90 or more minutes: 14
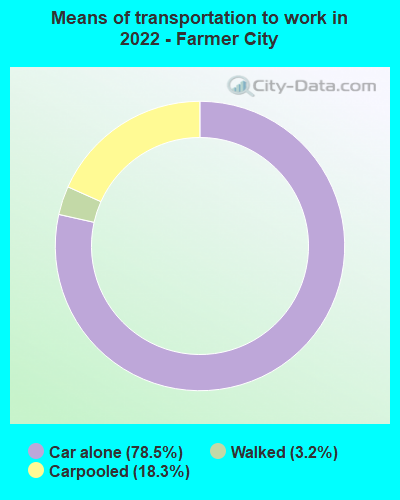
Means of transportation to work:
- Drove a car alone: 407 (71.4%)
- Carpooled: 101 (17.7%)
- Walked: 16 (2.8%)
- Worked at home: 41 (7.2%)

- Unemployment by race in 2022
- Unemployment rate for White non-Hispanic residents
- 7.9%Males
- 0.9%Females

- Year of entry for the foreign-born population in Farmer City, Illinois
- 02010 or later
- 02000 to 2009
- 01990 to 1999
- 01980 to 1989
- 31970 to 1979
- 4Before 1970

First ancestries reported:
- German: 167 (28.7%)
- American: 161 (27.7%)
- English: 80 (13.8%)
- Irish: 44 (7.6%)
- European: 22 (3.8%)
- Dutch: 18 (3.1%)
- British: 13 (2.2%)
- Italian: 10 (1.7%)
- French: 7 (1.2%)
- Scottish: 7 (1.2%)
- Pennsylvania German: 4 (0.7%)
Most common places of birth for foreign-born residents (%):
| Farmer City: | 100.0% (9) |
| Illinois: | 0.5% (8,235) |
Place of birth for U.S.-born residents:
- This state: 1,315
- Other state: 506
- Northeast: 14
- Midwest: 180
- South: 209
- West: 98
93.3% of Farmer City residents lived in the same house 1 years ago.
Out of people who lived in different houses, 9.0% lived in this county.
Out of people who lived in different counties, 96.5% lived in Illinois.
| Farmer City: | 93.3% |
| State average: | 88.3% |
Education attainment for males 25 years and older:
- No schooling: 0
- Nursery to 4th grade: 0
- 5th and 6th grade: 0
- 7th and 8th grade: 0
- 9th grade: 0
- 10th grade: 9
- 11th grade: 34
- 12th grade, no diploma: 26
- High school graduate (or equivalency): 318
- Less than 1 year of college: 65
- Some college more than 1 year, no degree: 90
- Associate degree: 46
- Bachelor's degree: 44
- Master's degree: 35
- Professional school degree: 0
- Doctorate degree: 0

Education attainment for females 25 years and older:
- No schooling: 0
- Nursery to 4th grade: 0
- 5th and 6th grade: 0
- 7th and 8th grade: 13
- 9th grade: 0
- 10th grade: 14
- 11th grade: 0
- 12th grade, no diploma: 0
- High school graduate (or equivalency): 188
- Less than 1 year of college: 125
- Some college more than 1 year, no degree: 82
- Associate degree: 93
- Bachelor's degree: 80
- Master's degree: 41
- Professional school degree: 0
- Doctorate degree: 0


Housing units in structures:
- One, detached: 718
- One, attached: 6
- 3 or 4: 23
- 5 to 9: 6
- 20 to 49: 4
- Mobile homes: 95
Housing units lacking complete kitchen facilities in 2022: 1.1%
House/condo owner moved in on average 10 years ago
Renter moved in on average 2 years ago

Private vs. public school enrollment:
| Here: | 20.8% |
| Illinois: | 13.3% |
| Here: | 35.3% |
| Illinois: | 9.9% |
| Here: | 65.2% |
| Illinois: | 27.4% |


