Farmington, NM (New Mexico) Houses and Residents
Estimated median house or condo value in 2022: $237,671 (it was $92,200 in 2000 )
Farmington:
$237,671New Mexico:
$243,100
Lower value quartile - upper value quartile: $157,590 - $310,910Total population: 44,445 (Urban population: 36,515, Rural population: 1,097 (all nonfarm) )
Houses: 17,759 (15,914 occupied: 10,105 owner occupied, 5,952 renter occupied )
% of renters here:
37%State:
29%
Housing density: 668 houses/condos per square mile
Median price asked for vacant for-sale houses and condos in 2022: $246,176.
Median contract rent in 2022: $726 (lower quartile is $617, upper quartile is $907)
Median rent asked for vacant for-rent units in 2022: $959
Median gross rent in Farmington, NM in 2022: $953
Housing units in Farmington with a mortgage: 6,647 (329 second mortgage, 0 home equity loan, 238 both second mortgage and home equity loan )Houses without a mortgage: 33
Median household income for houses/condos with a mortgage: $86,938
Median household income for apartments without a mortgage: $47,515
Median monthly housing costs: $1,007
Data:
Median house or condo value ($)
Median house or condo value ($ change since 2000)
Median house or condo value ($) - White
Median house or condo value ($) - Black or African American
Median house or condo value ($) - Asian
Median house or condo value ($) - Hispanic or Latino
Median house or condo value ($) - American Indian and Alaska Native
Median house or condo value ($) - Multirace
Median house or condo value ($) - Other Race
Median price asked for mobile homes ($)
Household density (households per square mile)
Mean house or condo value by units in structure - 1, detached ($)
Mean house or condo value by units in structure - 1, attached ($)
Mean house or condo value by units in structure - 2 ($)
Mean house or condo value by units in structure by units in structure - 3 or 4 ($)
Mean house or condo value by units in structure - 5 or more ($)
Mean house or condo value by units in structure - Boat, RV, van, etc. ($)
Mean house or condo value by units in structure - Mobile home ($)
Median contract rent ($)
Median contract rent - Lower quartile ($)
Median contract rent - Upper quartile ($)
Median gross rent ($)
Urban houses (%)
Rural houses (%)
Houses occupied (%)
Houses occupied (% change since 2000)
Houses owner occupied (%)
Houses owner occupied (% change since 2000)
Houses renter occupied (%)
Houses renter occupied (% change since 2000)
Vacant housing units - For rent (%)
Vacant housing units - For rent (% change since 2000)
Vacant housing units - For sale only (%)
Vacant housing units - For sale only (% change since 2000)
Vacant housing units - Rented or sold, not occupied (%)
Vacant housing units - Rented or sold, not occupied (% change since 2000)
Vacant housing units - For seasonal, recreational, or occasional use (%)
Vacant housing units - For seasonal, recreational, or occasional use (% change since 2000)
Vacant housing units - For migrant workers (%)
Vacant housing units - For migrant workers (% change since 2000)
Vacant housing units - Other vacant (%)
Vacant housing units - Other vacant (% change since 2000)
Median monthly housing costs ($)
Median household income for houses/condos with a mortgage ($)
Median household income for houses/condos without a mortgage ($)
Median household income ($)
Median household income ($) - White
Median household income ($) - Black or African American
Median household income ($) - Asian
Median household income ($) - Hispanic or Latino
Median household income ($) - American Indian and Alaska Native
Median household income ($) - Multirace
Median household income ($) - Other Race
Mortgage status - with mortgage (%)
Mortgage status - with second mortgage (%)
Mortgage status - with home equity loan (%)
Mortgage status - with both second mortgage and home equity loan (%)
Mortgage status - without a mortgage (%)
Median year house/condo built
Median year apartment built
Household type by relationship - Male householder living alone (%)
Household type by relationship - Male householder not living alone (%)
Household type by relationship - Female householder living alone (%)
Household type by relationship - Female householder not living alone (%)
Household type by relationship - Opposite-Sex spouse (%)
Household type by relationship - Same-Sex spouse (%)
Household type by relationship - Opposite-Sex unmarried partner (%)
Household type by relationship - Same-Sex unmarried partner (%)
Household type by relationship - In group quarters (%)
Size of family households - 2-person household (%)
Size of family households - 3-person household (%)
Size of family households - 4-person household (%)
Size of family households - 5-person household (%)
Size of family households - 6-person household (%)
Size of family households - 7-or-more-person household (%)
Size of nonfamily households - 1-person household (%)
Size of nonfamily households - 2-person household (%)
Size of nonfamily households - 3-person household (%)
Size of nonfamily households - 4-person household (%)
Size of nonfamily households - 5-person household (%)
Size of nonfamily households - 6-person household (%)
Size of nonfamily households - 7-or-moreperson household (%)
Year house built - Built 2010 or later (%)
Year house built - Built 2000 to 2009 (%)
Year house built - Built 1990 to 1999 (%)
Year house built - Built 1980 to 1989 (%)
Year house built - Built 1970 to 1979 (%)
Year house built - Built 1960 to 1969 (%)
Year house built - Built 1950 to 1959 (%)
Year house built - Built 1940 to 1949 (%)
Year house built - Built 1939 or earlier (%)
Median number of rooms in houses and condos
Median number of rooms in apartments
Median number of bedrooms in owner occupied houses
Mean number of bedrooms in owner occupied houses
Median number of bedrooms in renter occupied houses
Mean number of bedrooms in renter occupied houses
Median number of vehichles in owner occupied houses
Mean number of vehichles in owner occupied houses
Median number of vehichles in renter occupied houses
Mean number of vehichles in renter occupied houses
Rooms in owner-occupied houses - 1 room (%)
Rooms in owner-occupied houses - 2 rooms (%)
Rooms in owner-occupied houses - 3 rooms (%)
Rooms in owner-occupied houses - 4 rooms (%)
Rooms in owner-occupied houses - 5 rooms (%)
Rooms in owner-occupied houses - 6 rooms (%)
Rooms in owner-occupied houses - 7 rooms (%)
Rooms in owner-occupied houses - 8 rooms (%)
Rooms in owner-occupied houses - 9+ rooms (%)
Rooms in renter-occupied houses - 1 room (%)
Rooms in renter-occupied houses - 2 rooms (%)
Rooms in renter-occupied houses - 3 rooms (%)
Rooms in renter-occupied houses - 4 rooms (%)
Rooms in renter-occupied houses - 5 rooms (%)
Rooms in renter-occupied houses - 6 rooms (%)
Rooms in renter-occupied houses - 7 rooms (%)
Rooms in renter-occupied houses - 8 rooms (%)
Rooms in renter-occupied houses - 9+ rooms (%)
Bedrooms in owner-occupied houses - no bedrooms (%)
Bedrooms in owner-occupied houses - 1 bedroom (%)
Bedrooms in owner-occupied houses - 2 bedrooms (%)
Bedrooms in owner-occupied houses - 3 bedrooms (%)
Bedrooms in owner-occupied houses - 4 bedrooms (%)
Bedrooms in owner-occupied houses - 5+ bedrooms (%)
Bedrooms in renter-occupied houses - no bedrooms (%)
Bedrooms in renter-occupied houses - 1 bedroom (%)
Bedrooms in renter-occupied houses - 2 bedrooms (%)
Bedrooms in renter-occupied houses - 3 bedrooms (%)
Bedrooms in renter-occupied houses - 4 bedrooms (%)
Bedrooms in renter-occupied houses - 5+ bedrooms (%)
Vehicles available in owner-occupied houses - no vehicle available (%)
Vehicles available in owner-occupied houses - 1 vehicle available(%)
Vehicles available in owner-occupied houses - 2 Vehicles available (%)
Vehicles available in owner-occupied houses - 3 Vehicles available (%)
Vehicles available in owner-occupied houses - 4 Vehicles available (%)
Vehicles available in owner-occupied houses - 5+ Vehicles available (%)
Vehicles available in renter-occupied houses - no vehicle available (%)
Vehicles available in renter-occupied houses - 1 vehicle available (%)
Vehicles available in renter-occupied houses - 2 Vehicles available (%)
Vehicles available in renter-occupied houses - 3 Vehicles available (%)
Vehicles available in renter-occupied houses - 4 Vehicles available (%)
Vehicles available in renter-occupied houses - 5+ Vehicles available (%)
Housing units in structures - 1, detached (%)
Housing units in structures - 1, attached (%)
Housing units in structures - 2 (%)
Housing units in structures - 3 or 4 (%)
Housing units in structures - 5 to 9 (%)
Housing units in structures - 10 to 19 (%)
Housing units in structures - 20 to 49 (%)
Housing units in structures - 50 or more (%)
Housing units in structures - Mobile home (%)
Housing units in structures - Boat, RV, van, etc. (%)
Housing units in structures - Owners - 1, detached (%)
Housing units in structures - Owners - 1, attached (%)
Housing units in structures - Owners - 2 (%)
Housing units in structures - Owners - 3 or 4 (%)
Housing units in structures - Owners - 5 to 9 (%)
Housing units in structures - Owners - 10 to 19 (%)
Housing units in structures - Owners - 20 to 49 (%)
Housing units in structures - Owners - 50 or more (%)
Housing units in structures - Owners - Mobile home (%)
Housing units in structures - Owners - Boat, RV, van, etc. (%)
Housing units in structures - Renters - 1, detached (%)
Housing units in structures - Renters - 1, attached (%)
Housing units in structures - Renters - 2 (%)
Housing units in structures - Renters - 3 or 4 (%)
Housing units in structures - Renters - 5 to 9 (%)
Housing units in structures - Renters - 10 to 19 (%)
Housing units in structures - Renters - 20 to 49 (%)
Housing units in structures - Renters - 50 or more (%)
Housing units in structures - Renters - Mobile home (%)
Housing units in structures - Renters - Boat, RV, van, etc. (%)
House/condo owner moved in on average (years ago)
Renter moved in on average (years ago)
Year householder moved into unit - Moved in 1999 to March 2000 (%)
Year householder moved into unit - Moved in 1999 to March 2000 (%) - White
Year householder moved into unit - Moved in 1999 to March 2000 (%) - Black or African American
Year householder moved into unit - Moved in 1999 to March 2000 (%) - Asian
Year householder moved into unit - Moved in 1999 to March 2000 (%) - Hispanic or Latino
Year householder moved into unit - Moved in 1999 to March 2000 (%) - American Indian and Alaska Native
Year householder moved into unit - Moved in 1999 to March 2000 (%) - Multirace
Year householder moved into unit - Moved in 1999 to March 2000 (%) - Other Race
Year householder moved into unit - Moved in 1995 to 1998 (%)
Year householder moved into unit - Moved in 1995 to 1998 (%) - White
Year householder moved into unit - Moved in 1995 to 1998 (%) - Black or African American
Year householder moved into unit - Moved in 1995 to 1998 (%) - Asian
Year householder moved into unit - Moved in 1995 to 1998 (%) - Hispanic or Latino
Year householder moved into unit - Moved in 1995 to 1998 (%) - American Indian and Alaska Native
Year householder moved into unit - Moved in 1995 to 1998 (%) - Multirace
Year householder moved into unit - Moved in 1995 to 1998 (%) - Other Race
Year householder moved into unit - Moved in 1990 to 1994 (%)
Year householder moved into unit - Moved in 1990 to 1994 (%) - White
Year householder moved into unit - Moved in 1990 to 1994 (%) - Black or African American
Year householder moved into unit - Moved in 1990 to 1994 (%) - Asian
Year householder moved into unit - Moved in 1990 to 1994 (%) - Hispanic or Latino
Year householder moved into unit - Moved in 1990 to 1994 (%) - American Indian and Alaska Native
Year householder moved into unit - Moved in 1990 to 1994 (%) - Multirace
Year householder moved into unit - Moved in 1990 to 1994 (%) - Other Race
Year householder moved into unit - Moved in 1980 to 1989 (%)
Year householder moved into unit - Moved in 1980 to 1989 (%) - White
Year householder moved into unit - Moved in 1980 to 1989 (%) - Black or African American
Year householder moved into unit - Moved in 1980 to 1989 (%) - Asian
Year householder moved into unit - Moved in 1980 to 1989 (%) - Hispanic or Latino
Year householder moved into unit - Moved in 1980 to 1989 (%) - American Indian and Alaska Native
Year householder moved into unit - Moved in 1980 to 1989 (%) - Multirace
Year householder moved into unit - Moved in 1980 to 1989 (%) - Other Race
Year householder moved into unit - Moved in 1970 to 1979 (%)
Year householder moved into unit - Moved in 1970 to 1979 (%) - White
Year householder moved into unit - Moved in 1970 to 1979 (%) - Black or African American
Year householder moved into unit - Moved in 1970 to 1979 (%) - Asian
Year householder moved into unit - Moved in 1970 to 1979 (%) - Hispanic or Latino
Year householder moved into unit - Moved in 1970 to 1979 (%) - American Indian and Alaska Native
Year householder moved into unit - Moved in 1970 to 1979 (%) - Multirace
Year householder moved into unit - Moved in 1970 to 1979 (%) - Other Race
Year householder moved into unit - Moved in 1969 or earlier (%)
Year householder moved into unit - Moved in 1969 or earlier (%) - White
Year householder moved into unit - Moved in 1969 or earlier (%) - Black or African American
Year householder moved into unit - Moved in 1969 or earlier (%) - Asian
Year householder moved into unit - Moved in 1969 or earlier (%) - Hispanic or Latino
Year householder moved into unit - Moved in 1969 or earlier (%) - American Indian and Alaska Native
Year householder moved into unit - Moved in 1969 or earlier (%) - Multirace
Year householder moved into unit - Moved in 1969 or earlier (%) - Other Race
Housing units lacking complete plumbing facilities (%)
Housing units lacking complete kitchen facilities (%)
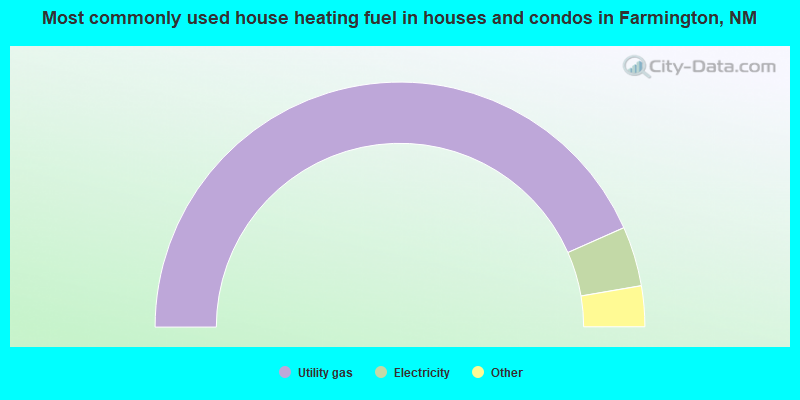
House heating fuel used in houses and condos - Utility gas (%)
House heating fuel used in houses and condos - Bottled, tank, or LP gas (%)
House heating fuel used in houses and condos - Electricity (%)
House heating fuel used in houses and condos - Fuel oil, kerosene, etc. (%)
House heating fuel used in houses and condos - Coal or coke (%)
House heating fuel used in houses and condos - Wood (%)
House heating fuel used in houses and condos - Solar energy (%)
House heating fuel used in houses and condos - Other fuel (%)
House heating fuel used in houses and condos - No fuel used (%)
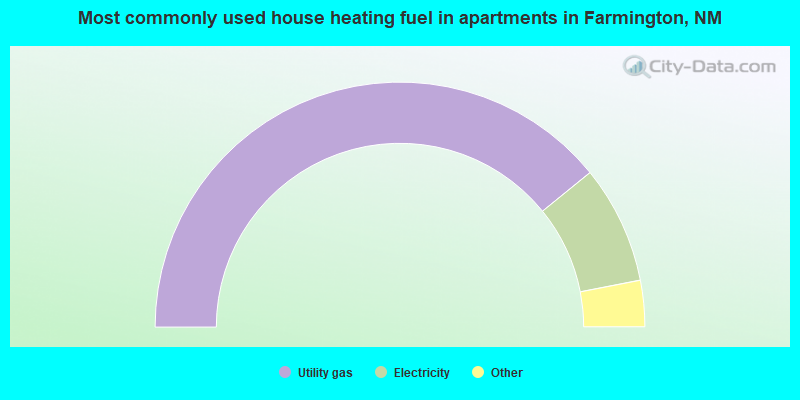
House heating fuel used in apartments - Utility gas (%)
House heating fuel used in apartments - Bottled, tank, or LP gas (%)
House heating fuel used in apartments - Electricity (%)
House heating fuel used in apartments - Fuel oil, kerosene, etc. (%)
House heating fuel used in apartments - Coal or coke (%)
House heating fuel used in apartments - Wood (%)
House heating fuel used in apartments - Solar energy (%)
House heating fuel used in apartments - Other fuel (%)
House heating fuel used in apartments - No fuel used (%)
Latest news about housing in Farmington, NM collected exclusively by city-data.com from local newspapers, TV, and radio stations
Median year house/condo built: 1985Median year apartment built: 1975Household type by relationship:
Households: 45,930
Male householders: 7,496 (1,982 living alone ), Female householders: 8,192 (2,044 living alone )7,166 spouses (7,050 opposite-sex spouses ), 1,455 unmarried partners , (1,399 opposite-sex unmarried partners ), 14,974 children (13,443 natural , 461 adopted , 1,068 stepchildren ), 1,990 grandchildren , 451 brothers or sisters , 568 parents , 66 foster children , 970 other relatives , 1,218 non-relatives In group quarters: 1,380
Size of family households: 4,582 2-persons , 2,038 3-persons , 2,102 4-persons , 1,014 5-persons , 544 6-persons , 214 7-or-more-persons .
Size of nonfamily households: 4,769 1-person , 792 2-persons , 49 3-persons , 9 5-persons .
7,786 married couples with children. single-parent households (767 men , 2,643 women ).
79.1% of residents of Farmington speak English at home. of residents speak Spanish at home (67% speak English very well , 25% speak English well , 7% speak English not well , 1% don't speak English at all ).of residents speak other Indo-European language at home (71% speak English very well , 26% speak English well , 2% don't speak English at all ).of residents speak Asian or Pacific Island language at home (82% speak English very well , 6% speak English well , 13% speak English not well ).of residents speak other language at home (65% speak English very well , 30% speak English well , 5% speak English not well ).
Foreign born population: 1,631 (3.6%)of them are naturalized citizens )
Median number of rooms in houses and condos:
Median number of rooms in apartments
Owner-occupied Renter-occupied
Rooms in owner-occupied houses in Farmington, New Mexico
7 1 room 25 2 rooms 164 3 rooms 1,199 4 rooms 3,013 5 rooms 2,021 6 rooms 1,410 7 rooms 1,045 8 rooms 1,221 9+ rooms
Rooms in renter-occupied apartments in Farmington, New Mexico
579 1 room 277 2 rooms 710 3 rooms 1,859 4 rooms 1,405 5 rooms 628 6 rooms 254 7 rooms 163 8 rooms 77 9+ rooms
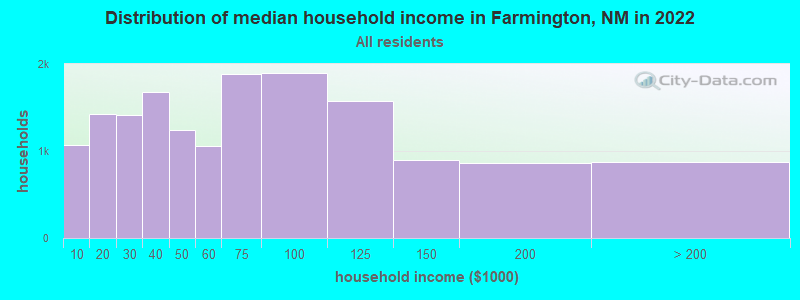
Farmington, NM household income distribution 1,067 Less than $10,0001,430 $10,000 to $19,9991,412 $20,000 to $29,9991,676 $30,000 to $39,9991,240 $40,000 to $49,9991,063 $50,000 to $59,9991,885 $60,000 to $74,9991,896 $75,000 to $99,9991,569 $100,000 to $124,999892 $125,000 to $149,999863 $150,000 to $199,999876 $200,000 or more
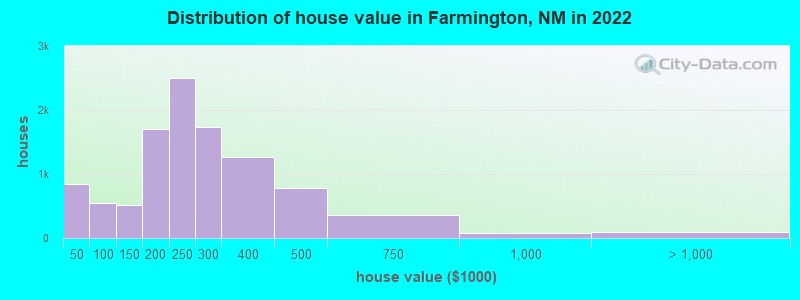
Home value of owner - occupied houses in 2022 in Farmington, NM 214 Less than $10,000164 $10,000 to $14,99995 $15,000 to $19,999181 $20,000 to $24,99976 $25,000 to $29,99939 $30,000 to $34,99912 $35,000 to $39,99964 $40,000 to $49,999148 $50,000 to $59,999166 $60,000 to $69,99972 $70,000 to $79,99947 $80,000 to $89,99950 $90,000 to $99,999165 $100,000 to $124,999352 $125,000 to $149,999726 $150,000 to $174,999980 $175,000 to $199,9992,500 $200,000 to $249,9991,727 $250,000 to $299,9991,265 $300,000 to $399,999777 $400,000 to $499,999361 $500,000 to $749,99983 $750,000 to $999,99977 $1,000,000 to $1,499,9997 $1,500,000 to $1,999,99912 $2,000,000 or moreRent paid by renters in 2022 in Farmington, NM 58 $150 to $19958 $200 to $24946 $250 to $29938 $300 to $34938 $350 to $399163 $400 to $449124 $450 to $499128 $500 to $549266 $550 to $599781 $600 to $649576 $650 to $699435 $700 to $749579 $750 to $799343 $800 to $899308 $900 to $999928 $1,000 to $1,249380 $1,250 to $1,499195 $1,500 to $1,99960 $2,000 to $2,49910 $3,500 or more305 No cash rent
Percentage of workers working in this county: 93.7%Number of people working at home: 1,035 (5.6% of all workers )
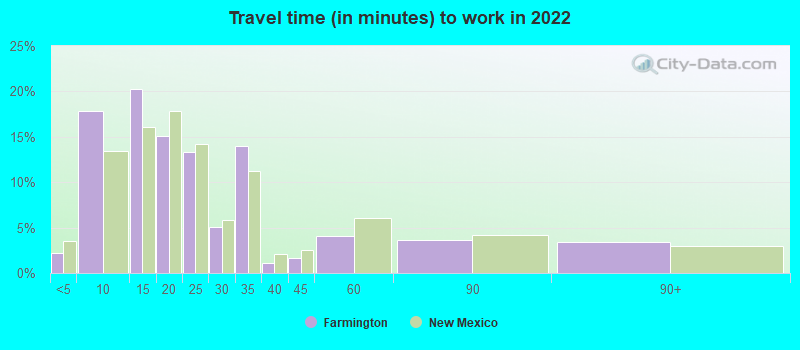
Travel time to work (commute)
Less than 5 minutes: 4985 to 9 minutes: 3,95810 to 14 minutes: 4,66815 to 19 minutes: 3,07920 to 24 minutes: 1,67325 to 29 minutes: 50730 to 34 minutes: 1,30435 to 39 minutes: 16840 to 44 minutes: 13045 to 59 minutes: 48660 to 89 minutes: 76390 or more minutes: 448
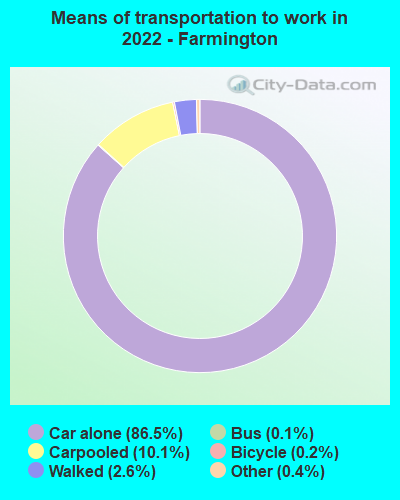
Means of transportation to work:
Drove a car alone: 20,354 (80.4%)Carpooled: 2,583 (10.2%)Bus : 31 (0.1%)Taxi: 100 (0.4%)Bicycle: 51 (0.2%)Walked: 694 (2.7%)Worked at home: 1,035 (4.1%)
Unemployment by race in 2022
Unemployment rate for White non-Hispanic residents 2.8% Males4.3% FemalesUnemployment rate for Black residents 93.9% FemalesUnemployment rate for American Indian and Alaska Native residents 5.5% Males11.7% FemalesUnemployment rate for Asian residents 18.0% FemalesUnemployment rate for other race residents 1.5% Males3.5% FemalesUnemployment rate for two or more race residents 6.2% Males5.9% FemalesUnemployment rate for Hispanic or Latino residents 11.3% Males3.6% Females
Year of entry for the foreign-born population in Farmington, New Mexico
307 2010 or later 648 2000 to 2009 156 1990 to 1999 370 1980 to 1989 203 1970 to 1979 146 Before 1970
First ancestries reported:
European: 1,450 (5.0%)
English: 1,127 (3.9%)
German: 964 (3.3%)
American: 880 (3.0%)
Irish: 761 (2.6%)
Scottish: 288 (1.0%)
Norwegian: 158 (0.5%)
Italian: 116 (0.4%)
French: 105 (0.4%)
Welsh: 96 (0.3%)
Dutch: 62 (0.2%)
Northern European: 56 (0.2%)
Swedish: 52 (0.2%)
Danish: 49 (0.2%)
Eastern European: 49 (0.2%)
Lithuanian: 40 (0.1%)
Polish: 37 (0.1%)
Basque: 32 (0.1%)
Scotch-Irish: 32 (0.1%)
Hungarian: 28 (0.10%)
Scandinavian: 26 (0.09%)
Austrian: 24 (0.08%)
Czech: 24 (0.08%)
Canadian: 23 (0.08%)
Turkish: 23 (0.08%)
Ukrainian: 22 (0.08%)
British: 20 (0.07%)
Belgian: 14 (0.05%)
Czechoslovakian: 14 (0.05%)
French Canadian: 14 (0.05%)
Russian: 13 (0.04%)
Finnish: 13 (0.04%)
Estonian: 12 (0.04%)
Portuguese: 11 (0.04%)
Greek: 10 (0.03%)
Yugoslavian: 10 (0.03%)
Pennsylvania German: 9 (0.03%)
Slovene: 8 (0.03%)
Swiss: 7 (0.02%)
Slovak: 4 (0.01%)
Iranian: 3 (0.01%) Most common places of birth for foreign-born residents (%): Mexico Farmington:
53.3% (733)New Mexico:
66.5% (129,316)
Philippines Farmington:
14.8% (204)New Mexico:
3.2% (6,181)
Pakistan Farmington:
7.6% (105)New Mexico:
0.3% (659)
Canada Farmington:
4.7% (65)New Mexico:
1.1% (2,195)
Spain Farmington:
3.1% (43)New Mexico:
0.3% (673)
Turkey Farmington:
1.7% (23)New Mexico:
0.2% (364)
Peru Farmington:
1.7% (23)New Mexico:
0.5% (934)
Place of birth for U.S.-born residents:
This state: 25,435Other state: 18,508Northeast: 389Midwest: 2,747South: 3,232West: 11,926 87.7% of Farmington residents lived in the same house 1 years ago.
Out of people who lived in different houses, 35.1% lived in this county.
Out of people who lived in different counties, 28.2% lived in New Mexico.
Farmington:
87.7%State average:
88.2%
Education attainment for males 25 years and older:
No schooling: 226Nursery to 4th grade: 475th and 6th grade: 977th and 8th grade: 589th grade: 17710th grade: 30511th grade: 31012th grade, no diploma: 396High school graduate (or equivalency): 3,950Less than 1 year of college: 1,137Some college more than 1 year, no degree: 2,577Associate degree: 1,805Bachelor's degree: 1,777Master's degree: 648Professional school degree: 521Doctorate degree: 232
Education attainment for females 25 years and older:
No schooling: 53Nursery to 4th grade: 215th and 6th grade: 777th and 8th grade: 1799th grade: 33310th grade: 36211th grade: 61312th grade, no diploma: 360High school graduate (or equivalency): 3,139Less than 1 year of college: 1,066Some college more than 1 year, no degree: 2,771Associate degree: 2,243Bachelor's degree: 1,782Master's degree: 1,276Professional school degree: 548Doctorate degree: 180
Housing units in structures:
One, detached: 10,768One, attached: 486Two: 4043 or 4: 1,5965 to 9: 56010 to 19: 34520 to 49: 27450 or more: 101Mobile homes: 3,138Boats, RVs, vans, etc.: 84Median worth of mobile homes: $22,546
Housing units lacking complete plumbing facilities in 2022: 1.9%Housing units lacking complete kitchen facilities in 2022: 1.7%House/condo owner moved in on average 11 years ago
Renter moved in on average 3 years ago
Private vs. public school enrollment:
Students in private schools in grades 1 to 8 (elementary and middle school): 525 Here:
8.5%New Mexico:
10.2%
Students in private schools in grades 9 to 12 (high school): 225 Here:
7.8%New Mexico:
10.0%
Students in private undergraduate colleges: 199 Here:
8.7%New Mexico:
12.3%