Fenwick Island, DE (Delaware) Houses and Residents
| Fenwick Island: | $1,376,375 |
| Delaware: | $337,200 |
Total population: 406 (Urban population: 310 (all inside urban clusters), Rural population: 33 (all nonfarm))
Houses: 814 (208 occupied: 203 owner occupied, 3 renter occupied)
| % of renters here: | 1% |
| State: | 26% |
Housing density: 2,367 houses/condos per square mile
Median price asked for vacant for-sale houses and condos in 2022 in this county: $381,009.
Median rent asked for vacant for-rent units in 2022: $3,880
Median gross rent in Fenwick Island, DE in 2022: $-668,961,559
Housing units in Fenwick Island with a mortgage: 83 (7 second mortgage, 0 home equity loan, 3 both second mortgage and home equity loan)
Houses without a mortgage: 3
Median household income for houses/condos with a mortgage: $175,682
Median household income for apartments without a mortgage: $114,911
Median monthly housing costs: $921
Compare current foreclosures near Fenwick Island, DE:
| Photo | Address | Area | Beds / Baths | Price | Details |
|---|---|---|---|---|---|

|
#1
W Torquay Rd
Ocean City, MD 21842
|
1,456 sq. feet
|
2 baths 3 beds |
$459,900
|
show details |

|
#2
Water Walk Way
Selbyville, DE 19975
|
5,000 sq. feet
|
- baths 3 beds |
show details | |

|
#3
Alyssa Dr
Dagsboro, DE 19939
|
1,614 sq. feet
|
- baths 3 beds |
show details | |

|
#4
Yacht Basin Rd
Ocean View, DE 19970
|
1,972 sq. feet
|
- baths 4 beds |
show details | |

|
#5
Grace St
Millsboro, DE 19966
|
2,255 sq. feet
|
- baths 3 beds |
show details | |

|
#6
White Pine Dr
Millsboro, DE 19966
|
1,080 sq. feet
|
- baths 3 beds |
show details | |

|
#7
Hickory Way
Berlin, MD 21811
|
864 sq. feet
|
2 baths - beds |
show details | |

|
#8
King Richard Rd
Berlin, MD 21811
|
1,804 sq. feet
|
2 baths - beds |
show details | |

|
#9
Gum Point Rd
Berlin, MD 21811
|
1,456 sq. feet
|
1 baths - beds |
show details | |

|
#10
Sinepuxent Rd
Berlin, MD 21811
|
2,355 sq. feet
|
2 baths - beds |
show details |
| Photo | Address | Area | Beds / Baths | Price | Details |
|---|---|---|---|---|---|

|
#11
Harwich Ct
Berlin, MD 21811
|
1,228 sq. feet
|
2 baths - beds |
show details | |

|
#12
Timbercreek Ln
Millsboro, DE 19966
|
2,115 sq. feet
|
- baths 3 beds |
show details | |

|
#13
John B Dr
Millsboro, DE 19966
|
1,874 sq. feet
|
- baths 3 beds |
show details | |

|
#14
Windswept Dr
Millsboro, DE 19966
|
1,894 sq. feet
|
- baths 3 beds |
show details | |

|
#15
Sylvia Dr
Millsboro, DE 19966
|
1,568 sq. feet
|
- baths 3 beds |
show details | |

|
#16
Saint Martins Rd
Berlin, MD 21811
|
1,344 sq. feet
|
1 baths - beds |
show details | |

|
#17
Graham Ave
Berlin, MD 21811
|
864 sq. feet
|
1 baths - beds |
show details | |

|
#18
Branch St
Berlin, MD 21811
|
1,392 sq. feet
|
2 baths - beds |
show details | |

|
#19
Clipper Dr
Millsboro, DE 19966
|
1,456 sq. feet
|
- baths 3 beds |
show details | |

|
#20
Liberty St
Berlin, MD 21811
|
1,832 sq. feet
|
2 baths - beds |
show details |
| Photo | Address | Area | Beds / Baths | Price | Details |
|---|---|---|---|---|---|

|
#21
N Dolly Cir
Berlin, MD 21811
|
2,808 sq. feet
|
3 baths - beds |
show details | |

|
#22
Betts Ave
Ocean View, DE 19970
|
2,886 sq. feet
|
- baths 3 beds |
show details | |

|
#23
Oliver Dr
Selbyville, DE 19975
|
2,216 sq. feet
|
- baths 3 beds |
show details | |

|
#24
Newport Bay Dr, Unit 229
Ocean City, MD 21842
|
1,384 sq. feet
|
2 baths - beds |
show details | |

|
#25
Kendall St
Millsboro, DE 19966
|
1,008 sq. feet
|
- baths 3 beds |
show details | |

|
#26
Jersey Rd
Millsboro, DE 19966
|
1,344 sq. feet
|
- baths 2 beds |
show details | |

|
#27
Pine Grove Ln
Ocean View, DE 19970
|
2,747 sq. feet
|
- baths 3 beds |
show details | |

|
#28
Hollyville Rd
Millsboro, DE 19966
|
1,792 sq. feet
|
- baths 3 beds |
show details | |

|
#29
Cromwell Dr
Ocean View, DE 19970
|
1,570 sq. feet
|
- baths 2 beds |
show details | |

|
#30
Arundel Ct
Lewes, DE 19958
|
- sq. feet
|
- baths - beds |
show details |
| Photo | Address | Area | Beds / Baths | Price | Details |
|---|---|---|---|---|---|

|
#31
Sandpiper Dr
Millsboro, DE 19966
|
1,680 sq. feet
|
- baths - beds |
show details | |

|
#32
D St
Rehoboth Beach, DE 19971
|
- sq. feet
|
- baths - beds |
show details | |

|
#33
Arnell Rd
Rehoboth Beach, DE 19971
|
- sq. feet
|
- baths - beds |
show details | |

|
#34
West St
Berlin, MD 21811
|
- sq. feet
|
- baths - beds |
show details | |

|
#35
Wells Ln
Millsboro, DE 19966
|
1,600 sq. feet
|
- baths - beds |
show details | |

|
#36
Gaston Drive
Millsboro, DE 19966
|
- sq. feet
|
- baths - beds |
show details | |

|
#37
Kent Dr
Millsboro, DE 19966
|
1,680 sq. feet
|
- baths - beds |
show details | |

|
#38
Jeannette Rd
Millsboro, DE 19966
|
- sq. feet
|
- baths - beds |
show details | |

|
#39
Old Salt Cv
Millsboro, DE 19966
|
- sq. feet
|
- baths - beds |
show details | |

|
#40
Turnstone Court
Millsboro, DE 19966
|
- sq. feet
|
- baths - beds |
show details |
| Photo | Address | Area | Beds / Baths | Price | Details |
|---|---|---|---|---|---|

|
#41
D St
Rehoboth Beach, DE 19971
|
- sq. feet
|
- baths - beds |
show details | |

|
#42
Riverside Plaza Dr, Unit 3101
Millsboro, DE 19966
|
- sq. feet
|
- baths - beds |
show details | |

|
#43
Dodd St
Millsboro, DE 19966
|
- sq. feet
|
- baths - beds |
show details | |

|
#44
Riverside Plaza Dr, Unit 5203
Millsboro, DE 19966
|
- sq. feet
|
- baths - beds |
show details | |

|
#45
Bobbys Branch Rd
Millsboro, DE 19966
|
- sq. feet
|
- baths - beds |
show details | |

|
#46
Saint Thomas Blvd
Millsboro, DE 19966
|
- sq. feet
|
- baths - beds |
show details | |

|
#47
Dania Dr
Millsboro, DE 19966
|
- sq. feet
|
- baths - beds |
show details | |

|
#48
Branch Way
Millsboro, DE 19966
|
1,020 sq. feet
|
- baths - beds |
show details | |

|
#49
Moores Xing Unit 21
Millsboro, DE 19966
|
- sq. feet
|
- baths - beds |
show details | |

|
Check over 1 million property listings on Foreclosure.com!
|
browse all offers | |||


 | Fenwick Island Rental over Thanksgiving (2 replies) |
| Revisiting Baywood (28 replies) |
| Bayside Home Community near Fenwick Island, DE (0 replies) |
| Communities in/around Rehoboth/Bethany/Fenwick (4 replies) |
| Delaware For Retirement (79 replies) |
| Is there anything worth visiting delaware for ?? From nyc (43 replies) |

Household type by relationship:
Households: 372- Male householders: 107 (19 living alone), Female householders: 102 (45 living alone)
116 spouses (112 opposite-sex spouses), 11 unmarried partners, (11 opposite-sex unmarried partners), 23 children (22 natural, 1 adopted, 0 stepchildren), 0 grandchildren, 6 brothers or sisters, 0 parents, 0 foster children, 4 other relatives, 0 non-relatives
Size of family households: 133 2-persons, 4 3-persons, 1 4-persons, 3 5-persons.
Size of nonfamily households: 60 1-person, 9 2-persons.
16 married couples with children.
0 single-parent households (0 men, 0 women).
102.8% of residents of Fenwick Island speak English at home.
0.3% of residents speak other Indo-European language at home (100% speak English very well).
Foreign born population: 14 (3.8%)
(85.7% of them are naturalized citizens)
| Here: | 7.3 |
| State: | 6.9 |
| Here: | -680555554.9 |
| State: | 4.4 |

- Bedrooms in owner-occupied houses and condos in Fenwick Island, Delaware
- 0no bedroom
- 01 bedroom
- 62 bedrooms
- 793 bedrooms
- 644 bedrooms
- 555+ bedrooms

- Bedrooms in renter-occupied apartments in Fenwick Island, Delaware
- 0no bedroom
- 01 bedroom
- 02 bedrooms
- 03 bedrooms
- 04 bedrooms
- 35+ bedrooms

- Cars and other vehicles available in Fenwick Island in owner-occupied houses/condos
- 2no vehicle
- 671 vehicle
- 1022 vehicles
- 253 vehicles
- 74 vehicles
- 05+ vehicles

- Cars and other vehicles available in Fenwick Island in renter-occupied apartments
- 0no vehicle
- 21 vehicle
- 12 vehicles
- 03 vehicles
- 04 vehicles
- 05+ vehicles

- Rooms in owner-occupied houses in Fenwick Island, Delaware
- 01 room
- 02 rooms
- 03 rooms
- 74 rooms
- 285 rooms
- 406 rooms
- 347 rooms
- 258 rooms
- 699+ rooms

- Rooms in renter-occupied apartments in Fenwick Island, Delaware
- 01 room
- 02 rooms
- 03 rooms
- 04 rooms
- 05 rooms
- 06 rooms
- 07 rooms
- 08 rooms
- 39+ rooms


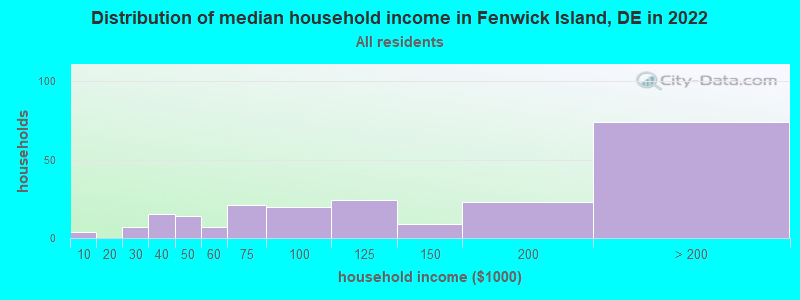
Fenwick Island, DE household income distribution

- 4Less than $10,000
- 7$20,000 to $29,999
- 15$30,000 to $39,999
- 14$40,000 to $49,999
- 7$50,000 to $59,999
- 21$60,000 to $74,999
- 20$75,000 to $99,999
- 24$100,000 to $124,999
- 9$125,000 to $149,999
- 23$150,000 to $199,999
- 74$200,000 or more
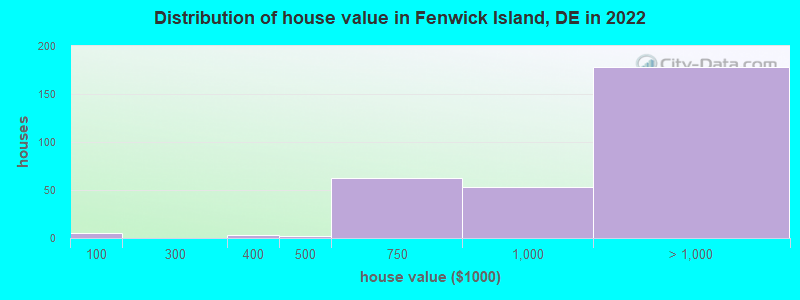
Home value of owner - occupied houses in 2022 in Fenwick Island, DE
-
- 4$70,000 to $79,999
- 3$300,000 to $399,999
- 2$400,000 to $499,999
- 62$500,000 to $749,999
- 53$750,000 to $999,999
- 56$1,000,000 to $1,499,999
- 48$1,500,000 to $1,999,999
- 73$2,000,000 or more
Rent paid by renters in 2022 in Fenwick Island, DE
-
- 1Less than $100
- 2No cash rent


Percentage of workers working in this county: 63.6%
Number of people working at home: 44 (40.0% of all workers)
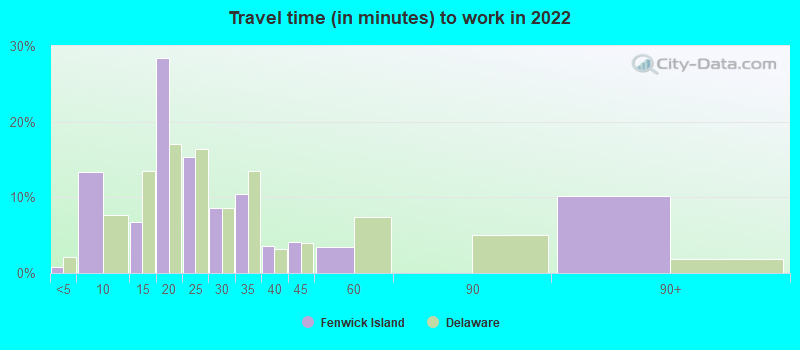
Travel time to work (commute)
- Less than 5 minutes: 1
- 5 to 9 minutes: 10
- 10 to 14 minutes: 3
- 15 to 19 minutes: 6
- 20 to 24 minutes: 24
- 25 to 29 minutes: 0
- 30 to 34 minutes: 7
- 35 to 39 minutes: 0
- 40 to 44 minutes: 0
- 45 to 59 minutes: 10
- 60 to 89 minutes: 3
- 90 or more minutes: 5
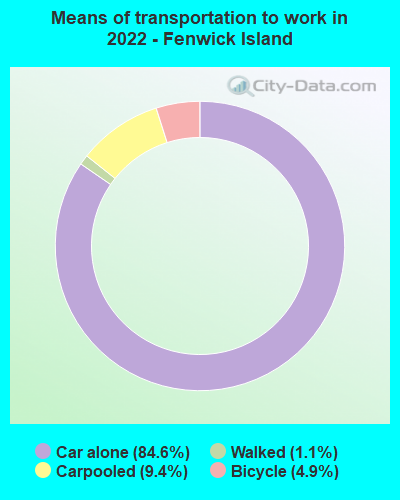
Means of transportation to work:
- Drove a car alone: 365 (75.9%)
- Carpooled: 41 (8.5%)
- Bicycle: 22 (4.6%)
- Walked: 5 (1.0%)
- Worked at home: 33 (6.9%)


- Year of entry for the foreign-born population in Fenwick Island, Delaware
- 02010 or later
- 02000 to 2009
- 01990 to 1999
- 01980 to 1989
- 01970 to 1979
- 11Before 1970

First ancestries reported:
- English: 54 (33.7%)
- German: 25 (15.6%)
- Irish: 14 (8.7%)
- American: 12 (7.5%)
- Italian: 10 (6.2%)
- Welsh: 7 (4.4%)
- French: 4 (2.5%)
- Northern European: 3 (1.9%)
- Polish: 3 (1.9%)
- Croatian: 2 (1.2%)
- Hungarian: 2 (1.2%)
- Norwegian: 2 (1.2%)
- Scottish: 2 (1.2%)
- Lebanese: 1 (0.6%)
- European: 1 (0.6%)
- Swiss: 1 (0.6%)
Most common places of birth for foreign-born residents (%):
| Fenwick Island: | 85.7% (12) |
| Delaware: | 1.4% (1,345) |
Place of birth for U.S.-born residents:
- This state: 57
- Other state: 316
- Northeast: 138
- Midwest: 4
- South: 171
- West: 2
89.5% of Fenwick Island residents lived in the same house 1 years ago.
Out of people who lived in different houses, 26.9% lived in this county.
Out of people who lived in different counties, 3.7% lived in Delaware.
| Fenwick Island: | 89.5% |
| State average: | 89.2% |
Education attainment for males 25 years and older:
- No schooling: 0
- Nursery to 4th grade: 0
- 5th and 6th grade: 0
- 7th and 8th grade: 4
- 9th grade: 0
- 10th grade: 0
- 11th grade: 0
- 12th grade, no diploma: 2
- High school graduate (or equivalency): 25
- Less than 1 year of college: 9
- Some college more than 1 year, no degree: 15
- Associate degree: 4
- Bachelor's degree: 60
- Master's degree: 32
- Professional school degree: 12
- Doctorate degree: 5

Education attainment for females 25 years and older:
- No schooling: 0
- Nursery to 4th grade: 0
- 5th and 6th grade: 0
- 7th and 8th grade: 0
- 9th grade: 0
- 10th grade: 0
- 11th grade: 7
- 12th grade, no diploma: 0
- High school graduate (or equivalency): 12
- Less than 1 year of college: 10
- Some college more than 1 year, no degree: 29
- Associate degree: 16
- Bachelor's degree: 78
- Master's degree: 37
- Professional school degree: 12
- Doctorate degree: 2


Housing units in structures:
- One, detached: 724
- One, attached: 48
- 5 to 9: 32
- Mobile homes: 8

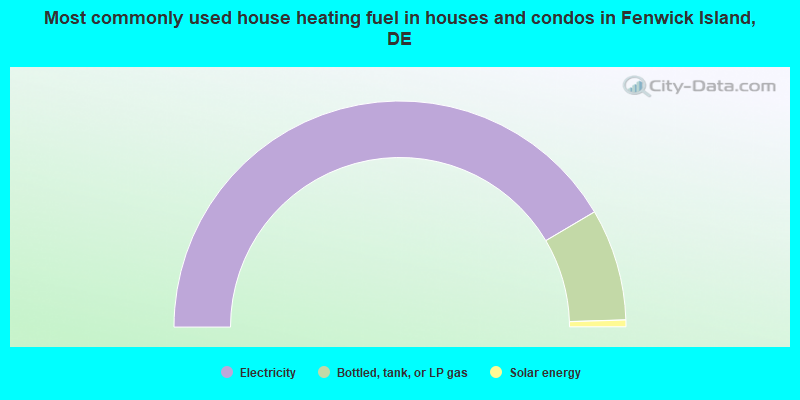
- 83.0%Electricity
- 16.0%Bottled, tank, or LP gas
- 1.0%Solar energy
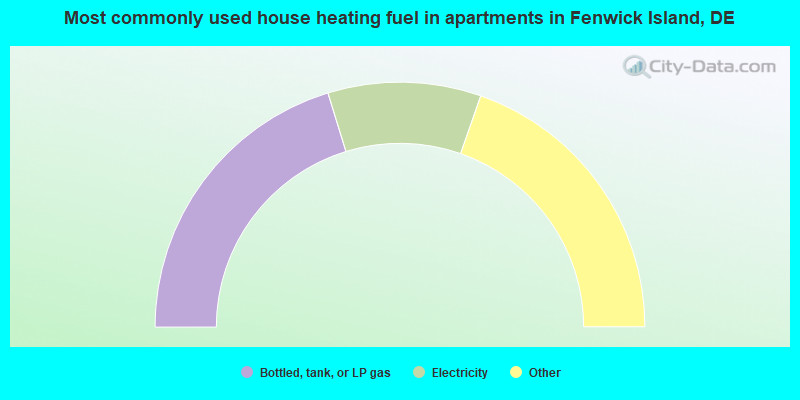
- 66.7%Bottled, tank, or LP gas
- 33.3%Electricity
Private vs. public school enrollment:
| Here: | 76.9% |
| Delaware: | 11.5% |
| Here: | 0.0% |
| Delaware: | 12.1% |
| Here: | 0.0% |
| Delaware: | 19.2% |


