Fieldon, IL (Illinois) Houses and Residents
| Fieldon: | $89,444 |
| Illinois: | $251,600 |
Mean price in 2022:
Detached houses: $94,988
Here: $94,988 State: $310,164 Mobile homes: $68,345
Here: $68,345 State: $78,855
Total population: 230 (Urban population: 0, Rural population: 259 (all nonfarm))
Houses: 116 (79 occupied: 79 owner occupied, 1 renter occupied)
| % of renters here: | 1% |
| State: | 33% |
Housing density: 583 houses/condos per square mile
Median price asked for vacant for-sale houses and condos in 2022: $28,683.
Median gross rent in Fieldon, IL in 2022: $-661,577,607
Housing units in Fieldon with a mortgage: 36 (0 second mortgage, 0 home equity loan, 0 both second mortgage and home equity loan)
Houses without a mortgage: 0
Median household income for houses/condos with a mortgage: $64,193
Median household income for apartments without a mortgage: $58,932
Median monthly housing costs: $678
Compare current foreclosures near Fieldon, IL:
| Photo | Address | Area | Beds / Baths | Price | Details |
|---|---|---|---|---|---|

|
#1
N 5th St
Elsberry, MO 63343
|
840 sq. feet
|
1 baths 2 beds |
$48,500
|
show details |

|
#2
N Public Rd
Fieldon, IL 62031
|
- sq. feet
|
- baths - beds |
show details | |

|
#3
Snedeker St
Jerseyville, IL 62052
|
- sq. feet
|
1 baths 2 beds |
$19,999
|
show details |

|
#4
N 2nd St
Elsberry, MO 63343
|
1,616 sq. feet
|
2 baths 6 beds |
show details | |

|
#5
Schnedler Dr
Saint Charles, MO 63301
|
1,002 sq. feet
|
1 baths 3 beds |
show details | |

|
#6
Maple Ave
Jerseyville, IL 62052
|
988 sq. feet
|
- baths - beds |
show details | |

|
#7
N 7th St
Elsberry, MO 63343
|
903 sq. feet
|
- baths 4 beds |
show details | |

|
#8
Great Owls Way
Winfield, MO 63389
|
1,486 sq. feet
|
- baths 3 beds |
show details | |

|
#9
Grange Hall Rd
Brighton, IL 62012
|
1,872 sq. feet
|
- baths - beds |
show details | |

|
#10
Mayes Ave
Elsberry, MO 63343
|
1,312 sq. feet
|
- baths 3 beds |
show details |
| Photo | Address | Area | Beds / Baths | Price | Details |
|---|---|---|---|---|---|

|
#11
David St
Elsberry, MO 63343
|
1,440 sq. feet
|
- baths 2 beds |
show details | |

|
#12
Salem Rd
Grafton, IL 62037
|
1,997 sq. feet
|
- baths - beds |
show details | |

|
#13
Fox Lake Dr
Godfrey, IL 62035
|
2,112 sq. feet
|
2 baths - beds |
show details | |

|
#14
Sand Hill Rd
Foley, MO 63347
|
1,680 sq. feet
|
- baths - beds |
show details | |

|
#15
Herron St
Hardin, IL 62047
|
- sq. feet
|
- baths - beds |
show details | |

|
#16
S 3rd St
Elsberry, MO 63343
|
- sq. feet
|
- baths - beds |
show details | |

|
#17
Highway B
Elsberry, MO 63343
|
- sq. feet
|
- baths - beds |
show details | |

|
#18
E Cherry St
Winfield, MO 63389
|
- sq. feet
|
- baths - beds |
show details | |

|
#19
Guitar Dr
Winfield, MO 63389
|
- sq. feet
|
- baths - beds |
show details | |

|
#20
2 Box 46
Hamburg, IL 62045
|
- sq. feet
|
- baths - beds |
show details |
| Photo | Address | Area | Beds / Baths | Price | Details |
|---|---|---|---|---|---|

|
#21
S Mississippi River Rd
Golden Eagle, IL 62036
|
- sq. feet
|
- baths - beds |
show details | |

|
#22
Railroad Ave
Foley, MO 63347
|
1,216 sq. feet
|
- baths - beds |
show details | |

|
#23
2 Box 2
Hamburg, IL 62045
|
- sq. feet
|
- baths - beds |
show details | |

|
#24
Highway Y
Foley, MO 63347
|
1,500 sq. feet
|
- baths - beds |
show details | |

|
#25
S Liberty St
Jerseyville, IL 62052
|
- sq. feet
|
- baths - beds |
show details | |

|
#26
E Arch St
Jerseyville, IL 62052
|
- sq. feet
|
- baths - beds |
show details | |

|
#27
Short St
Jerseyville, IL 62052
|
- sq. feet
|
- baths - beds |
show details | |

|
#28
Powerline Rd
Grafton, IL 62037
|
- sq. feet
|
- baths - beds |
show details | |

|
#29
Clay St
Jerseyville, IL 62052
|
- sq. feet
|
- baths - beds |
show details | |

|
#30
N Liberty St Apt C1
Jerseyville, IL 62052
|
- sq. feet
|
- baths - beds |
show details |
| Photo | Address | Area | Beds / Baths | Price | Details |
|---|---|---|---|---|---|

|
#31
Roberts St
Jerseyville, IL 62052
|
- sq. feet
|
- baths - beds |
show details | |

|
#32
W Spruce St
Jerseyville, IL 62052
|
- sq. feet
|
- baths - beds |
show details | |

|
#33
W Spruce St
Jerseyville, IL 62052
|
- sq. feet
|
- baths - beds |
show details | |

|
#34
Salem Rd
Grafton, IL 62037
|
- sq. feet
|
- baths - beds |
show details | |

|
#35
W Carpenter St
Jerseyville, IL 62052
|
- sq. feet
|
- baths - beds |
show details | |

|
#36
Angela Ct
Jerseyville, IL 62052
|
- sq. feet
|
- baths - beds |
show details | |

|
#37
Grafton Hills Dr
Grafton, IL 62037
|
- sq. feet
|
- baths - beds |
show details | |

|
#38
S Prairie St
Jerseyville, IL 62052
|
- sq. feet
|
- baths - beds |
show details | |

|
#39
S Liberty St
Jerseyville, IL 62052
|
- sq. feet
|
- baths - beds |
show details | |

|
#40
N Jefferson St
Jerseyville, IL 62052
|
- sq. feet
|
- baths - beds |
show details |
| Photo | Address | Area | Beds / Baths | Price | Details |
|---|---|---|---|---|---|

|
#41
E Exchange St
Jerseyville, IL 62052
|
- sq. feet
|
- baths - beds |
show details | |

|
#42
E Prairie St
Jerseyville, IL 62052
|
- sq. feet
|
- baths - beds |
show details | |

|
#43
S Main St
Carrollton, IL 62016
|
- sq. feet
|
- baths - beds |
show details | |

|
#44
Oak Leaf Cir
Foley, MO 63347
|
- sq. feet
|
- baths - beds |
show details | |

|
#45
Lovejoy St
Jerseyville, IL 62052
|
- sq. feet
|
- baths - beds |
show details | |

|
#46
Spruce Ct
Godfrey, IL 62035
|
- sq. feet
|
- baths - beds |
show details | |

|
#47
State Highway 3
Godfrey, IL 62035
|
- sq. feet
|
- baths - beds |
show details | |

|
#48
Prosper Ln
Jerseyville, IL 62052
|
- sq. feet
|
- baths - beds |
show details | |

|
Check over 1 million property listings on Foreclosure.com!
|
browse all offers | |||

Latest news about housing in Fieldon, IL collected exclusively by city-data.com from local newspapers, TV, and radio stations


Household type by relationship:
Households: 181- Male householders: 46 (9 living alone), Female householders: 31 (9 living alone)
34 spouses (34 opposite-sex spouses), 3 unmarried partners, (3 opposite-sex unmarried partners), 65 children (59 natural, 1 adopted, 3 stepchildren), 0 grandchildren, 0 brothers or sisters, 0 parents, 0 foster children, 0 other relatives, 0 non-relatives
Size of family households: 29 2-persons, 20 3-persons, 3 4-persons, 2 5-persons.
Size of nonfamily households: 20 1-person, 4 2-persons.
15 married couples with children.
25 single-parent households (9 men, 16 women).
99.4% of residents of Fieldon speak English at home.
| Here: | 5.6 |
| State: | 6.4 |
| Here: | -650793650.1 |
| State: | 4.1 |

- Bedrooms in owner-occupied houses and condos in Fieldon, Illinois
- 0no bedroom
- 121 bedroom
- 342 bedrooms
- 313 bedrooms
- 34 bedrooms
- 05+ bedrooms

- Bedrooms in renter-occupied apartments in Fieldon, Illinois
- 0no bedroom
- 01 bedroom
- 02 bedrooms
- 03 bedrooms
- 14 bedrooms
- 05+ bedrooms

- Cars and other vehicles available in Fieldon in owner-occupied houses/condos
- 10no vehicle
- 181 vehicle
- 252 vehicles
- 193 vehicles
- 44 vehicles
- 25+ vehicles

- Cars and other vehicles available in Fieldon in renter-occupied apartments
- 0no vehicle
- 11 vehicle
- 02 vehicles
- 03 vehicles
- 04 vehicles
- 05+ vehicles

- Rooms in owner-occupied houses in Fieldon, Illinois
- 01 room
- 12 rooms
- 23 rooms
- 204 rooms
- 135 rooms
- 366 rooms
- 77 rooms
- 08 rooms
- 09+ rooms

- Rooms in renter-occupied apartments in Fieldon, Illinois
- 01 room
- 02 rooms
- 03 rooms
- 04 rooms
- 05 rooms
- 06 rooms
- 17 rooms
- 08 rooms
- 09+ rooms


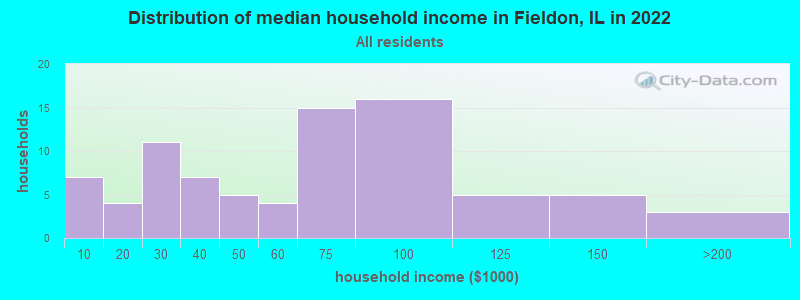
Fieldon, IL household income distribution

- 7Less than $10,000
- 4$10,000 to $19,999
- 11$20,000 to $29,999
- 7$30,000 to $39,999
- 5$40,000 to $49,999
- 4$50,000 to $59,999
- 15$60,000 to $74,999
- 16$75,000 to $99,999
- 5$100,000 to $124,999
- 5$125,000 to $149,999
- 3$150,000 to $199,999
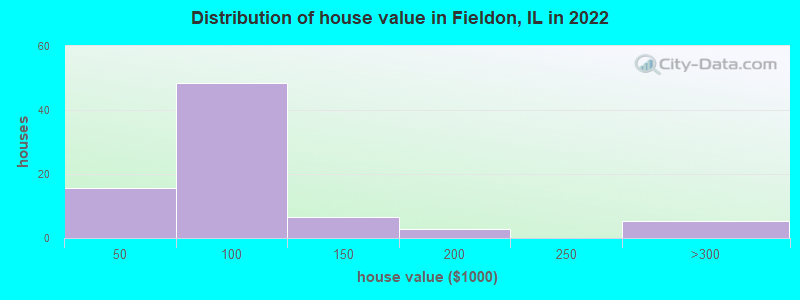
Home value of owner - occupied houses in 2022 in Fieldon, IL
-
- 2Less than $10,000
- 2$10,000 to $14,999
- 4$20,000 to $24,999
- 2$25,000 to $29,999
- 3$40,000 to $49,999
- 5$50,000 to $59,999
- 3$60,000 to $69,999
- 5$70,000 to $79,999
- 18$80,000 to $89,999
- 11$90,000 to $99,999
- 2$100,000 to $124,999
- 3$125,000 to $149,999
- 1$150,000 to $174,999
- 1$175,000 to $199,999
- 5$250,000 to $299,999
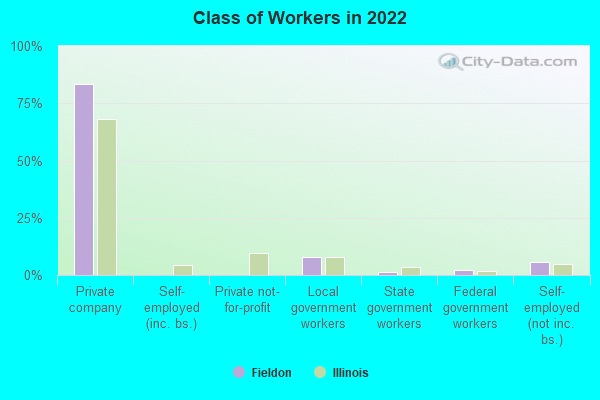
Percentage of workers working in this county: 73.9%
Number of people working at home: 0 (0.0% of all workers)
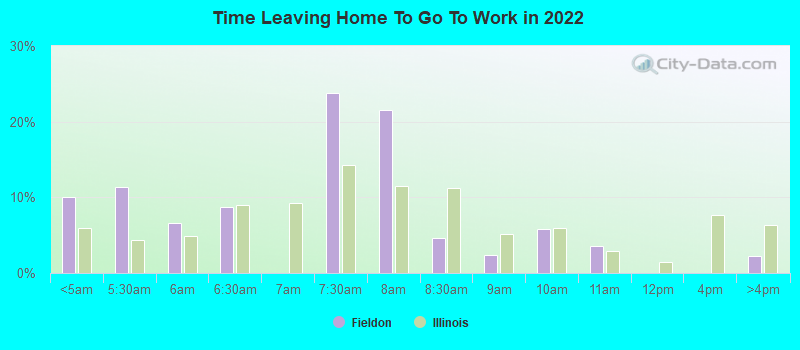
Travel time to work (commute)
- Less than 5 minutes: 4
- 5 to 9 minutes: 0
- 10 to 14 minutes: 11
- 15 to 19 minutes: 26
- 20 to 24 minutes: 9
- 25 to 29 minutes: 0
- 30 to 34 minutes: 2
- 35 to 39 minutes: 15
- 40 to 44 minutes: 0
- 45 to 59 minutes: 10
- 60 to 89 minutes: 2
- 90 or more minutes: 0
Means of transportation to work:
- Drove a car alone: 94 (91.3%)
- Carpooled: 3 (2.9%)
- Walked: 2 (1.9%)
- Worked at home: 4 (3.9%)
- Unemployment by race in 2022
- Unemployment rate for White non-Hispanic residents
- 3.0%Males
- 6.5%Females

First ancestries reported:
- German: 35 (46.8%)
- Irish: 16 (21.4%)
- American: 8 (10.7%)
- Scottish: 3 (4.0%)
- English: 2 (2.7%)
- French: 1 (1.3%)
Place of birth for U.S.-born residents:
- This state: 170
- Other state: 9
- Northeast: 0
- Midwest: 6
- South: 1
- West: 2
100.0% of Fieldon residents lived in the same house 1 years ago.
| Fieldon: | 100.0% |
| State average: | 88.3% |
Education attainment for males 25 years and older:
- No schooling: 0
- Nursery to 4th grade: 0
- 5th and 6th grade: 0
- 7th and 8th grade: 0
- 9th grade: 0
- 10th grade: 0
- 11th grade: 0
- 12th grade, no diploma: 2
- High school graduate (or equivalency): 44
- Less than 1 year of college: 3
- Some college more than 1 year, no degree: 8
- Associate degree: 7
- Bachelor's degree: 0
- Master's degree: 2
- Professional school degree: 0
- Doctorate degree: 0

Education attainment for females 25 years and older:
- No schooling: 1
- Nursery to 4th grade: 0
- 5th and 6th grade: 0
- 7th and 8th grade: 0
- 9th grade: 0
- 10th grade: 3
- 11th grade: 0
- 12th grade, no diploma: 0
- High school graduate (or equivalency): 30
- Less than 1 year of college: 5
- Some college more than 1 year, no degree: 7
- Associate degree: 8
- Bachelor's degree: 4
- Master's degree: 1
- Professional school degree: 0
- Doctorate degree: 0


Housing units in structures:
- One, detached: 100
- Mobile homes: 16
Median worth of mobile homes: $100,659
Housing units lacking complete kitchen facilities in 2022: 16.4%

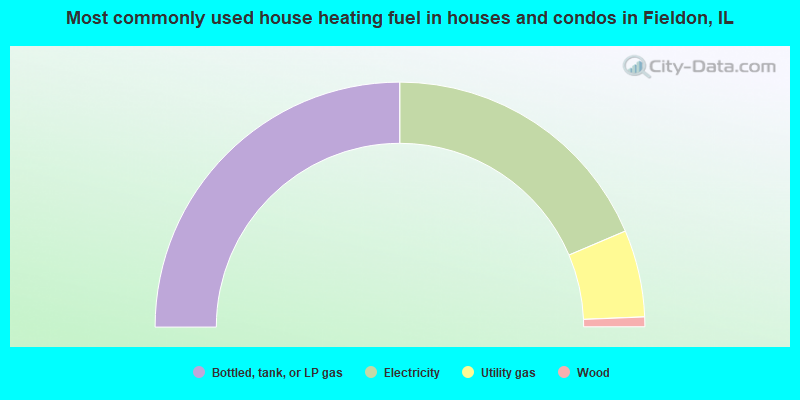
- 50.0%Bottled, tank, or LP gas
- 37.2%Electricity
- 11.5%Utility gas
- 1.3%Wood
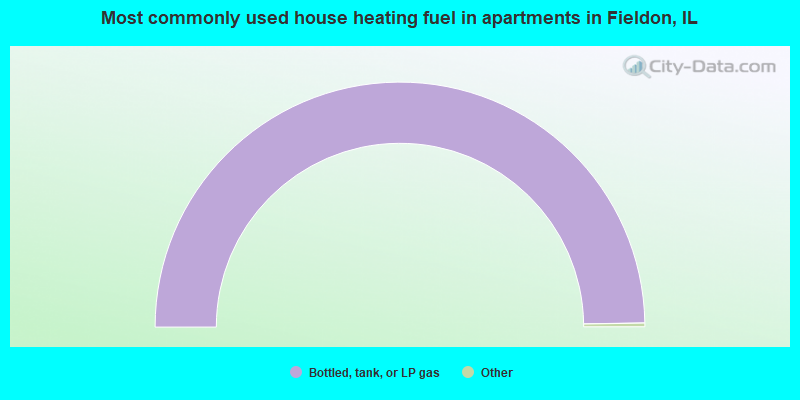
- 100.0%Bottled, tank, or LP gas
Private vs. public school enrollment:
| Here: | 4.5% |
| Illinois: | 13.3% |
| Here: | 14.3% |
| Illinois: | 9.9% |
| Here: | 0.0% |
| Illinois: | 27.4% |


