Fieldsboro, NJ (New Jersey) Houses and Residents
| Fieldsboro: | $295,029 |
| New Jersey: | $428,900 |
Mean price in 2022:
Detached houses: $359,005
Here: $359,005 State: $537,591 Townhouses or other attached units: $224,026
Here: $224,026 State: $381,113
Total population: 530 (Urban population: 528, Rural population: 0)
Houses: 306 (259 occupied: 215 owner occupied, 45 renter occupied)
| % of renters here: | 17% |
| State: | 35% |
Housing density: 1,126 houses/condos per square mile
Median price asked for vacant for-sale houses and condos in 2022 in this county: $249,452.
Median contract rent in 2022: $1,647 (lower quartile is $1,406, upper quartile is $1,851)
Median gross rent in Fieldsboro, NJ in 2022: over $2,000
Housing units in Fieldsboro with a mortgage: 133 (7 second mortgage, 0 home equity loan, 7 both second mortgage and home equity loan)
Houses without a mortgage: 0
Median household income for houses/condos with a mortgage: $114,755
Median household income for apartments without a mortgage: $46,996
Median monthly housing costs: $1,721
Compare current foreclosures near Fieldsboro, NJ:
| Photo | Address | Area | Beds / Baths | Price | Details |
|---|---|---|---|---|---|

|
#1
Moore Ct
Pennington, NJ 08534
|
940 sq. feet
|
1 baths 2 beds |
$195,993
|
show details |

|
#2
Brunswick Ave
Trenton, NJ 08618
|
1,088 sq. feet
|
1 baths 2 beds |
$68,500
|
show details |

|
#3
Foxglove Dr
Riverside, NJ 08075
|
840 sq. feet
|
1 baths 2 beds |
$113,683
|
show details |

|
#4
Monmouth Rd
Jobstown, NJ 08041
|
672 sq. feet
|
1 baths 2 beds |
$134,900
|
show details |

|
#5
N Cedar St
Bristol, PA 19007
|
841 sq. feet
|
1 baths 1 beds |
$307,500
|
show details |

|
#6
N Harrison St
Princeton, NJ 08540
|
2,572 sq. feet
|
2 baths 2 beds |
show details | |

|
#7
Sandy Rd
Philadelphia, PA 19115
|
1,178 sq. feet
|
2 baths 3 beds |
show details | |

|
#8
Smith Ave
Trenton, NJ 08611
|
1,330 sq. feet
|
1 baths 3 beds |
show details | |

|
#9
Donna Dr
Southampton, PA 18966
|
2,674 sq. feet
|
3 baths 4 beds |
show details | |

|
#10
Tynemouth Dr
Lumberton, NJ 08048
|
3,934 sq. feet
|
4 baths 5 beds |
show details |
| Photo | Address | Area | Beds / Baths | Price | Details |
|---|---|---|---|---|---|

|
#11
Mulberry St
Bristol, PA 19007
|
1,950 sq. feet
|
2 baths 4 beds |
show details | |

|
#12
Howley Dr
Morrisville, PA 19067
|
2,502 sq. feet
|
3 baths 3 beds |
show details | |

|
#13
Handeland Dr
Trenton, NJ 08690
|
2,334 sq. feet
|
3 baths 4 beds |
show details | |

|
#14
Foy Dr
Trenton, NJ 08690
|
2,416 sq. feet
|
3 baths 4 beds |
show details | |

|
#15
Hillcrest Ave
Morrisville, PA 19067
|
1,112 sq. feet
|
2 baths 3 beds |
show details | |

|
#16
Gaylord Cir
Willingboro, NJ 08046
|
1,397 sq. feet
|
2 baths 3 beds |
show details | |

|
#17
Jewel Rd
Princeton Junction, NJ 08550
|
- sq. feet
|
2 baths 4 beds |
show details | |

|
#18
3rd Ave
Bristol, PA 19007
|
1,024 sq. feet
|
1 baths 3 beds |
show details | |

|
#19
Falmouth Rd
Trenton, NJ 08620
|
1,008 sq. feet
|
2 baths 3 beds |
show details | |

|
#20
Indian Red Rd
Levittown, PA 19057
|
1,381 sq. feet
|
2 baths 3 beds |
show details |
| Photo | Address | Area | Beds / Baths | Price | Details |
|---|---|---|---|---|---|

|
#21
Wood St
Bristol, PA 19007
|
1,339 sq. feet
|
1 baths 5 beds |
show details | |

|
#22
Dows Rd
Philadelphia, PA 19154
|
1,449 sq. feet
|
1 baths 3 beds |
show details | |

|
#23
Frassetto Dr
Southampton, PA 18966
|
1,688 sq. feet
|
3 baths 3 beds |
show details | |

|
#24
Valley View Rd
Bensalem, PA 19020
|
2,070 sq. feet
|
2 baths 3 beds |
show details | |

|
#25
First Avenue
Croydon, PA 19021
|
1,320 sq. feet
|
2 baths 3 beds |
show details | |

|
#26
Wayland Ave
Bensalem, PA 19020
|
1,930 sq. feet
|
1 baths 4 beds |
show details | |

|
#27
Princess Ave
Croydon, PA 19021
|
900 sq. feet
|
1 baths 3 beds |
show details | |

|
#28
Saint James Ct
Langhorne, PA 19047
|
3,072 sq. feet
|
3 baths 3 beds |
show details | |

|
#29
Liberty Dr
Langhorne, PA 19047
|
1,480 sq. feet
|
2 baths 3 beds |
show details | |

|
#30
Dunstable Rd
Vincentown, NJ 08088
|
1,241 sq. feet
|
2 baths 2 beds |
show details |
| Photo | Address | Area | Beds / Baths | Price | Details |
|---|---|---|---|---|---|

|
#31
Walker Ave
Langhorne, PA 19047
|
1,499 sq. feet
|
1 baths 3 beds |
show details | |

|
#32
Benson St
Philadelphia, PA 19136
|
1,088 sq. feet
|
1 baths 3 beds |
show details | |

|
#33
Colmar Ave
Bensalem, PA 19020
|
1,300 sq. feet
|
1 baths 3 beds |
show details | |

|
#34
New Coach Ln
Willingboro, NJ 08046
|
2,190 sq. feet
|
2 baths 4 beds |
show details | |

|
#35
Woodlawn Dr
Bristol, PA 19007
|
1,310 sq. feet
|
1 baths 3 beds |
show details | |

|
#36
Marshall Ave
Trenton, NJ 08610
|
672 sq. feet
|
1 baths 3 beds |
show details | |

|
#37
Knights Bridge Dr
Morrisville, PA 19067
|
3,007 sq. feet
|
3 baths 4 beds |
show details | |

|
#38
Sharpless Blvd
Mount Holly, NJ 08060
|
1,488 sq. feet
|
2 baths 3 beds |
show details | |

|
#39
Arena Dr
Trenton, NJ 08610
|
864 sq. feet
|
1 baths 3 beds |
show details | |

|
#40
New Albany Rd
Riverton, NJ 08077
|
1,494 sq. feet
|
2 baths 3 beds |
show details |
| Photo | Address | Area | Beds / Baths | Price | Details |
|---|---|---|---|---|---|

|
#41
Beech Ln
Bensalem, PA 19020
|
1,248 sq. feet
|
2 baths 3 beds |
show details | |

|
#42
Woodhaven Rd
Philadelphia, PA 19116
|
2,365 sq. feet
|
- baths - beds |
$242,243
|
show details |

|
#43
Biscayne Dr
Philadelphia, PA 19154
|
1,224 sq. feet
|
1 baths 3 beds |
show details | |

|
#44
S Ascot Ct
Newtown, PA 18940
|
2,064 sq. feet
|
1 baths 3 beds |
show details | |

|
#45
Parkview Way
Newtown, PA 18940
|
2,016 sq. feet
|
2 baths 4 beds |
show details | |

|
#46
Franklin St
Trenton, NJ 08611
|
1,232 sq. feet
|
1 baths 3 beds |
show details | |

|
#47
Park St
Browns Mills, NJ 08015
|
1,110 sq. feet
|
1 baths 3 beds |
show details | |

|
#48
Morris St
Browns Mills, NJ 08015
|
1,236 sq. feet
|
2 baths 3 beds |
show details | |

|
#49
Heron Rd
Southampton, PA 18966
|
1,600 sq. feet
|
1 baths 3 beds |
show details | |

|
Check over 1 million property listings on Foreclosure.com!
|
browse all offers | |||

Latest news about housing in Fieldsboro, NJ collected exclusively by city-data.com from local newspapers, TV, and radio stations

 | HELP!!! Considering Purchasing Condo/Townhouse in South Jersey (Burlington County area)!!! (12 replies) |

Median year apartment built: 1938
Household type by relationship:
Households: 738- Male householders: 133 (31 living alone), Female householders: 127 (14 living alone)
113 spouses (113 opposite-sex spouses), 42 unmarried partners, (42 opposite-sex unmarried partners), 210 children (205 natural, 0 adopted, 5 stepchildren), 4 grandchildren, 38 brothers or sisters, 7 parents, 7 foster children, 48 other relatives, 7 non-relatives
Size of family households: 58 2-persons, 26 3-persons, 84 4-persons, 10 5-persons.
Size of nonfamily households: 46 1-person, 31 2-persons.
94 married couples with children.
27 single-parent households (19 men, 8 women).
72.2% of residents of Fieldsboro speak English at home.
11.1% of residents speak Spanish at home (43% speak English very well, 55% speak English well, 1% speak English not well).
10.6% of residents speak other Indo-European language at home (82% speak English very well, 17% speak English well, 1% speak English not well).
0.4% of residents speak Asian or Pacific Island language at home (100% speak English not well).
4.0% of residents speak other language at home (63% speak English very well, 37% speak English well).
Foreign born population: 128 (17.3%)
(31.2% of them are naturalized citizens)
| Here: | 6.8 |
| State: | 6.8 |
| Here: | 4.7 |
| State: | 3.9 |

- Bedrooms in owner-occupied houses and condos in Fieldsboro, New Jersey
- 0no bedroom
- 31 bedroom
- 422 bedrooms
- 1043 bedrooms
- 634 bedrooms
- 35+ bedrooms

- Bedrooms in renter-occupied apartments in Fieldsboro, New Jersey
- 0no bedroom
- 41 bedroom
- 192 bedrooms
- 223 bedrooms
- 04 bedrooms
- 05+ bedrooms

- Cars and other vehicles available in Fieldsboro in owner-occupied houses/condos
- 0no vehicle
- 611 vehicle
- 1022 vehicles
- 423 vehicles
- 74 vehicles
- 35+ vehicles

- Cars and other vehicles available in Fieldsboro in renter-occupied apartments
- 0no vehicle
- 141 vehicle
- 72 vehicles
- 243 vehicles
- 04 vehicles
- 05+ vehicles

- Rooms in owner-occupied houses in Fieldsboro, New Jersey
- 01 room
- 02 rooms
- 33 rooms
- 04 rooms
- 135 rooms
- 726 rooms
- 517 rooms
- 198 rooms
- 589+ rooms

- Rooms in renter-occupied apartments in Fieldsboro, New Jersey
- 01 room
- 42 rooms
- 03 rooms
- 124 rooms
- 195 rooms
- 76 rooms
- 37 rooms
- 08 rooms
- 09+ rooms


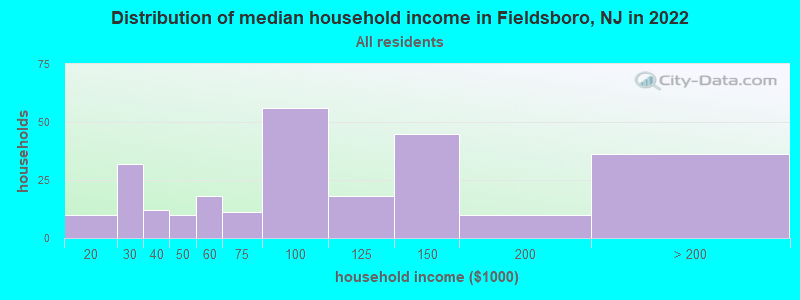
Fieldsboro, NJ household income distribution

- 10$10,000 to $19,999
- 32$20,000 to $29,999
- 12$30,000 to $39,999
- 10$40,000 to $49,999
- 18$50,000 to $59,999
- 11$60,000 to $74,999
- 56$75,000 to $99,999
- 18$100,000 to $124,999
- 45$125,000 to $149,999
- 10$150,000 to $199,999
- 36$200,000 or more
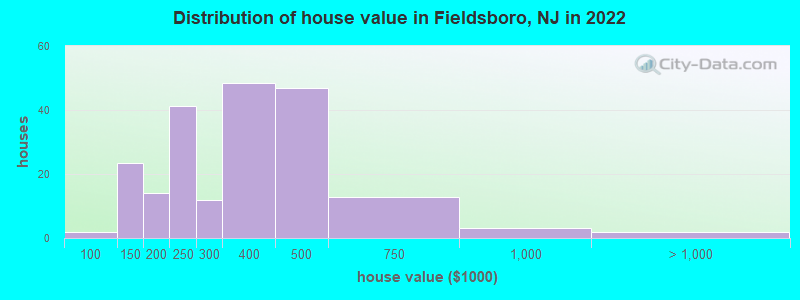
Home value of owner - occupied houses in 2022 in Fieldsboro, NJ
-
- 1$90,000 to $99,999
- 16$100,000 to $124,999
- 7$125,000 to $149,999
- 5$150,000 to $174,999
- 8$175,000 to $199,999
- 41$200,000 to $249,999
- 11$250,000 to $299,999
- 48$300,000 to $399,999
- 46$400,000 to $499,999
- 12$500,000 to $749,999
- 3$750,000 to $999,999
- 2$2,000,000 or more
Rent paid by renters in 2022 in Fieldsboro, NJ
-
- 3$600 to $649
- 3$1,000 to $1,249
- 2$1,250 to $1,499
- 29$1,500 to $1,999
- 1$2,500 to $2,999


Percentage of workers working in this county: 43.1%
Number of people working at home: 63 (16.8% of all workers)
Travel time to work (commute)
- Less than 5 minutes: 11
- 5 to 9 minutes: 10
- 10 to 14 minutes: 15
- 15 to 19 minutes: 68
- 20 to 24 minutes: 47
- 25 to 29 minutes: 52
- 30 to 34 minutes: 23
- 35 to 39 minutes: 8
- 40 to 44 minutes: 2
- 45 to 59 minutes: 21
- 60 to 89 minutes: 35
- 90 or more minutes: 13
Means of transportation to work:
- Drove a car alone: 238 (85.6%)
- Carpooled: 15 (5.4%)
- Bus or trolley bus: 2 (0.7%)
- Walked: 6 (2.2%)
- Other means: 5 (1.8%)
- Worked at home: 12 (4.3%)

- Unemployment by race in 2022
- Unemployment rate for White non-Hispanic residents
- 3.9%Males
- 6.9%Females

- Year of entry for the foreign-born population in Fieldsboro, New Jersey
- 02010 or later
- 82000 to 2009
- 901990 to 1999
- 21980 to 1989
- 01970 to 1979
- 6Before 1970

First ancestries reported:
- Polish: 74 (27.0%)
- Italian: 19 (6.9%)
- Hungarian: 18 (6.6%)
- German: 8 (2.9%)
- English: 7 (2.6%)
- Irish: 6 (2.2%)
- Lebanese: 5 (1.8%)
- American: 3 (1.1%)
- Egyptian: 3 (1.1%)
- Greek: 2 (0.7%)
- Eastern European: 1 (0.4%)
- European: 1 (0.4%)
- Northern European: 1 (0.4%)
Most common places of birth for foreign-born residents (%):
| Fieldsboro: | 32.7% (37) |
| New Jersey: | 2.3% (48,811) |
| Fieldsboro: | 31.9% (36) |
| New Jersey: | 0.3% (7,153) |
| Fieldsboro: | 11.5% (13) |
| New Jersey: | 0.2% (4,324) |
| Fieldsboro: | 4.4% (5) |
| New Jersey: | 12.8% (274,609) |
| Fieldsboro: | 1.8% (2) |
| New Jersey: | 0.3% (7,501) |
| Fieldsboro: | 1.8% (2) |
| New Jersey: | 1.6% (33,678) |
Place of birth for U.S.-born residents:
- This state: 491
- Other state: 118
- Northeast: 78
- Midwest: 3
- South: 38
- West: 0
96.5% of Fieldsboro residents lived in the same house 1 years ago.
Out of people who lived in different houses, 30.8% lived in this county.
Out of people who lived in different counties, 71.4% lived in New Jersey.
| Fieldsboro: | 96.5% |
| State average: | 90.4% |
Education attainment for males 25 years and older:
- No schooling: 0
- Nursery to 4th grade: 0
- 5th and 6th grade: 1
- 7th and 8th grade: 17
- 9th grade: 6
- 10th grade: 20
- 11th grade: 2
- 12th grade, no diploma: 8
- High school graduate (or equivalency): 41
- Less than 1 year of college: 16
- Some college more than 1 year, no degree: 40
- Associate degree: 47
- Bachelor's degree: 20
- Master's degree: 34
- Professional school degree: 3
- Doctorate degree: 0

Education attainment for females 25 years and older:
- No schooling: 0
- Nursery to 4th grade: 0
- 5th and 6th grade: 0
- 7th and 8th grade: 0
- 9th grade: 0
- 10th grade: 3
- 11th grade: 1
- 12th grade, no diploma: 3
- High school graduate (or equivalency): 108
- Less than 1 year of college: 10
- Some college more than 1 year, no degree: 32
- Associate degree: 18
- Bachelor's degree: 46
- Master's degree: 15
- Professional school degree: 1
- Doctorate degree: 0


Housing units in structures:
- One, detached: 212
- One, attached: 80
- Two: 9
- 50 or more: 4
House/condo owner moved in on average 20 years ago
Renter moved in on average 5 years ago

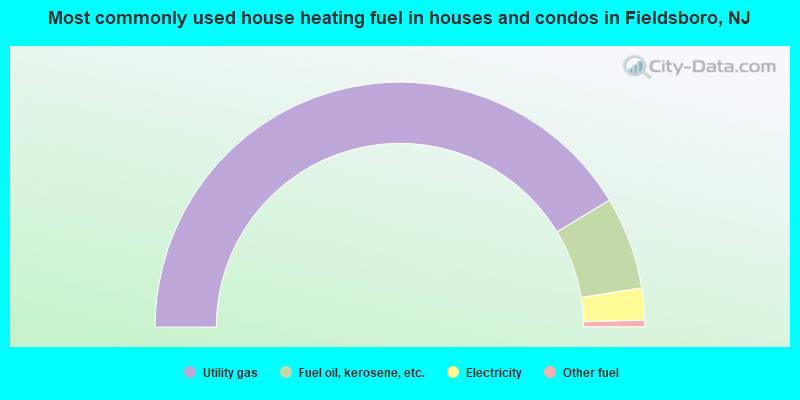
- 82.6%Utility gas
- 12.2%Fuel oil, kerosene, etc.
- 4.2%Electricity
- 0.9%Other fuel
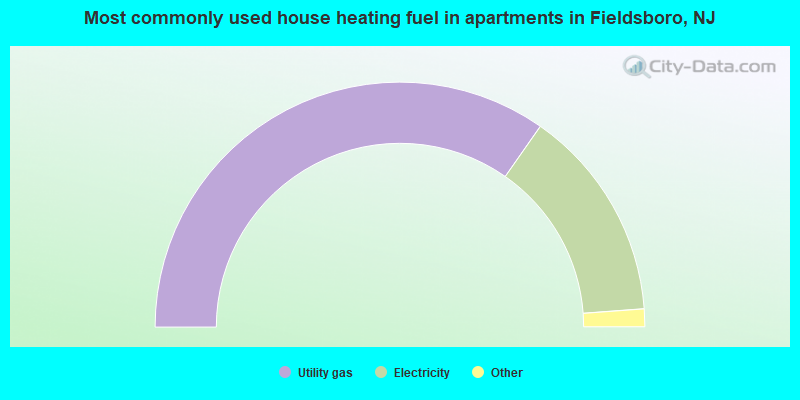
- 71.1%Utility gas
- 28.9%Electricity
Private vs. public school enrollment:
| Here: | 10.2% |
| New Jersey: | 12.3% |
| Here: | 0.0% |
| New Jersey: | 13.1% |
| Here: | 57.1% |
| New Jersey: | 33.2% |


