Fishhook, AK (Alaska) Houses and Residents
| Fishhook: | $374,765 |
| Alaska: | $336,900 |
Total population: 4,679 (Urban population: 0, Rural population: 1,994 (35 farm, 1,959 nonfarm))
Houses: 2,000 (1,791 occupied: 1,507 owner occupied, 288 renter occupied)
| % of renters here: | 16% |
| State: | 34% |
Housing density: 23 houses/condos per square mile
Median price asked for vacant for-sale houses and condos in 2022: $200,004.
Median contract rent in 2022: $1,433 (lower quartile is $1,161, upper quartile is $1,833)
Median rent asked for vacant for-rent units in 2022: $2,998
Median gross rent in Fishhook, AK in 2022: $1,880
Housing units in Fishhook with a mortgage: 1,031 (12 second mortgage, 0 home equity loan, 12 both second mortgage and home equity loan)
Houses without a mortgage: 0
Median household income for houses/condos with a mortgage: $128,409
Median household income for apartments without a mortgage: $72,574
Median monthly housing costs: $1,671
Compare current foreclosures near Fishhook, AK:
| Photo | Address | Area | Beds / Baths | Price | Details |
|---|---|---|---|---|---|

|
#1
N Glenn Highway
Sutton, AK 99674
|
1,188 sq. feet
|
2 baths 3 beds |
$230,000
|
show details |

|
#2
N Prospect Dr
Wasilla, AK 99623
|
384 sq. feet
|
1 baths - beds |
$96,900
|
show details |

|
#3
S Gon Fishin Dr
Wasilla, AK 99654
|
- sq. feet
|
4 baths 5 beds |
$849,900
|
show details |

|
#4
W Sunrise Rd
Wasilla, AK 99623
|
6,620 sq. feet
|
3 baths 5 beds |
show details | |

|
#5
W Cormorant Way
Wasilla, AK 99623
|
- sq. feet
|
1 baths 3 beds |
show details | |

|
#6
N Ebro Cir
Wasilla, AK 99654
|
- sq. feet
|
1 baths 2 beds |
show details | |

|
#7
W Ballyshannon Dr
Wasilla, AK 99623
|
- sq. feet
|
2 baths 3 beds |
show details | |

|
#8
W Riffle St
Wasilla, AK 99654
|
816 sq. feet
|
1 baths 2 beds |
show details | |

|
#9
N Barbi Dr
Wasilla, AK 99623
|
1,000 sq. feet
|
1 baths 2 beds |
show details | |

|
#10
N Tanana Dr
Wasilla, AK 99654
|
1,488 sq. feet
|
2 baths 3 beds |
show details |
| Photo | Address | Area | Beds / Baths | Price | Details |
|---|---|---|---|---|---|

|
#11
N Sasbo Bluff Loop
Wasilla, AK 99623
|
- sq. feet
|
1 baths 1 beds |
show details | |

|
#12
Hilltop Dr
Palmer, AK 99645
|
- sq. feet
|
1 baths 2 beds |
show details | |

|
#13
S Pinnacle Peak Dr
Wasilla, AK 99623
|
3,216 sq. feet
|
2 baths 5 beds |
show details | |

|
#14
W Crazy Pearsons Rd
Wasilla, AK 99654
|
- sq. feet
|
2 baths 4 beds |
show details | |

|
#15
N Meadow Lakes Loop
Wasilla, AK 99623
|
- sq. feet
|
1 baths 2 beds |
show details | |

|
#16
E Aspen St
Wasilla, AK 99654
|
2,788 sq. feet
|
- baths - beds |
show details | |

|
#17
S Well Site Rd
Wasilla, AK 99654
|
3,380 sq. feet
|
- baths - beds |
show details | |

|
#18
W Tracy Lynn Cir
Wasilla, AK 99623
|
2,228 sq. feet
|
- baths - beds |
show details | |

|
#19
W Secluded Meadows Loop
Wasilla, AK 99623
|
- sq. feet
|
- baths - beds |
show details | |

|
#20
N Edenfield Rd
Wasilla, AK 99623
|
1,048 sq. feet
|
- baths - beds |
show details |
| Photo | Address | Area | Beds / Baths | Price | Details |
|---|---|---|---|---|---|

|
#21
S Loussac Ln
Wasilla, AK 99654
|
2,660 sq. feet
|
- baths - beds |
show details | |

|
#22
W Admiralty Cir
Wasilla, AK 99623
|
- sq. feet
|
- baths - beds |
show details | |

|
#23
S Ridgeview Ct
Wasilla, AK 99654
|
1,624 sq. feet
|
- baths - beds |
show details | |

|
#24
S Ridgecrest Rd
Wasilla, AK 99623
|
- sq. feet
|
- baths - beds |
show details | |

|
#25
S. Ridgecrest Road
Wasilla, AK Array
|
2,500 sq. feet
|
- baths - beds |
show details | |

|
#26
S Well Site Rd
Wasilla, AK 99654
|
2,208 sq. feet
|
- baths - beds |
show details | |

|
#27
W Wellington Dr
Wasilla, AK 99623
|
2,080 sq. feet
|
- baths - beds |
show details | |

|
#28
W Vaunda Ave # 1
Wasilla, AK 99654
|
1,768 sq. feet
|
- baths - beds |
show details | |

|
#29
E Alpine Meadow Dr
Wasilla, AK 99654
|
- sq. feet
|
- baths - beds |
show details | |

|
#30
S Rogers Cir # G8
Wasilla, AK 99654
|
- sq. feet
|
- baths - beds |
show details |
| Photo | Address | Area | Beds / Baths | Price | Details |
|---|---|---|---|---|---|

|
#31
N Saint Hermans St
Wasilla, AK 99654
|
1,736 sq. feet
|
- baths - beds |
show details | |

|
#32
Silver Tip Dr
Palmer, AK 99645
|
832 sq. feet
|
- baths - beds |
show details | |

|
#33
E Frost Cir
Wasilla, AK 99654
|
- sq. feet
|
- baths - beds |
show details | |

|
#34
E Alder Dr
Wasilla, AK 99654
|
1,140 sq. feet
|
- baths - beds |
show details | |

|
#35
E Jensen Rd
Palmer, AK 99645
|
2,464 sq. feet
|
- baths - beds |
show details | |

|
#36
N Jade Cir
Wasilla, AK 99654
|
- sq. feet
|
- baths - beds |
show details | |

|
#37
N Citation Cir
Palmer, AK 99645
|
2,416 sq. feet
|
- baths - beds |
show details | |

|
#38
Irene St
Palmer, AK 99645
|
- sq. feet
|
- baths - beds |
show details | |

|
#39
W Tiller Ave
Wasilla, AK 99654
|
1,258 sq. feet
|
- baths - beds |
show details | |

|
#40
E Mulchatna Dr
Wasilla, AK 99654
|
3,834 sq. feet
|
- baths - beds |
show details |
| Photo | Address | Area | Beds / Baths | Price | Details |
|---|---|---|---|---|---|

|
#41
E Fallbrooks Ave
Wasilla, AK 99654
|
1,352 sq. feet
|
- baths - beds |
show details | |

|
#42
N Valley Way
Palmer, AK 99645
|
- sq. feet
|
- baths - beds |
show details | |

|
#43
S Serrano Dr
Wasilla, AK 99654
|
996 sq. feet
|
- baths - beds |
show details | |

|
#44
S Withers Rd
Wasilla, AK 99654
|
- sq. feet
|
- baths - beds |
show details | |

|
#45
S Denali St # B
Palmer, AK 99645
|
- sq. feet
|
- baths - beds |
show details | |

|
#46
N Motherlode Cir
Wasilla, AK 99654
|
1,754 sq. feet
|
- baths - beds |
show details | |

|
#47
E Susitna Dr
Wasilla, AK 99654
|
1,512 sq. feet
|
- baths - beds |
show details | |

|
#48
N Pioneer Peak Dr
Wasilla, AK 99654
|
512 sq. feet
|
- baths - beds |
show details | |

|
#49
E Jim Cottrell Cir # 10
Palmer, AK 99645
|
- sq. feet
|
- baths - beds |
show details | |

|
Check over 1 million property listings on Foreclosure.com!
|
browse all offers | |||

Latest news about housing in Fishhook, AK collected exclusively by city-data.com from local newspapers, TV, and radio stations

 | Real estate questions? (50 replies) |
| Moving to the Valley in July... (33 replies) |
| 17 Foot 100 Pound Dangerous Snake On the Loose In Wasilla. (42 replies) |
| Safest Palmer/Wasilla Neighborhoods (34 replies) |
| Some recent AK photo's (12391 replies) |
| Palmer (29 replies) |

Median year apartment built: 2014
Household type by relationship:
Households: 5,334- Male householders: 918 (165 living alone), Female householders: 924 (235 living alone)
1,048 spouses (1,027 opposite-sex spouses), 133 unmarried partners, (133 opposite-sex unmarried partners), 1,799 children (1,577 natural, 177 adopted, 43 stepchildren), 112 grandchildren, 22 brothers or sisters, 57 parents, 29 foster children, 110 other relatives, 157 non-relatives
- In group quarters: 20
Size of family households: 500 2-persons, 132 3-persons, 335 4-persons, 122 5-persons, 117 6-persons, 80 7-or-more-persons.
Size of nonfamily households: 435 1-person, 34 2-persons, 37 3-persons, 11 4-persons, 18 7-or-more-persons.
1,083 married couples with children.
237 single-parent households (77 men, 160 women).
96.0% of residents of Fishhook speak English at home.
1.3% of residents speak Spanish at home (65% speak English very well, 35% speak English not well).
2.4% of residents speak other Indo-European language at home (63% speak English very well, 5% speak English well, 18% speak English not well, 13% don't speak English at all).
0.9% of residents speak Asian or Pacific Island language at home (31% speak English very well, 22% speak English well, 44% speak English not well, 2% don't speak English at all).
0.1% of residents speak other language at home (100% speak English very well).
Foreign born population: 114 (2.1%)
(81.6% of them are naturalized citizens)
| Here: | 5.8 |
| State: | 5.6 |
| Here: | 4.2 |
| State: | 3.9 |

- Bedrooms in owner-occupied houses and condos in Fishhook, Alaska
- 0no bedroom
- 611 bedroom
- 2122 bedrooms
- 7173 bedrooms
- 3434 bedrooms
- 1755+ bedrooms

- Bedrooms in renter-occupied apartments in Fishhook, Alaska
- 0no bedroom
- 171 bedroom
- 1512 bedrooms
- 1203 bedrooms
- 04 bedrooms
- 05+ bedrooms

- Cars and other vehicles available in Fishhook in owner-occupied houses/condos
- 5no vehicle
- 2771 vehicle
- 6422 vehicles
- 2343 vehicles
- 2264 vehicles
- 1245+ vehicles

- Cars and other vehicles available in Fishhook in renter-occupied apartments
- 38no vehicle
- 1231 vehicle
- 662 vehicles
- 623 vehicles
- 04 vehicles
- 05+ vehicles

- Rooms in owner-occupied houses in Fishhook, Alaska
- 01 room
- 42 rooms
- 593 rooms
- 2854 rooms
- 2505 rooms
- 3766 rooms
- 1387 rooms
- 1908 rooms
- 2059+ rooms

- Rooms in renter-occupied apartments in Fishhook, Alaska
- 01 room
- 172 rooms
- 493 rooms
- 954 rooms
- 735 rooms
- 556 rooms
- 07 rooms
- 08 rooms
- 09+ rooms


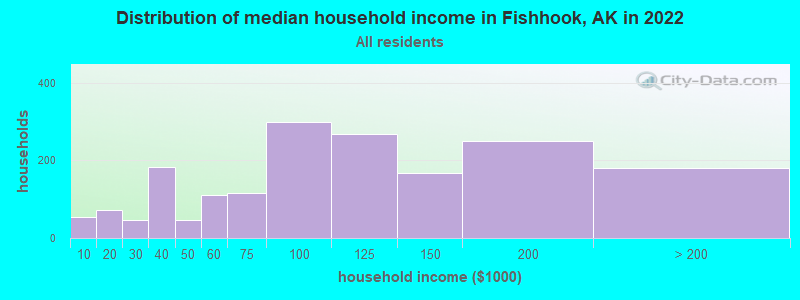
Fishhook, AK household income distribution

- 53Less than $10,000
- 72$10,000 to $19,999
- 46$20,000 to $29,999
- 182$30,000 to $39,999
- 46$40,000 to $49,999
- 110$50,000 to $59,999
- 117$60,000 to $74,999
- 299$75,000 to $99,999
- 269$100,000 to $124,999
- 168$125,000 to $149,999
- 251$150,000 to $199,999
- 181$200,000 or more
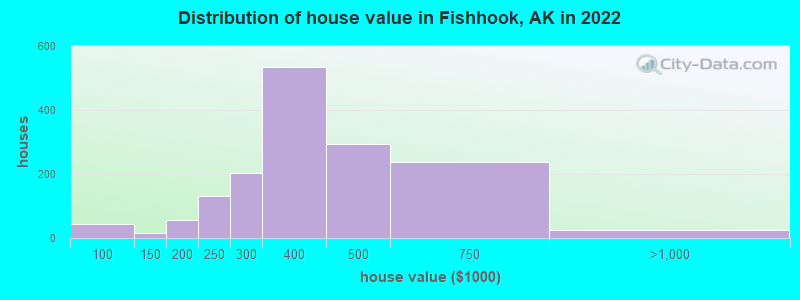
Home value of owner - occupied houses in 2022 in Fishhook, AK
-
- 23$70,000 to $79,999
- 20$90,000 to $99,999
- 13$100,000 to $124,999
- 3$125,000 to $149,999
- 33$150,000 to $174,999
- 23$175,000 to $199,999
- 130$200,000 to $249,999
- 203$250,000 to $299,999
- 534$300,000 to $399,999
- 295$400,000 to $499,999
- 236$500,000 to $749,999
- 24$750,000 to $999,999
Rent paid by renters in 2022 in Fishhook, AK
-
- 37$800 to $899
- 27$900 to $999
- 54$1,000 to $1,249
- 71$1,250 to $1,499
- 74$1,500 to $1,999
- 27$2,000 to $2,499
- 12No cash rent


Percentage of workers working in this county: 67.4%
Number of people working at home: 187 (8.0% of all workers)
Travel time to work (commute)
- Less than 5 minutes: 41
- 5 to 9 minutes: 91
- 10 to 14 minutes: 114
- 15 to 19 minutes: 363
- 20 to 24 minutes: 305
- 25 to 29 minutes: 136
- 30 to 34 minutes: 194
- 35 to 39 minutes: 43
- 40 to 44 minutes: 3
- 45 to 59 minutes: 431
- 60 to 89 minutes: 226
- 90 or more minutes: 130

Means of transportation to work:
- Drove a car alone: 268 (67.7%)
- Carpooled: 9 (2.3%)
- Bus: 1 (0.3%)
- Taxi: 18 (4.5%)
- Walked: 4 (1.0%)
- Worked at home: 134 (33.8%)

- Unemployment by race in 2022
- Unemployment rate for White non-Hispanic residents
- 4.0%Males
- 5.6%Females
- Unemployment rate for American Indian and Alaska Native residents
- 6.7%Males
- 28.4%Females
- Unemployment rate for Asian residents
- 14.3%Males
- Unemployment rate for two or more race residents
- 10.2%Males
- 17.6%Females

- Year of entry for the foreign-born population in Fishhook, Alaska
- 62010 or later
- 342000 to 2009
- 481990 to 1999
- 81980 to 1989
- 91970 to 1979
- 10Before 1970

First ancestries reported:
- German: 351 (14.9%)
- English: 312 (13.3%)
- Scandinavian: 108 (4.6%)
- European: 103 (4.4%)
- Scotch-Irish: 103 (4.4%)
- Irish: 74 (3.2%)
- Norwegian: 73 (3.1%)
- Polish: 61 (2.6%)
- Italian: 54 (2.3%)
- Swedish: 51 (2.2%)
- American: 46 (2.0%)
- Scottish: 43 (1.8%)
- French: 37 (1.6%)
- Russian: 29 (1.2%)
- Ukrainian: 29 (1.2%)
- Australian: 16 (0.7%)
- Dutch: 13 (0.6%)
- Lithuanian: 6 (0.3%)
- Macedonian: 5 (0.2%)
- Canadian: 3 (0.1%)
- Cape Verdean: 3 (0.1%)
- French Canadian: 2 (0.09%)
Most common places of birth for foreign-born residents (%):
| Fishhook: | 24.6% (33) |
| Alaska: | 1.5% (863) |
| Fishhook: | 23.9% (32) |
| Alaska: | 6.6% (3,837) |
| Fishhook: | 17.2% (23) |
| Alaska: | 0.4% (218) |
| Fishhook: | 11.9% (16) |
| Alaska: | 0.5% (299) |
| Fishhook: | 6.7% (9) |
| Alaska: | 0.4% (205) |
| Fishhook: | 5.2% (7) |
| Alaska: | 0.3% (202) |
| Fishhook: | 4.5% (6) |
| Alaska: | 2.0% (1,137) |
| Fishhook: | 3.0% (4) |
| Alaska: | 5.0% (2,924) |
Place of birth for U.S.-born residents:
- This state: 1,981
- Other state: 3,124
- Northeast: 358
- Midwest: 902
- South: 446
- West: 1,414
93.2% of Fishhook residents lived in the same house 1 years ago.
Out of people who lived in different houses, 36.4% lived in this county.
Out of people who lived in different counties, 41.2% lived in Alaska.
| Fishhook: | 93.2% |
| State average: | 84.8% |
Education attainment for males 25 years and older:
- No schooling: 0
- Nursery to 4th grade: 17
- 5th and 6th grade: 11
- 7th and 8th grade: 4
- 9th grade: 0
- 10th grade: 24
- 11th grade: 1
- 12th grade, no diploma: 3
- High school graduate (or equivalency): 499
- Less than 1 year of college: 187
- Some college more than 1 year, no degree: 315
- Associate degree: 217
- Bachelor's degree: 267
- Master's degree: 116
- Professional school degree: 6
- Doctorate degree: 20

Education attainment for females 25 years and older:
- No schooling: 3
- Nursery to 4th grade: 0
- 5th and 6th grade: 0
- 7th and 8th grade: 0
- 9th grade: 0
- 10th grade: 13
- 11th grade: 6
- 12th grade, no diploma: 57
- High school graduate (or equivalency): 306
- Less than 1 year of college: 148
- Some college more than 1 year, no degree: 418
- Associate degree: 264
- Bachelor's degree: 327
- Master's degree: 116
- Professional school degree: 3
- Doctorate degree: 31


Housing units in structures:
- One, detached: 1,746
- One, attached: 37
- Two: 93
- 3 or 4: 14
- 5 to 9: 60
- Mobile homes: 48
Median worth of mobile homes: $315,309
Housing units lacking complete kitchen facilities in 2022: 3.4%
House/condo owner moved in on average 9 years ago
Renter moved in on average 1 years ago

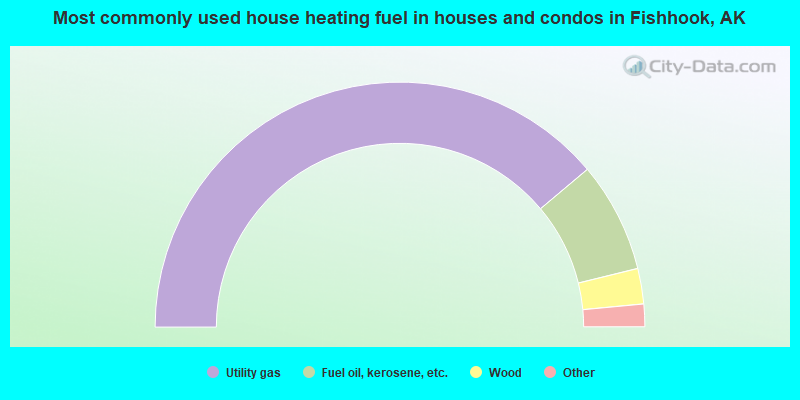
- 77.9%Utility gas
- 14.6%Fuel oil, kerosene, etc.
- 4.7%Wood
- 1.5%Bottled, tank, or LP gas
- 1.0%Electricity
- 0.3%Other fuel
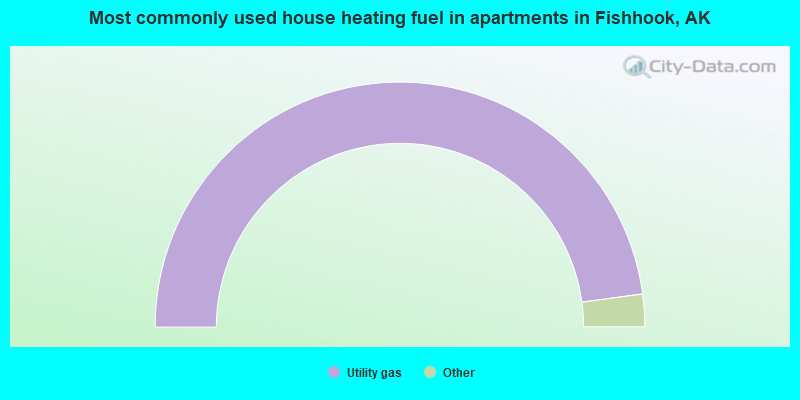
- 95.8%Utility gas
- 2.8%Coal or coke
- 1.4%Fuel oil, kerosene, etc.
Private vs. public school enrollment:
| Here: | 24.5% |
| Alaska: | 15.7% |
| Here: | 32.5% |
| Alaska: | 13.7% |
| Here: | 11.3% |
| Alaska: | 14.7% |


