Flat Rock, MI (Michigan) Houses and Residents
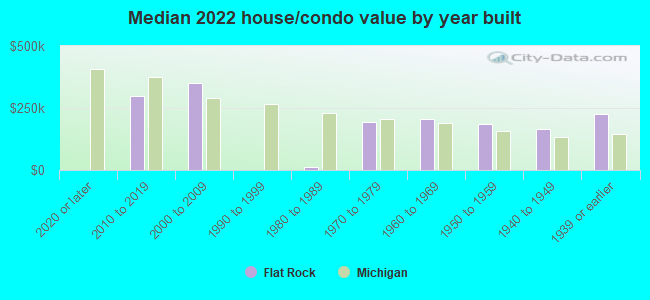
| Flat Rock: | $195,051 |
| Michigan: | $224,400 |
Total population: 9,854 (Urban population: 8,488, Rural population: 0)
Houses: 4,119 (3,782 occupied: 2,842 owner occupied, 962 renter occupied)
| % of renters here: | 25% |
| State: | 27% |
Housing density: 615 houses/condos per square mile
Median price asked for vacant for-sale houses and condos in 2022: $85,175.
Median contract rent in 2022: $767 (lower quartile is $342, upper quartile is $1,009)
Median rent asked for vacant for-rent units in 2022: $753
Median gross rent in Flat Rock, MI in 2022: $880
Housing units in Flat Rock with a mortgage: 1,865 (80 second mortgage, 3 home equity loan, 81 both second mortgage and home equity loan)
Houses without a mortgage: 51
Median household income for houses/condos with a mortgage: $94,119
Median household income for apartments without a mortgage: $56,111
Median monthly housing costs: $1,064
Compare current foreclosures in Flat Rock, MI:
| Photo | Address | Area | Beds / Baths | Price | Details |
|---|---|---|---|---|---|

|
#1
Matilda Ave
Flat Rock, MI 48134
|
1,298 sq. feet
|
2 baths 3 beds |
$259,000
|
show details |

|
#2
Alicia St
Flat Rock, MI 48134
|
2,056 sq. feet
|
1 baths 3 beds |
show details | |

|
#3
Stephanie Ct
Flat Rock, MI 48134
|
1,676 sq. feet
|
2 baths 3 beds |
show details | |

|
#4
West Rd
Flat Rock, MI 48134
|
1,238 sq. feet
|
1 baths 3 beds |
show details | |

|
#5
Timber Ridge Trl
Flat Rock, MI 48134
|
1,932 sq. feet
|
2 baths 4 beds |
show details | |

|
#6
Yvonne Dr
Flat Rock, MI 48134
|
3,449 sq. feet
|
3 baths 4 beds |
show details | |

|
#7
Stewart Blvd
Flat Rock, MI 48134
|
4,535 sq. feet
|
3 baths 4 beds |
show details | |

|
#8
Beech Daly Rd
Flat Rock, MI 48134
|
2,586 sq. feet
|
2 baths 4 beds |
show details | |

|
#9
Tara Ln
Flat Rock, MI 48134
|
1,384 sq. feet
|
2 baths 2 beds |
show details | |

|
#10
Christina Dr
Flat Rock, MI 48134
|
2,243 sq. feet
|
3 baths 4 beds |
show details |
| Photo | Address | Area | Beds / Baths | Price | Details |
|---|---|---|---|---|---|

|
#11
Wolverine St
Flat Rock, MI 48134
|
1,832 sq. feet
|
2 baths 4 beds |
show details | |

|
#12
W Aztec Cir
Flat Rock, MI 48134
|
- sq. feet
|
- baths - beds |
show details | |

|
#13
Parkview
Flat Rock, MI 48134
|
- sq. feet
|
- baths - beds |
show details | |

|
#14
Tanglewood St
Flat Rock, MI 48134
|
- sq. feet
|
- baths - beds |
show details | |

|
#15
Walter Dr
Flat Rock, MI 48134
|
- sq. feet
|
- baths - beds |
show details | |

|
#16
Teton Ln
Flat Rock, MI 48134
|
- sq. feet
|
- baths - beds |
show details | |

|
#17
Mayfair St
Flat Rock, MI 48134
|
- sq. feet
|
- baths - beds |
show details | |

|
#18
Boxwood
Flat Rock, MI 48134
|
- sq. feet
|
- baths - beds |
show details | |

|
#19
Seneca St # B
Flat Rock, MI 48134
|
- sq. feet
|
- baths - beds |
show details | |

|
#20
San Marino Apt 103
Flat Rock, MI 48134
|
- sq. feet
|
- baths - beds |
show details |
| Photo | Address | Area | Beds / Baths | Price | Details |
|---|---|---|---|---|---|

|
#21
E Aztec Cir
Flat Rock, MI 48134
|
- sq. feet
|
- baths - beds |
show details | |

|
#22
Bradbury Dr
Flat Rock, MI 48134
|
- sq. feet
|
- baths - beds |
show details | |

|
#23
Woodruff Rd
Flat Rock, MI 48134
|
- sq. feet
|
- baths - beds |
show details | |

|
#24
W Cherokee Dr
Flat Rock, MI 48134
|
- sq. feet
|
- baths - beds |
show details | |

|
#25
Canyon Cir
Flat Rock, MI 48134
|
- sq. feet
|
- baths - beds |
show details | |

|
#26
Telegraph Rd Lot 25
Flat Rock, MI 48134
|
- sq. feet
|
1 baths - beds |
show details | |

|
#27
Mapleleaf Dr
Flat Rock, MI 48134
|
- sq. feet
|
- baths - beds |
show details | |

|
#28
Deer Creek Dr
Flat Rock, MI 48134
|
- sq. feet
|
- baths - beds |
show details | |

|
#29
Brompton Rd
Flat Rock, MI 48134
|
- sq. feet
|
- baths - beds |
show details | |

|
#30
S Aztec Cir
Flat Rock, MI 48134
|
- sq. feet
|
- baths - beds |
show details |
| Photo | Address | Area | Beds / Baths | Price | Details |
|---|---|---|---|---|---|

|
#31
Bristol Dr
Flat Rock, MI 48134
|
- sq. feet
|
- baths - beds |
show details | |

|
#32
Hazelwood Rd
Flat Rock, MI 48134
|
- sq. feet
|
- baths - beds |
show details | |

|
#33
Vinewood Rd
Flat Rock, MI 48134
|
- sq. feet
|
- baths - beds |
show details | |

|
#34
Oakwood Ave
Flat Rock, MI 48134
|
- sq. feet
|
- baths - beds |
show details | |

|
#35
White Pine St
Flat Rock, MI 48134
|
- sq. feet
|
- baths - beds |
show details | |

|
#36
Maple Dr
Flat Rock, MI 48134
|
- sq. feet
|
- baths - beds |
show details | |

|
#37
Senate Dr
Flat Rock, MI 48134
|
- sq. feet
|
- baths - beds |
show details | |

|
#38
Trillium Way
Flat Rock, MI 48134
|
- sq. feet
|
- baths - beds |
show details | |

|
#39
Lorelei Dr
Flat Rock, MI 48134
|
- sq. feet
|
- baths - beds |
show details | |

|
#40
Maple Dr
Flat Rock, MI 48134
|
- sq. feet
|
- baths - beds |
show details |
| Photo | Address | Area | Beds / Baths | Price | Details |
|---|---|---|---|---|---|

|
#41
Seminole Ln
Flat Rock, MI 48134
|
- sq. feet
|
- baths - beds |
show details | |

|
#42
Hudson Ln
Flat Rock, MI 48134
|
- sq. feet
|
- baths - beds |
show details | |

|
#43
Matilda Ave
Flat Rock, MI 48134
|
- sq. feet
|
- baths - beds |
show details | |

|
#44
Parkview
Flat Rock, MI 48134
|
- sq. feet
|
- baths - beds |
show details | |

|
#45
Walnut St
Flat Rock, MI 48134
|
- sq. feet
|
- baths - beds |
show details | |

|
#46
Cambridge St
Flat Rock, MI 48134
|
- sq. feet
|
- baths - beds |
show details | |

|
#47
Edwin Dr
Flat Rock, MI 48134
|
- sq. feet
|
- baths - beds |
show details | |

|
#48
N Hampton Dr
Flat Rock, MI 48134
|
- sq. feet
|
- baths - beds |
show details | |

|
#49
Summer Ln
Flat Rock, MI 48134
|
- sq. feet
|
- baths - beds |
show details | |

|
Check over 1 million property listings on Foreclosure.com!
|
browse all offers | |||


 | Renting a house vs. apartment in Downriver area (8 replies) |
| Looking for rental with nature (20 min to Henry Ford Hospital) (10 replies) |
| Apt rentals: Novi vs West Bloomfield? (24 replies) |
| The First Thing That Comes To Mind… (4 replies) |
| Need to move! Need Seclusion . (6 replies) |
| To Michigan from Vermont - advice (28 replies) |
Median year apartment built: 1975
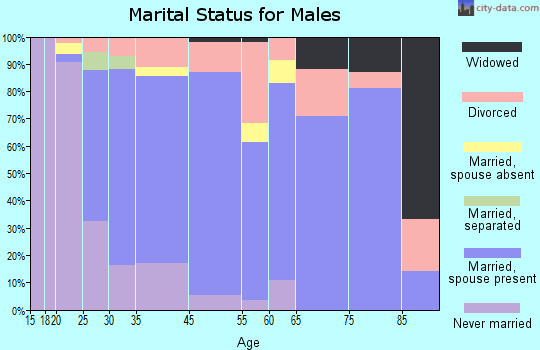
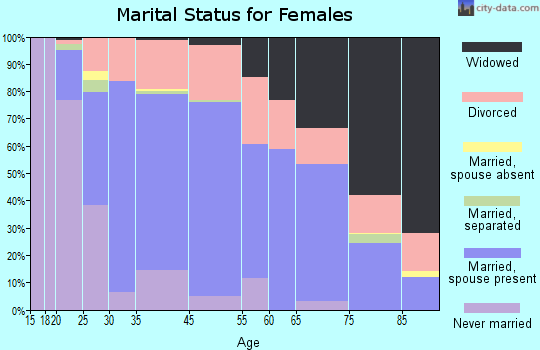
Household type by relationship:
Households: 10,303- Male householders: 1,559 (336 living alone), Female householders: 2,176 (542 living alone)
1,692 spouses (1,692 opposite-sex spouses), 249 unmarried partners, (243 opposite-sex unmarried partners), 3,889 children (3,587 natural, 70 adopted, 231 stepchildren), 428 grandchildren, 4 brothers or sisters, 47 parents, 13 foster children, 77 other relatives, 139 non-relatives
- In group quarters: 25
Size of family households: 1,080 2-persons, 821 3-persons, 424 4-persons, 217 5-persons, 182 6-persons, 23 7-or-more-persons.
Size of nonfamily households: 910 1-person, 116 2-persons, 6 4-persons.
1,334 married couples with children.
1,073 single-parent households (89 men, 984 women).
95.3% of residents of Flat Rock speak English at home.
2.8% of residents speak Spanish at home (70% speak English very well, 18% speak English well, 11% speak English not well).
1.2% of residents speak other Indo-European language at home (69% speak English very well, 31% speak English well).
0.1% of residents speak other language at home (45% speak English very well, 55% speak English well).
Foreign born population: 239 (2.3%)
(85.8% of them are naturalized citizens)
| Here: | 6.2 |
| State: | 6.5 |
| Here: | 4.1 |
| State: | 4.3 |
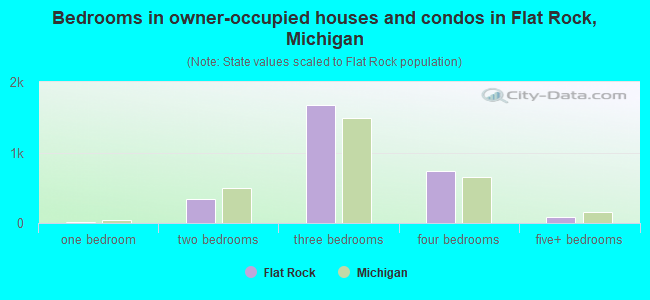
- Bedrooms in owner-occupied houses and condos in Flat Rock, Michigan
- 0no bedroom
- 151 bedroom
- 3362 bedrooms
- 1,6733 bedrooms
- 7324 bedrooms
- 855+ bedrooms
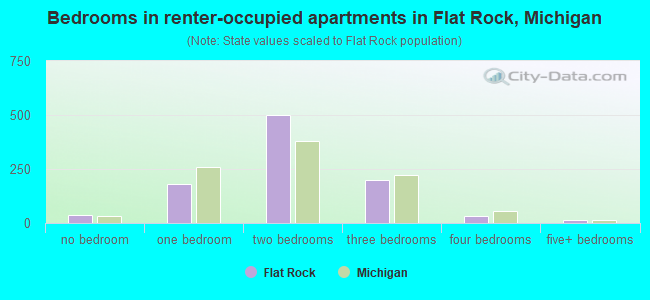
- Bedrooms in renter-occupied apartments in Flat Rock, Michigan
- 36no bedroom
- 1791 bedroom
- 5002 bedrooms
- 2003 bedrooms
- 344 bedrooms
- 135+ bedrooms
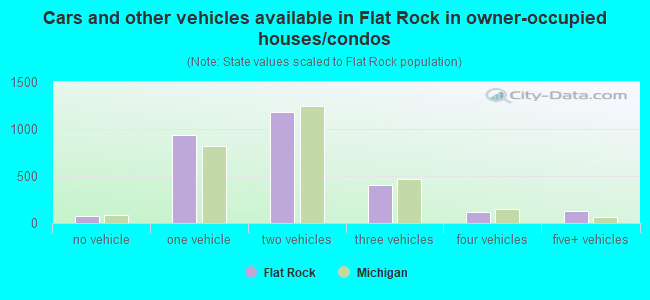
- Cars and other vehicles available in Flat Rock in owner-occupied houses/condos
- 79no vehicle
- 9321 vehicle
- 1,1832 vehicles
- 4003 vehicles
- 1174 vehicles
- 1315+ vehicles
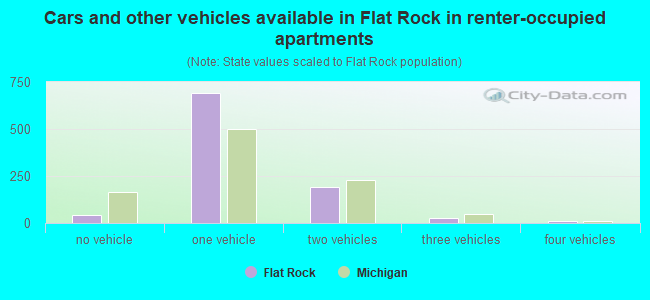
- Cars and other vehicles available in Flat Rock in renter-occupied apartments
- 42no vehicle
- 6901 vehicle
- 1922 vehicles
- 253 vehicles
- 134 vehicles
- 05+ vehicles
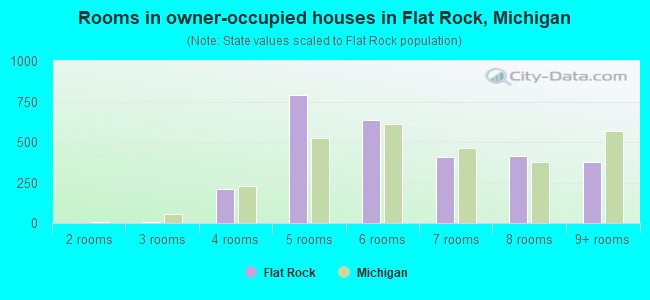
- Rooms in owner-occupied houses in Flat Rock, Michigan
- 01 room
- 02 rooms
- 93 rooms
- 2104 rooms
- 7905 rooms
- 6336 rooms
- 4077 rooms
- 4168 rooms
- 3789+ rooms
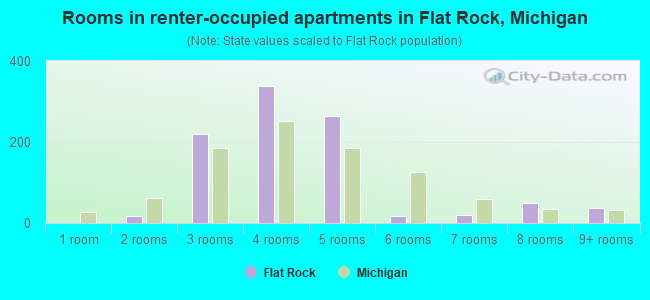
- Rooms in renter-occupied apartments in Flat Rock, Michigan
- 01 room
- 182 rooms
- 2193 rooms
- 3384 rooms
- 2635 rooms
- 176 rooms
- 197 rooms
- 508 rooms
- 379+ rooms
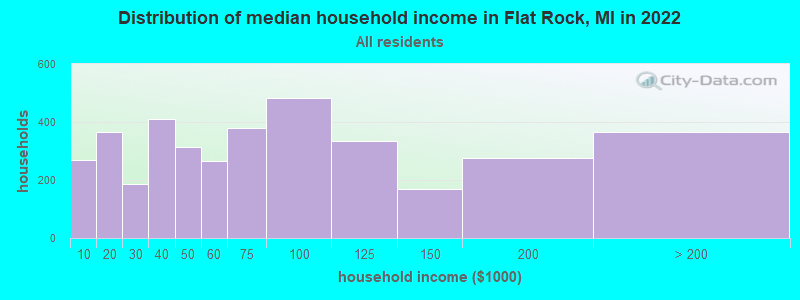
Flat Rock, MI household income distribution

- 270Less than $10,000
- 366$10,000 to $19,999
- 187$20,000 to $29,999
- 411$30,000 to $39,999
- 314$40,000 to $49,999
- 267$50,000 to $59,999
- 379$60,000 to $74,999
- 483$75,000 to $99,999
- 333$100,000 to $124,999
- 169$125,000 to $149,999
- 277$150,000 to $199,999
- 364$200,000 or more
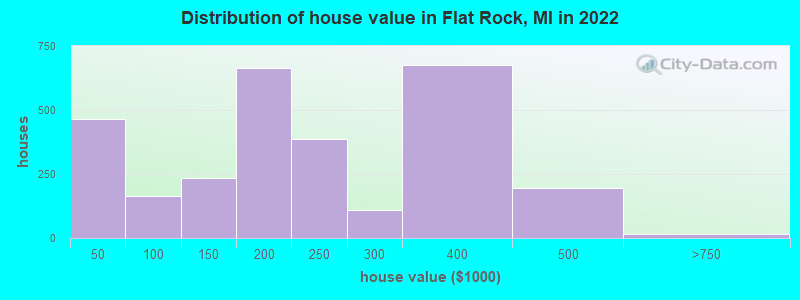
Home value of owner - occupied houses in 2022 in Flat Rock, MI
-
- 133Less than $10,000
- 71$10,000 to $14,999
- 82$15,000 to $19,999
- 84$20,000 to $24,999
- 54$25,000 to $29,999
- 36$40,000 to $49,999
- 30$50,000 to $59,999
- 66$70,000 to $79,999
- 13$80,000 to $89,999
- 15$90,000 to $99,999
- 96$100,000 to $124,999
- 139$125,000 to $149,999
- 355$150,000 to $174,999
- 307$175,000 to $199,999
- 387$200,000 to $249,999
- 111$250,000 to $299,999
- 676$300,000 to $399,999
- 195$400,000 to $499,999
- 16$500,000 to $749,999
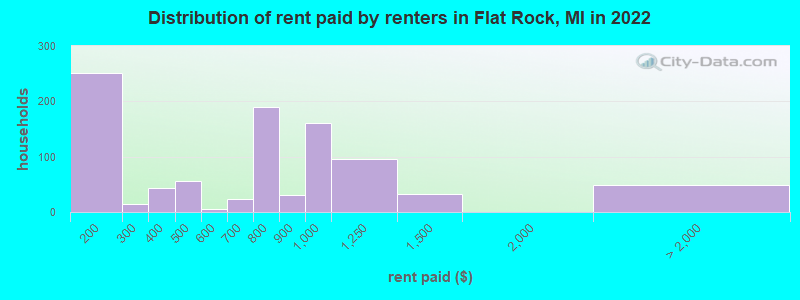
Rent paid by renters in 2022 in Flat Rock, MI
-
- 96$100 to $149
- 156$150 to $199
- 14$250 to $299
- 42$300 to $349
- 43$400 to $449
- 11$450 to $499
- 6$550 to $599
- 23$600 to $649
- 80$700 to $749
- 109$750 to $799
- 29$800 to $899
- 159$900 to $999
- 96$1,000 to $1,249
- 32$1,250 to $1,499
- 5$2,500 to $2,999
- 44No cash rent
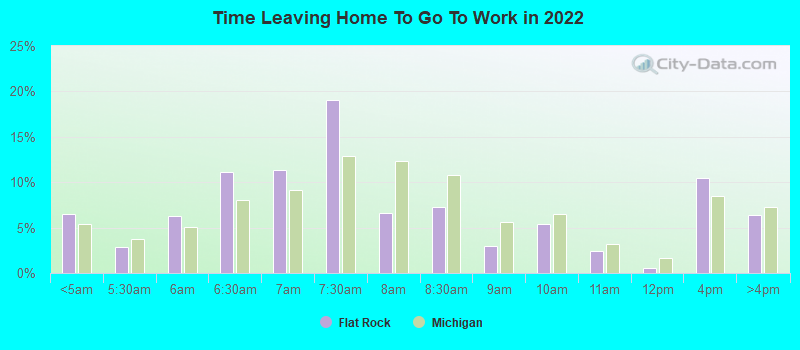
Percentage of workers working in this county: 83.9%
Number of people working at home: 508 (10.6% of all workers)
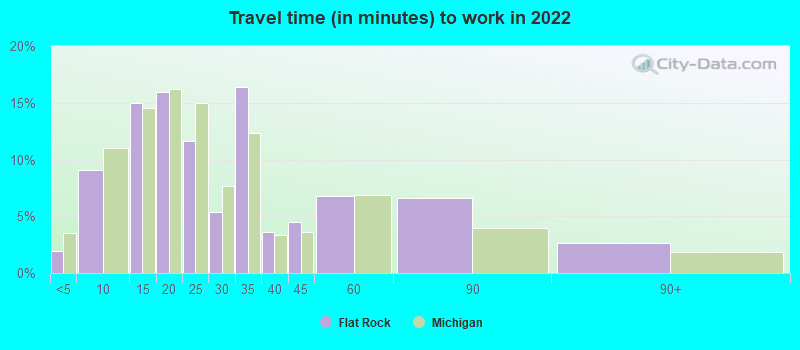
Travel time to work (commute)
- Less than 5 minutes: 132
- 5 to 9 minutes: 408
- 10 to 14 minutes: 352
- 15 to 19 minutes: 477
- 20 to 24 minutes: 591
- 25 to 29 minutes: 527
- 30 to 34 minutes: 534
- 35 to 39 minutes: 180
- 40 to 44 minutes: 190
- 45 to 59 minutes: 292
- 60 to 89 minutes: 346
- 90 or more minutes: 194
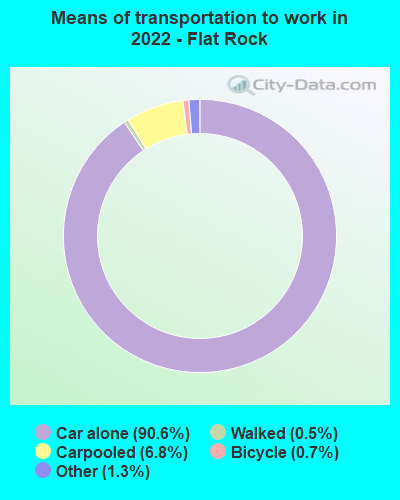
Means of transportation to work:
- Drove a car alone: 4,481 (81.3%)
- Carpooled: 333 (6.0%)
- Taxi: 67 (1.2%)
- Bicycle: 43 (0.8%)
- Walked: 28 (0.5%)
- Worked at home: 508 (9.2%)
- Unemployment by race in 2022
- Unemployment rate for White non-Hispanic residents
- 4.6%Males
- 3.3%Females
- Unemployment rate for Black residents
- 14.6%Females
- Unemployment rate for American Indian and Alaska Native residents
- 100.0%Females
- Unemployment rate for two or more race residents
- 14.1%Males
- 28.9%Females
- Unemployment rate for Hispanic or Latino residents
- 5.7%Males
- 11.8%Females
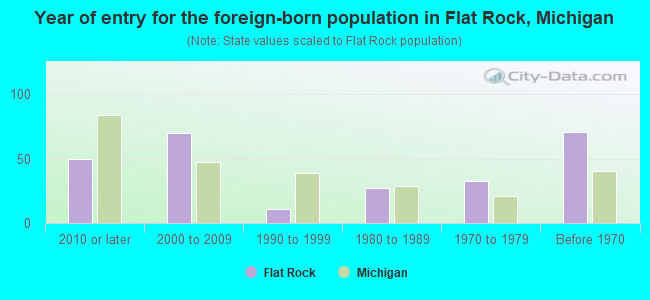
- Year of entry for the foreign-born population in Flat Rock, Michigan
- 502010 or later
- 702000 to 2009
- 111990 to 1999
- 271980 to 1989
- 331970 to 1979
- 71Before 1970

First ancestries reported:
- American: 1,342 (28.0%)
- German: 530 (11.1%)
- Polish: 396 (8.3%)
- Italian: 309 (6.4%)
- English: 273 (5.7%)
- Irish: 145 (3.0%)
- Hungarian: 87 (1.8%)
- Scotch-Irish: 79 (1.6%)
- Serbian: 76 (1.6%)
- French: 74 (1.5%)
- French Canadian: 71 (1.5%)
- European: 52 (1.1%)
- Scottish: 44 (0.9%)
- Welsh: 34 (0.7%)
- Danish: 24 (0.5%)
- Icelander: 23 (0.5%)
- Ukrainian: 23 (0.5%)
- Eastern European: 19 (0.4%)
- Norwegian: 18 (0.4%)
- Portuguese: 13 (0.3%)
- Swedish: 13 (0.3%)
- Canadian: 12 (0.3%)
- Maltese: 11 (0.2%)
- Romanian: 11 (0.2%)
- Czech: 9 (0.2%)
- Slovak: 5 (0.1%)
- Belgian: 4 (0.08%)
- Czechoslovakian: 3 (0.06%)
- Dutch: 3 (0.06%)
- Latvian: 3 (0.06%)
Most common places of birth for foreign-born residents (%):
| Flat Rock: | 35.9% (84) |
| Michigan: | 10.9% (75,965) |
| Flat Rock: | 12.8% (30) |
| Michigan: | 1.2% (8,563) |
| Flat Rock: | 11.5% (27) |
| Michigan: | 5.0% (35,052) |
| Flat Rock: | 6.8% (16) |
| Michigan: | 2.3% (16,126) |
| Flat Rock: | 6.0% (14) |
| Michigan: | 0.1% (670) |
| Flat Rock: | 4.7% (11) |
| Michigan: | 1.1% (7,792) |
| Flat Rock: | 3.4% (8) |
| Michigan: | 0.1% (1,030) |
| Flat Rock: | 2.6% (6) |
| Michigan: | 1.5% (10,596) |
Place of birth for U.S.-born residents:
- This state: 8,624
- Other state: 1,336
- Northeast: 193
- Midwest: 511
- South: 374
- West: 264
94.5% of Flat Rock residents lived in the same house 1 years ago.
Out of people who lived in different houses, 43.9% lived in this county.
Out of people who lived in different counties, 80.3% lived in Michigan.
| Flat Rock: | 94.5% |
| State average: | 88.4% |
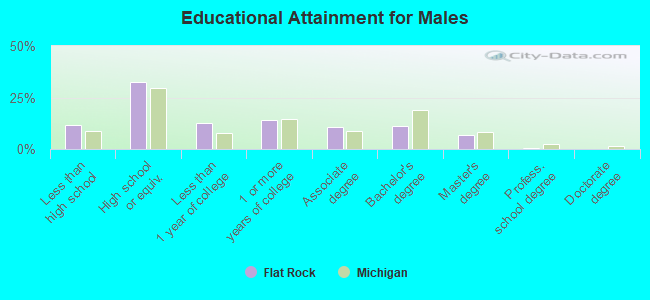
Education attainment for males 25 years and older:
- No schooling: 21
- Nursery to 4th grade: 0
- 5th and 6th grade: 0
- 7th and 8th grade: 0
- 9th grade: 50
- 10th grade: 114
- 11th grade: 11
- 12th grade, no diploma: 144
- High school graduate (or equivalency): 970
- Less than 1 year of college: 381
- Some college more than 1 year, no degree: 423
- Associate degree: 311
- Bachelor's degree: 327
- Master's degree: 198
- Professional school degree: 21
- Doctorate degree: 7
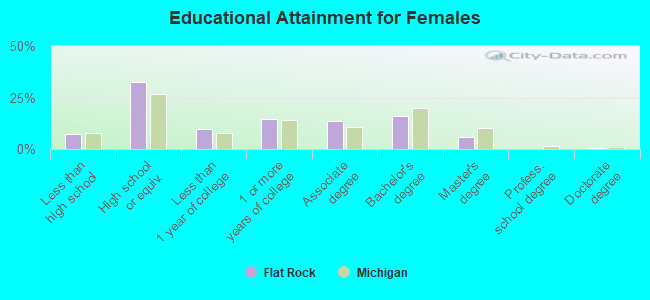
Education attainment for females 25 years and older:
- No schooling: 26
- Nursery to 4th grade: 0
- 5th and 6th grade: 0
- 7th and 8th grade: 0
- 9th grade: 24
- 10th grade: 67
- 11th grade: 37
- 12th grade, no diploma: 117
- High school graduate (or equivalency): 1,181
- Less than 1 year of college: 343
- Some college more than 1 year, no degree: 535
- Associate degree: 485
- Bachelor's degree: 579
- Master's degree: 214
- Professional school degree: 0
- Doctorate degree: 10
Housing units in structures:
- One, detached: 2,387
- One, attached: 18
- Two: 103
- 3 or 4: 219
- 5 to 9: 416
- 10 to 19: 92
- 50 or more: 54
- Mobile homes: 825
Median worth of mobile homes: $22,320
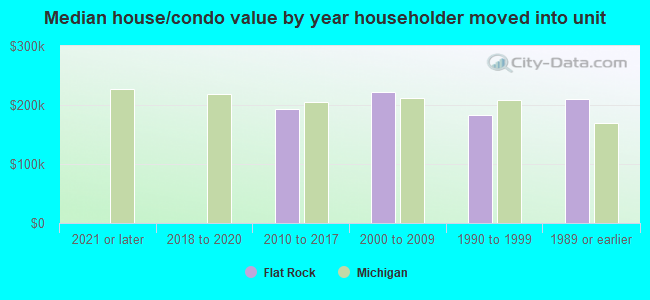
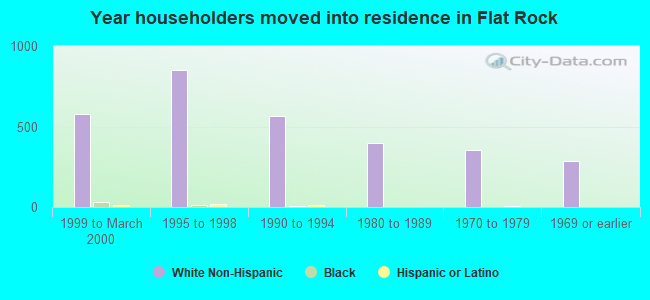
House/condo owner moved in on average 8 years ago
Renter moved in on average 6 years ago
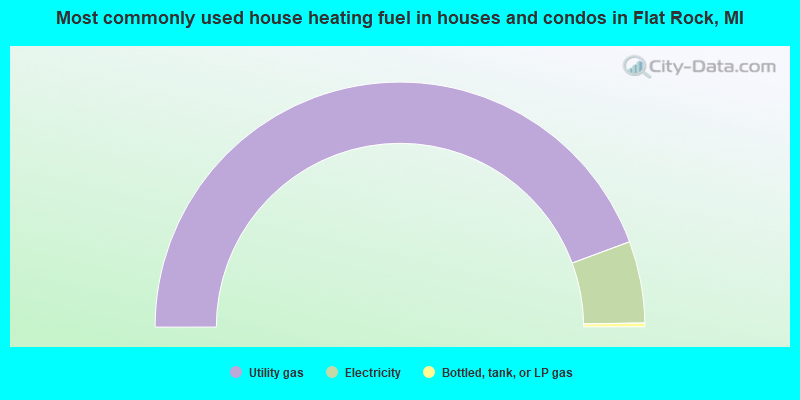
- 88.6%Utility gas
- 10.8%Electricity
- 0.5%Bottled, tank, or LP gas
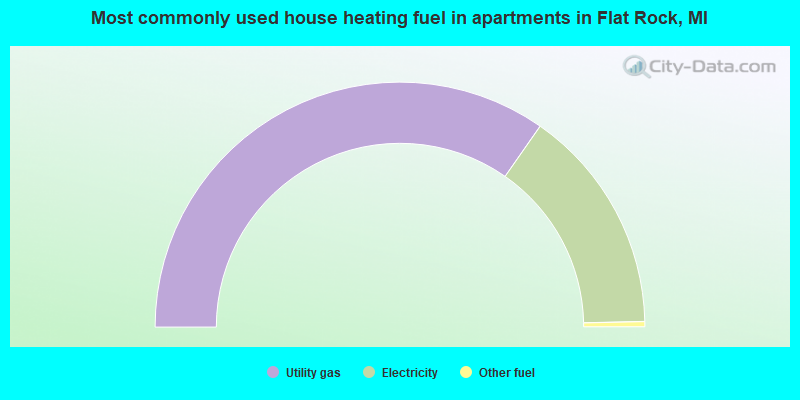
- 69.4%Utility gas
- 29.9%Electricity
- 0.7%Other fuel
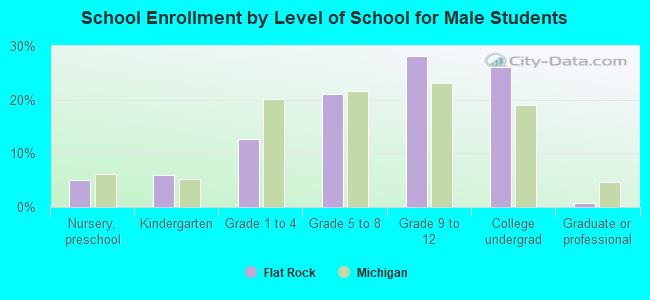
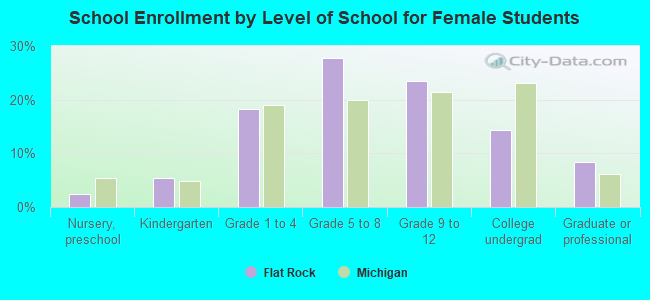
Private vs. public school enrollment:
| Here: | 3.7% |
| Michigan: | 12.4% |
| Here: | 8.3% |
| Michigan: | 9.8% |
| Here: | 22.0% |
| Michigan: | 14.9% |