Fond du Lac, WI (Wisconsin) Houses and Residents
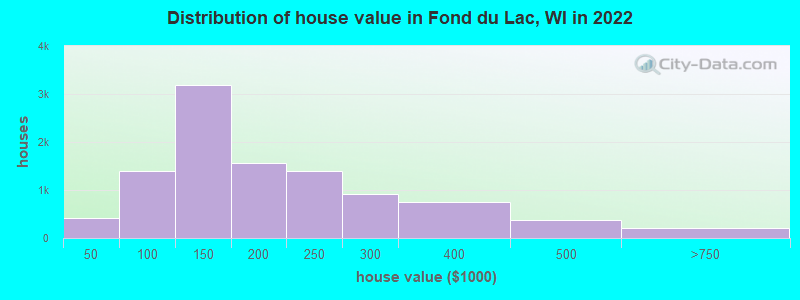
Estimated median house or condo value in 2022: $167,461 (it was $89,900 in 2000 )
Fond du Lac:
$167,461Wisconsin:
$252,800
Lower value quartile - upper value quartile: $111,520 - $257,647Mean price in 2022: Detached houses: $219,803 Here:
$219,803State:
$308,468
Townhouses or other attached units: $231,759 Here:
$231,759State:
$265,873
In 2-unit structures: $148,336 Here:
$148,336State:
$203,667
In 3-to-4-unit structures: $158,724 Here:
$158,724State:
$216,833
In 5-or-more-unit structures: $216,472 Here:
$216,472State:
$280,537
Mobile homes: $80,098 Here:
$80,098State:
$79,042
Total population: 42,917 (Urban population: 41,687, Rural population: 609 (all nonfarm) )
Houses: 20,391 (18,745 occupied: 11,064 owner occupied, 8,236 renter occupied )
% of renters here:
43%State:
32%
Housing density: 1,209 houses/condos per square mile
Median price asked for vacant for-sale houses and condos in 2022: $100,847.
Median contract rent in 2022: $728 (lower quartile is $602, upper quartile is $914)
Median rent asked for vacant for-rent units in 2022: $971
Median gross rent in Fond du Lac, WI in 2022: $880
Housing units in Fond du Lac with a mortgage: 6,256 (857 second mortgage, 8 home equity loan, 682 both second mortgage and home equity loan )Houses without a mortgage: 106
Median household income for houses/condos with a mortgage: $86,265
Median household income for apartments without a mortgage: $64,081
Median monthly housing costs: $912
Data:
Median house or condo value ($)
Median house or condo value ($ change since 2000)
Median house or condo value ($) - White
Median house or condo value ($) - Black or African American
Median house or condo value ($) - Asian
Median house or condo value ($) - Hispanic or Latino
Median house or condo value ($) - American Indian and Alaska Native
Median house or condo value ($) - Multirace
Median house or condo value ($) - Other Race
Median price asked for mobile homes ($)
Household density (households per square mile)
Mean house or condo value by units in structure - 1, detached ($)
Mean house or condo value by units in structure - 1, attached ($)
Mean house or condo value by units in structure - 2 ($)
Mean house or condo value by units in structure by units in structure - 3 or 4 ($)
Mean house or condo value by units in structure - 5 or more ($)
Mean house or condo value by units in structure - Boat, RV, van, etc. ($)
Mean house or condo value by units in structure - Mobile home ($)
Median contract rent ($)
Median contract rent - Lower quartile ($)
Median contract rent - Upper quartile ($)
Median gross rent ($)
Urban houses (%)
Rural houses (%)
Houses occupied (%)
Houses occupied (% change since 2000)
Houses owner occupied (%)
Houses owner occupied (% change since 2000)
Houses renter occupied (%)
Houses renter occupied (% change since 2000)
Vacant housing units - For rent (%)
Vacant housing units - For rent (% change since 2000)
Vacant housing units - For sale only (%)
Vacant housing units - For sale only (% change since 2000)
Vacant housing units - Rented or sold, not occupied (%)
Vacant housing units - Rented or sold, not occupied (% change since 2000)
Vacant housing units - For seasonal, recreational, or occasional use (%)
Vacant housing units - For seasonal, recreational, or occasional use (% change since 2000)
Vacant housing units - For migrant workers (%)
Vacant housing units - For migrant workers (% change since 2000)
Vacant housing units - Other vacant (%)
Vacant housing units - Other vacant (% change since 2000)
Median monthly housing costs ($)
Median household income for houses/condos with a mortgage ($)
Median household income for houses/condos without a mortgage ($)
Median household income ($)
Median household income ($) - White
Median household income ($) - Black or African American
Median household income ($) - Asian
Median household income ($) - Hispanic or Latino
Median household income ($) - American Indian and Alaska Native
Median household income ($) - Multirace
Median household income ($) - Other Race
Mortgage status - with mortgage (%)
Mortgage status - with second mortgage (%)
Mortgage status - with home equity loan (%)
Mortgage status - with both second mortgage and home equity loan (%)
Mortgage status - without a mortgage (%)
Median year house/condo built
Median year apartment built
Household type by relationship - Male householder living alone (%)
Household type by relationship - Male householder not living alone (%)
Household type by relationship - Female householder living alone (%)
Household type by relationship - Female householder not living alone (%)
Household type by relationship - Opposite-Sex spouse (%)
Household type by relationship - Same-Sex spouse (%)
Household type by relationship - Opposite-Sex unmarried partner (%)
Household type by relationship - Same-Sex unmarried partner (%)
Household type by relationship - In group quarters (%)
Size of family households - 2-person household (%)
Size of family households - 3-person household (%)
Size of family households - 4-person household (%)
Size of family households - 5-person household (%)
Size of family households - 6-person household (%)
Size of family households - 7-or-more-person household (%)
Size of nonfamily households - 1-person household (%)
Size of nonfamily households - 2-person household (%)
Size of nonfamily households - 3-person household (%)
Size of nonfamily households - 4-person household (%)
Size of nonfamily households - 5-person household (%)
Size of nonfamily households - 6-person household (%)
Size of nonfamily households - 7-or-moreperson household (%)
Year house built - Built 2010 or later (%)
Year house built - Built 2000 to 2009 (%)
Year house built - Built 1990 to 1999 (%)
Year house built - Built 1980 to 1989 (%)
Year house built - Built 1970 to 1979 (%)
Year house built - Built 1960 to 1969 (%)
Year house built - Built 1950 to 1959 (%)
Year house built - Built 1940 to 1949 (%)
Year house built - Built 1939 or earlier (%)
Median number of rooms in houses and condos
Median number of rooms in apartments
Median number of bedrooms in owner occupied houses
Mean number of bedrooms in owner occupied houses
Median number of bedrooms in renter occupied houses
Mean number of bedrooms in renter occupied houses
Median number of vehichles in owner occupied houses
Mean number of vehichles in owner occupied houses
Median number of vehichles in renter occupied houses
Mean number of vehichles in renter occupied houses
Rooms in owner-occupied houses - 1 room (%)
Rooms in owner-occupied houses - 2 rooms (%)
Rooms in owner-occupied houses - 3 rooms (%)
Rooms in owner-occupied houses - 4 rooms (%)
Rooms in owner-occupied houses - 5 rooms (%)
Rooms in owner-occupied houses - 6 rooms (%)
Rooms in owner-occupied houses - 7 rooms (%)
Rooms in owner-occupied houses - 8 rooms (%)
Rooms in owner-occupied houses - 9+ rooms (%)
Rooms in renter-occupied houses - 1 room (%)
Rooms in renter-occupied houses - 2 rooms (%)
Rooms in renter-occupied houses - 3 rooms (%)
Rooms in renter-occupied houses - 4 rooms (%)
Rooms in renter-occupied houses - 5 rooms (%)
Rooms in renter-occupied houses - 6 rooms (%)
Rooms in renter-occupied houses - 7 rooms (%)
Rooms in renter-occupied houses - 8 rooms (%)
Rooms in renter-occupied houses - 9+ rooms (%)
Bedrooms in owner-occupied houses - no bedrooms (%)
Bedrooms in owner-occupied houses - 1 bedroom (%)
Bedrooms in owner-occupied houses - 2 bedrooms (%)
Bedrooms in owner-occupied houses - 3 bedrooms (%)
Bedrooms in owner-occupied houses - 4 bedrooms (%)
Bedrooms in owner-occupied houses - 5+ bedrooms (%)
Bedrooms in renter-occupied houses - no bedrooms (%)
Bedrooms in renter-occupied houses - 1 bedroom (%)
Bedrooms in renter-occupied houses - 2 bedrooms (%)
Bedrooms in renter-occupied houses - 3 bedrooms (%)
Bedrooms in renter-occupied houses - 4 bedrooms (%)
Bedrooms in renter-occupied houses - 5+ bedrooms (%)
Vehicles available in owner-occupied houses - no vehicle available (%)
Vehicles available in owner-occupied houses - 1 vehicle available(%)
Vehicles available in owner-occupied houses - 2 Vehicles available (%)
Vehicles available in owner-occupied houses - 3 Vehicles available (%)
Vehicles available in owner-occupied houses - 4 Vehicles available (%)
Vehicles available in owner-occupied houses - 5+ Vehicles available (%)
Vehicles available in renter-occupied houses - no vehicle available (%)
Vehicles available in renter-occupied houses - 1 vehicle available (%)
Vehicles available in renter-occupied houses - 2 Vehicles available (%)
Vehicles available in renter-occupied houses - 3 Vehicles available (%)
Vehicles available in renter-occupied houses - 4 Vehicles available (%)
Vehicles available in renter-occupied houses - 5+ Vehicles available (%)
Housing units in structures - 1, detached (%)
Housing units in structures - 1, attached (%)
Housing units in structures - 2 (%)
Housing units in structures - 3 or 4 (%)
Housing units in structures - 5 to 9 (%)
Housing units in structures - 10 to 19 (%)
Housing units in structures - 20 to 49 (%)
Housing units in structures - 50 or more (%)
Housing units in structures - Mobile home (%)
Housing units in structures - Boat, RV, van, etc. (%)
Housing units in structures - Owners - 1, detached (%)
Housing units in structures - Owners - 1, attached (%)
Housing units in structures - Owners - 2 (%)
Housing units in structures - Owners - 3 or 4 (%)
Housing units in structures - Owners - 5 to 9 (%)
Housing units in structures - Owners - 10 to 19 (%)
Housing units in structures - Owners - 20 to 49 (%)
Housing units in structures - Owners - 50 or more (%)
Housing units in structures - Owners - Mobile home (%)
Housing units in structures - Owners - Boat, RV, van, etc. (%)
Housing units in structures - Renters - 1, detached (%)
Housing units in structures - Renters - 1, attached (%)
Housing units in structures - Renters - 2 (%)
Housing units in structures - Renters - 3 or 4 (%)
Housing units in structures - Renters - 5 to 9 (%)
Housing units in structures - Renters - 10 to 19 (%)
Housing units in structures - Renters - 20 to 49 (%)
Housing units in structures - Renters - 50 or more (%)
Housing units in structures - Renters - Mobile home (%)
Housing units in structures - Renters - Boat, RV, van, etc. (%)
House/condo owner moved in on average (years ago)
Renter moved in on average (years ago)
Year householder moved into unit - Moved in 1999 to March 2000 (%)
Year householder moved into unit - Moved in 1999 to March 2000 (%) - White
Year householder moved into unit - Moved in 1999 to March 2000 (%) - Black or African American
Year householder moved into unit - Moved in 1999 to March 2000 (%) - Asian
Year householder moved into unit - Moved in 1999 to March 2000 (%) - Hispanic or Latino
Year householder moved into unit - Moved in 1999 to March 2000 (%) - American Indian and Alaska Native
Year householder moved into unit - Moved in 1999 to March 2000 (%) - Multirace
Year householder moved into unit - Moved in 1999 to March 2000 (%) - Other Race
Year householder moved into unit - Moved in 1995 to 1998 (%)
Year householder moved into unit - Moved in 1995 to 1998 (%) - White
Year householder moved into unit - Moved in 1995 to 1998 (%) - Black or African American
Year householder moved into unit - Moved in 1995 to 1998 (%) - Asian
Year householder moved into unit - Moved in 1995 to 1998 (%) - Hispanic or Latino
Year householder moved into unit - Moved in 1995 to 1998 (%) - American Indian and Alaska Native
Year householder moved into unit - Moved in 1995 to 1998 (%) - Multirace
Year householder moved into unit - Moved in 1995 to 1998 (%) - Other Race
Year householder moved into unit - Moved in 1990 to 1994 (%)
Year householder moved into unit - Moved in 1990 to 1994 (%) - White
Year householder moved into unit - Moved in 1990 to 1994 (%) - Black or African American
Year householder moved into unit - Moved in 1990 to 1994 (%) - Asian
Year householder moved into unit - Moved in 1990 to 1994 (%) - Hispanic or Latino
Year householder moved into unit - Moved in 1990 to 1994 (%) - American Indian and Alaska Native
Year householder moved into unit - Moved in 1990 to 1994 (%) - Multirace
Year householder moved into unit - Moved in 1990 to 1994 (%) - Other Race
Year householder moved into unit - Moved in 1980 to 1989 (%)
Year householder moved into unit - Moved in 1980 to 1989 (%) - White
Year householder moved into unit - Moved in 1980 to 1989 (%) - Black or African American
Year householder moved into unit - Moved in 1980 to 1989 (%) - Asian
Year householder moved into unit - Moved in 1980 to 1989 (%) - Hispanic or Latino
Year householder moved into unit - Moved in 1980 to 1989 (%) - American Indian and Alaska Native
Year householder moved into unit - Moved in 1980 to 1989 (%) - Multirace
Year householder moved into unit - Moved in 1980 to 1989 (%) - Other Race
Year householder moved into unit - Moved in 1970 to 1979 (%)
Year householder moved into unit - Moved in 1970 to 1979 (%) - White
Year householder moved into unit - Moved in 1970 to 1979 (%) - Black or African American
Year householder moved into unit - Moved in 1970 to 1979 (%) - Asian
Year householder moved into unit - Moved in 1970 to 1979 (%) - Hispanic or Latino
Year householder moved into unit - Moved in 1970 to 1979 (%) - American Indian and Alaska Native
Year householder moved into unit - Moved in 1970 to 1979 (%) - Multirace
Year householder moved into unit - Moved in 1970 to 1979 (%) - Other Race
Year householder moved into unit - Moved in 1969 or earlier (%)
Year householder moved into unit - Moved in 1969 or earlier (%) - White
Year householder moved into unit - Moved in 1969 or earlier (%) - Black or African American
Year householder moved into unit - Moved in 1969 or earlier (%) - Asian
Year householder moved into unit - Moved in 1969 or earlier (%) - Hispanic or Latino
Year householder moved into unit - Moved in 1969 or earlier (%) - American Indian and Alaska Native
Year householder moved into unit - Moved in 1969 or earlier (%) - Multirace
Year householder moved into unit - Moved in 1969 or earlier (%) - Other Race
Housing units lacking complete plumbing facilities (%)
Housing units lacking complete kitchen facilities (%)
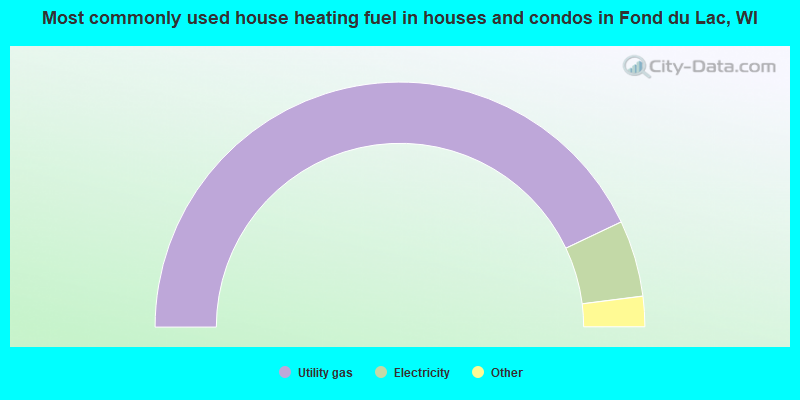
House heating fuel used in houses and condos - Utility gas (%)
House heating fuel used in houses and condos - Bottled, tank, or LP gas (%)
House heating fuel used in houses and condos - Electricity (%)
House heating fuel used in houses and condos - Fuel oil, kerosene, etc. (%)
House heating fuel used in houses and condos - Coal or coke (%)
House heating fuel used in houses and condos - Wood (%)
House heating fuel used in houses and condos - Solar energy (%)
House heating fuel used in houses and condos - Other fuel (%)
House heating fuel used in houses and condos - No fuel used (%)
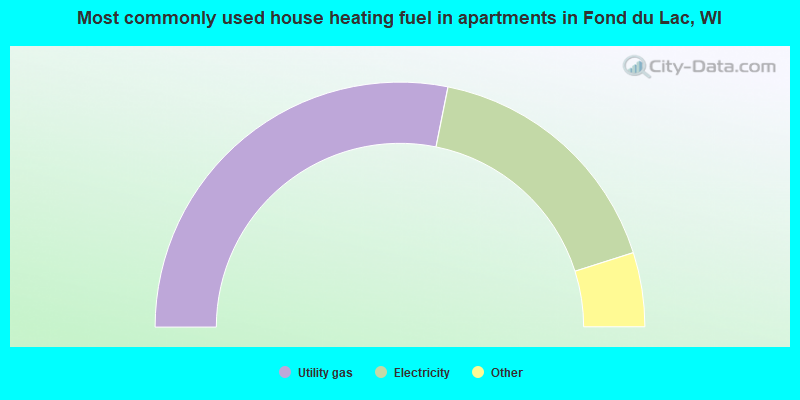
House heating fuel used in apartments - Utility gas (%)
House heating fuel used in apartments - Bottled, tank, or LP gas (%)
House heating fuel used in apartments - Electricity (%)
House heating fuel used in apartments - Fuel oil, kerosene, etc. (%)
House heating fuel used in apartments - Coal or coke (%)
House heating fuel used in apartments - Wood (%)
House heating fuel used in apartments - Solar energy (%)
House heating fuel used in apartments - Other fuel (%)
House heating fuel used in apartments - No fuel used (%)
Median year house/condo built: 1962Median year apartment built: 1980Household type by relationship:
Households: 44,445
Male householders: 9,313 (3,602 living alone ), Female householders: 9,254 (3,633 living alone )7,359 spouses (7,256 opposite-sex spouses ), 1,587 unmarried partners , (1,570 opposite-sex unmarried partners ), 11,560 children (10,654 natural , 180 adopted , 725 stepchildren ), 415 grandchildren , 470 brothers or sisters , 303 parents , 86 foster children , 681 other relatives , 986 non-relatives In group quarters: 2,425
Size of family households: 5,170 2-persons , 2,090 3-persons , 1,947 4-persons , 599 5-persons , 327 6-persons , 426 7-or-more-persons .
Size of nonfamily households: 7,464 1-person , 923 2-persons , 141 3-persons , 12 4-persons .
5,520 married couples with children. single-parent households (789 men , 1,916 women ).
91.6% of residents of Fond du Lac speak English at home. of residents speak Spanish at home (55% speak English very well , 27% speak English well , 12% speak English not well , 6% don't speak English at all ).of residents speak other Indo-European language at home (68% speak English very well , 22% speak English well , 7% speak English not well , 2% don't speak English at all ).of residents speak Asian or Pacific Island language at home (35% speak English very well , 18% speak English well , 47% speak English not well ).of residents speak other language at home (100% speak English very well ).
Foreign born population: 2,699 (6.1%)of them are naturalized citizens )
Median number of rooms in houses and condos:
Median number of rooms in apartments
Owner-occupied Renter-occupied
Rooms in owner-occupied houses in Fond du Lac, Wisconsin
0 1 room 54 2 rooms 128 3 rooms 902 4 rooms 2,314 5 rooms 2,967 6 rooms 2,341 7 rooms 1,039 8 rooms 1,321 9+ rooms
Rooms in renter-occupied apartments in Fond du Lac, Wisconsin
621 1 room 378 2 rooms 1,656 3 rooms 2,395 4 rooms 1,231 5 rooms 1,082 6 rooms 420 7 rooms 225 8 rooms 229 9+ rooms
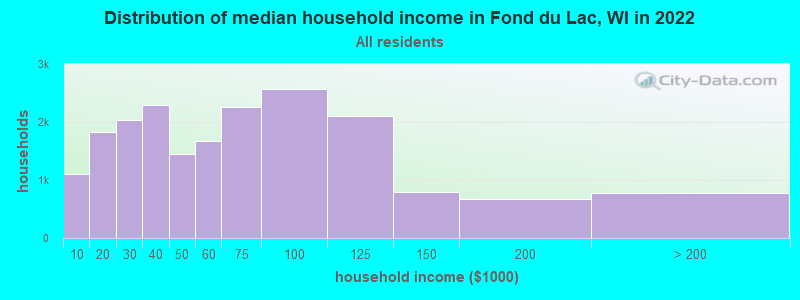
Fond du Lac, WI household income distribution 1,112 Less than $10,0001,835 $10,000 to $19,9992,032 $20,000 to $29,9992,292 $30,000 to $39,9991,452 $40,000 to $49,9991,670 $50,000 to $59,9992,263 $60,000 to $74,9992,564 $75,000 to $99,9992,096 $100,000 to $124,999801 $125,000 to $149,999681 $150,000 to $199,999773 $200,000 or more
Home value of owner - occupied houses in 2022 in Fond du Lac, WI 130 Less than $10,00041 $10,000 to $14,99988 $15,000 to $19,99967 $20,000 to $24,99944 $30,000 to $34,9998 $35,000 to $39,99929 $40,000 to $49,99939 $50,000 to $59,99987 $60,000 to $69,999234 $70,000 to $79,999535 $80,000 to $89,999470 $90,000 to $99,9992,080 $100,000 to $124,9991,099 $125,000 to $149,999914 $150,000 to $174,999639 $175,000 to $199,9991,396 $200,000 to $249,999926 $250,000 to $299,999743 $300,000 to $399,999381 $400,000 to $499,999177 $500,000 to $749,99914 $750,000 to $999,9991 $1,000,000 to $1,499,99914 $2,000,000 or moreRent paid by renters in 2022 in Fond du Lac, WI 18 Less than $10054 $100 to $14920 $150 to $19959 $200 to $249134 $250 to $299289 $300 to $349102 $350 to $399278 $400 to $449299 $450 to $499328 $500 to $549380 $550 to $599845 $600 to $649765 $650 to $6991,167 $700 to $749568 $750 to $7991,039 $800 to $899725 $900 to $999660 $1,000 to $1,249118 $1,250 to $1,499153 $1,500 to $1,999137 $3,500 or more344 No cash rent
Percentage of workers working in this county: 76.3%Number of people working at home: 2,119 (10.1% of all workers )
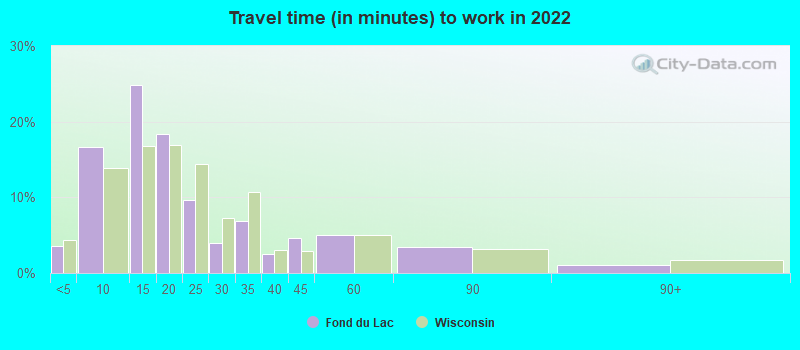
Travel time to work (commute)
Less than 5 minutes: 9835 to 9 minutes: 4,08810 to 14 minutes: 4,37015 to 19 minutes: 3,53020 to 24 minutes: 1,38225 to 29 minutes: 54630 to 34 minutes: 1,44235 to 39 minutes: 56840 to 44 minutes: 57345 to 59 minutes: 55060 to 89 minutes: 69490 or more minutes: 303
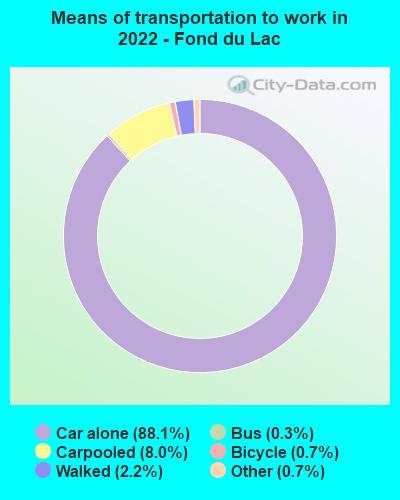
Means of transportation to work:
Drove a car alone: 22,601 (79.6%)Carpooled: 2,281 (8.0%)Bus : 69 (0.2%)Ferryboat: 4 (0.0%)Taxi: 203 (0.7%)Bicycle: 164 (0.6%)Walked: 568 (2.0%)Worked at home: 2,121 (7.5%)
Unemployment by race in 2022
Unemployment rate for White non-Hispanic residents 3.6% Males4.1% FemalesUnemployment rate for Black residents 0.5% Males23.8% FemalesUnemployment rate for Asian residents 0.9% Males47.5% FemalesUnemployment rate for other race residents 2.3% MalesUnemployment rate for two or more race residents 16.9% Males2.1% FemalesUnemployment rate for Hispanic or Latino residents 1.0% Males
Year of entry for the foreign-born population in Fond du Lac, Wisconsin
1,085 2010 or later 817 2000 to 2009 145 1990 to 1999 214 1980 to 1989 111 1970 to 1979 182 Before 1970
First ancestries reported:
German: 9,577 (45.6%)
American: 2,085 (9.9%)
Irish: 901 (4.3%)
English: 581 (2.8%)
Polish: 446 (2.1%)
European: 416 (2.0%)
Dutch: 368 (1.8%)
Norwegian: 344 (1.6%)
Italian: 294 (1.4%)
French: 183 (0.9%)
Scotch-Irish: 172 (0.8%)
Swedish: 113 (0.5%)
African: 99 (0.5%)
Liberian: 92 (0.4%)
Scottish: 90 (0.4%)
Czech: 75 (0.4%)
Eastern European: 74 (0.4%)
Greek: 72 (0.3%)
Brazilian: 53 (0.3%)
Russian: 50 (0.2%)
French Canadian: 43 (0.2%)
Scandinavian: 42 (0.2%)
Luxembourger: 40 (0.2%)
Hungarian: 32 (0.2%)
Yugoslavian: 29 (0.1%)
Turkish: 28 (0.1%)
Finnish: 23 (0.1%)
Northern European: 21 (0.1%)
Canadian: 17 (0.08%)
Danish: 15 (0.07%)
Croatian: 13 (0.06%)
Austrian: 12 (0.06%)
Portuguese: 8 (0.04%)
Welsh: 8 (0.04%)
Ukrainian: 7 (0.03%)
British: 4 (0.02%) Most common places of birth for foreign-born residents (%): Mexico Fond du Lac:
33.5% (741)Wisconsin:
29.5% (87,182)
Taiwan Fond du Lac:
22.6% (501)Wisconsin:
0.7% (1,987)
China, excluding Hong Kong and Taiwan Fond du Lac:
10.2% (225)Wisconsin:
5.1% (15,165)
Burma (Myanmar) Fond du Lac:
6.1% (135)Wisconsin:
1.4% (4,016)
Liberia Fond du Lac:
6.0% (132)Wisconsin:
0.2% (574)
Philippines Fond du Lac:
2.8% (62)Wisconsin:
3.1% (9,280)
United Kingdom, excluding England and Scotland Fond du Lac:
2.5% (55)Wisconsin:
0.8% (2,427)
Brazil Fond du Lac:
2.4% (54)Wisconsin:
0.7% (2,101)
Germany Fond du Lac:
1.7% (38)Wisconsin:
3.0% (8,773)
Canada Fond du Lac:
1.6% (35)Wisconsin:
2.3% (6,747)
Place of birth for U.S.-born residents:
This state: 33,876Other state: 7,861Northeast: 422Midwest: 3,521South: 2,031West: 2,011 81.6% of Fond du Lac residents lived in the same house 1 years ago.
Out of people who lived in different houses, 35.2% lived in this county.
Out of people who lived in different counties, 80.9% lived in Wisconsin.
Fond du Lac:
81.6%State average:
87.7%
Education attainment for males 25 years and older:
No schooling: 272Nursery to 4th grade: 255th and 6th grade: 97th and 8th grade: 689th grade: 14410th grade: 21211th grade: 15512th grade, no diploma: 412High school graduate (or equivalency): 5,469Less than 1 year of college: 959Some college more than 1 year, no degree: 2,155Associate degree: 1,924Bachelor's degree: 1,480Master's degree: 925Professional school degree: 32Doctorate degree: 227
Education attainment for females 25 years and older:
No schooling: 80Nursery to 4th grade: 1225th and 6th grade: 87th and 8th grade: 2209th grade: 5410th grade: 13811th grade: 30612th grade, no diploma: 326High school graduate (or equivalency): 5,836Less than 1 year of college: 1,026Some college more than 1 year, no degree: 2,385Associate degree: 1,980Bachelor's degree: 2,664Master's degree: 776Professional school degree: 100Doctorate degree: 124
Housing units in structures:
One, detached: 12,187One, attached: 770Two: 1,5353 or 4: 5535 to 9: 1,68510 to 19: 1,85320 to 49: 92750 or more: 502Mobile homes: 375Median worth of mobile homes: $18,247
Housing units lacking complete plumbing facilities in 2022: 0.5%Housing units lacking complete kitchen facilities in 2022: 3.6%House/condo owner moved in on average 13 years ago
Renter moved in on average 2 years ago
Private vs. public school enrollment:
Students in private schools in grades 1 to 8 (elementary and middle school): 652 Here:
15.1%Wisconsin:
16.7%
Students in private schools in grades 9 to 12 (high school): 431 Here:
17.4%Wisconsin:
12.5%
Students in private undergraduate colleges: 922 Here:
44.9%Wisconsin:
17.5%