Housing density: 1,619 houses/condos per square mile
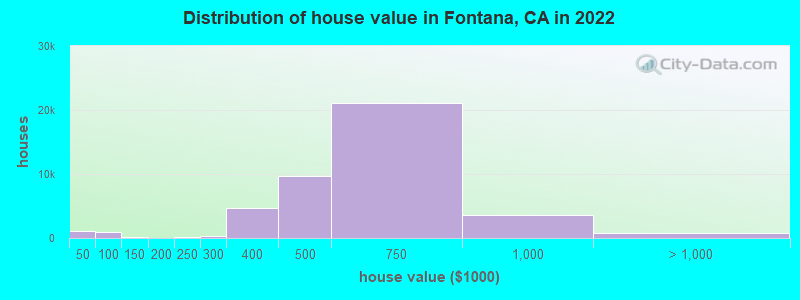
Median price asked for vacant for-sale houses and condos in 2022: $459,837.
Median contract rent in 2022: $1,500 (lower quartile is $1,138, upper quartile is $1,954)
Median rent asked for vacant for-rent units in 2022: $1,333
Median gross rent in Fontana, CA in 2022: $1,674
Housing units in Fontana with a mortgage: 29,940 (2,586 second mortgage, 52 home equity loan, 1,784 both second mortgage and home equity loan) Houses without a mortgage: 98
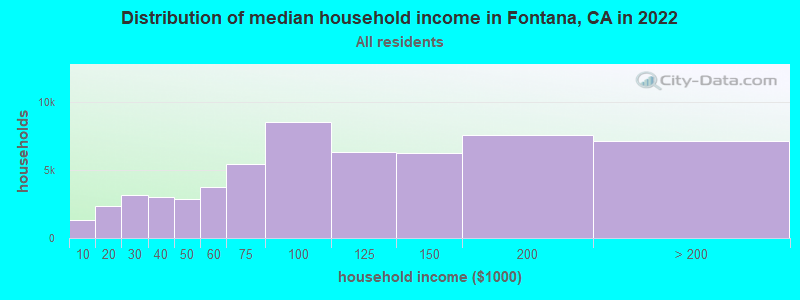
Median household income for houses/condos with a mortgage: $118,248
Median household income for apartments without a mortgage: $79,013
32,753 married couples with children.
10,206 single-parent households (4,323 men, 5,883 women).
38.5% of residents of Fontana speak English at home.
52.9% of residents speak Spanish at home (68% speak English very well, 13% speak English well, 12% speak English not well, 6% don't speak English at all).
2.0% of residents speak other Indo-European language at home (71% speak English very well, 26% speak English well, 2% speak English not well, 1% don't speak English at all).
4.5% of residents speak Asian or Pacific Island language at home (63% speak English very well, 24% speak English well, 10% speak English not well, 3% don't speak English at all).
2.2% of residents speak other language at home (81% speak English very well, 12% speak English well, 7% speak English not well).
Foreign born population: 61,734 (29.1%)
(51.6% of them are naturalized citizens)
Percentage of workers working in this county: 74.2% Number of people working at home: 11,176 (11.0% of all workers)
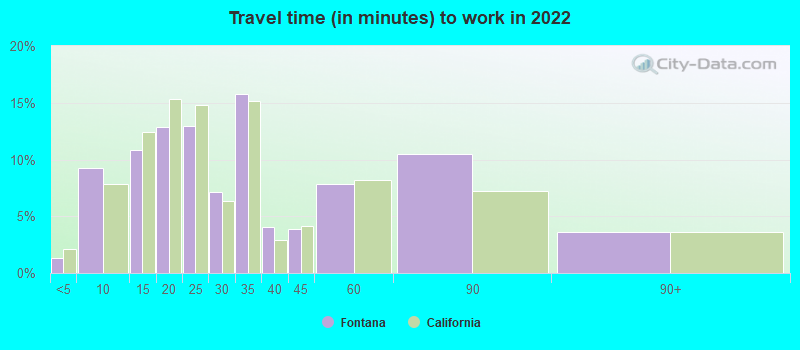
Travel time to work (commute)
Less than 5 minutes: 934
5 to 9 minutes: 5,763
10 to 14 minutes: 8,160
15 to 19 minutes: 11,108
20 to 24 minutes: 15,813
25 to 29 minutes: 6,669
30 to 34 minutes: 14,005
35 to 39 minutes: 2,719
40 to 44 minutes: 3,937
45 to 59 minutes: 6,727
60 to 89 minutes: 8,946
90 or more minutes: 5,991
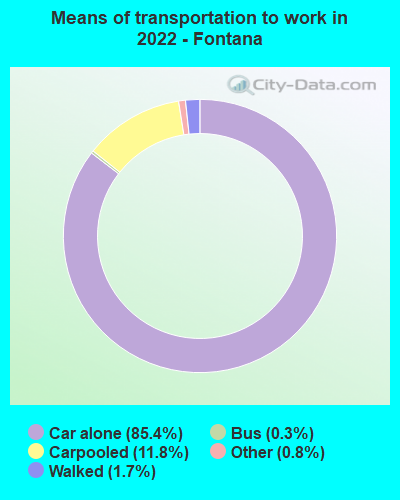
Means of transportation to work:
Drove a car alone: 61,611 (74.0%)
Carpooled: 8,485 (10.2%)
Bus: 202 (0.2%)
Taxi: 609 (0.7%)
Walked: 1,214 (1.5%)
Worked at home: 11,176 (13.4%)
Unemployment by race in 2022
Unemployment rate for White non-Hispanic residents
4.7%Males
5.4%Females
Unemployment rate for Black residents
9.8%Males
28.7%Females
Unemployment rate for American Indian and Alaska Native residents
10.8%Males
5.3%Females
Unemployment rate for Asian residents
3.8%Males
3.6%Females
Unemployment rate for other race residents
5.0%Males
4.1%Females
Unemployment rate for two or more race residents
7.5%Males
7.1%Females
Unemployment rate for Hispanic or Latino residents
5.8%Males
4.3%Females
Year of entry for the foreign-born population in Fontana, California
9,5782010 or later
10,1462000 to 2009
14,2501990 to 1999
13,2521980 to 1989
8,1281970 to 1979
3,534Before 1970
First ancestries reported:
American: 2,535 (1.8%)
German: 1,825 (1.3%)
European: 1,137 (0.8%)
Irish: 959 (0.7%)
English: 873 (0.6%)
Italian: 767 (0.5%)
Egyptian: 716 (0.5%)
Syrian: 633 (0.4%)
Nigerian: 412 (0.3%)
African: 374 (0.3%)
Arab: 308 (0.2%)
Jamaican: 236 (0.2%)
Lebanese: 192 (0.1%)
Portuguese: 166 (0.1%)
Cape Verdean: 156 (0.1%)
Dutch: 153 (0.1%)
Kenyan: 142 (0.10%)
Scotch-Irish: 127 (0.09%)
Belizean: 124 (0.09%)
Palestinian: 123 (0.09%)
Polish: 112 (0.08%)
Norwegian: 101 (0.07%)
Scandinavian: 95 (0.07%)
Russian: 93 (0.07%)
Iraqi: 88 (0.06%)
French: 88 (0.06%)
Ethiopian: 86 (0.06%)
Jordanian: 79 (0.06%)
Swedish: 75 (0.05%)
Haitian: 68 (0.05%)
British: 57 (0.04%)
Iranian: 52 (0.04%)
Scottish: 51 (0.04%)
Moroccan: 49 (0.03%)
Welsh: 48 (0.03%)
Icelander: 45 (0.03%)
Ghanaian: 30 (0.02%)
Austrian: 30 (0.02%)
Afghan: 28 (0.02%)
Finnish: 24 (0.02%)
Lithuanian: 23 (0.02%)
Greek: 23 (0.02%)
Canadian: 23 (0.02%)
French Canadian: 22 (0.02%)
Danish: 22 (0.02%)
Armenian: 22 (0.02%)
Ugandan: 19 (0.01%)
Croatian: 18 (0.01%)
Bahamian: 18 (0.01%)
Belgian: 17 (0.01%)
Czech: 11 (0.01%)
Ukrainian: 11 (0.01%)
Latvian: 10 (0.01%)
Eastern European: 10 (0.01%)
Most common places of birth for foreign-born residents (%):
Mexico
Fontana:
61.6% (35,597)
California:
37.2% (3,881,193)
Philippines
Fontana:
6.6% (3,822)
California:
7.8% (818,297)
El Salvador
Fontana:
4.6% (2,630)
California:
4.2% (440,287)
Guatemala
Fontana:
3.6% (2,075)
California:
2.8% (290,436)
China, excluding Hong Kong and Taiwan
Fontana:
2.2% (1,250)
California:
6.6% (684,672)
Vietnam
Fontana:
2.2% (1,244)
California:
4.9% (512,335)
Honduras
Fontana:
1.6% (905)
California:
0.6% (66,590)
Place of birth for U.S.-born residents:
This state: 135,787
Other state: 12,884
Northeast: 1,822
Midwest: 3,699
South: 3,941
West: 3,422
91.8% of Fontana residents lived in the same house 1 years ago. Out of people who lived in different houses, 39.4% lived in this county. Out of people who lived in different counties, 86.3% lived in California.
Fontana:
91.8%
State average:
88.9%
Education attainment for males 25 years and older:
No schooling: 2,937
Nursery to 4th grade: 643
5th and 6th grade: 3,060
7th and 8th grade: 1,086
9th grade: 2,371
10th grade: 874
11th grade: 668
12th grade, no diploma: 2,346
High school graduate (or equivalency): 23,237
Less than 1 year of college: 4,136
Some college more than 1 year, no degree: 9,830
Associate degree: 4,623
Bachelor's degree: 9,872
Master's degree: 2,506
Professional school degree: 650
Doctorate degree: 444
Education attainment for females 25 years and older:
No schooling: 2,472
Nursery to 4th grade: 1,643
5th and 6th grade: 3,479
7th and 8th grade: 861
9th grade: 2,209
10th grade: 675
11th grade: 1,219
12th grade, no diploma: 1,665
High school graduate (or equivalency): 16,411
Less than 1 year of college: 3,258
Some college more than 1 year, no degree: 8,302
Associate degree: 5,391
Bachelor's degree: 11,804
Master's degree: 4,725
Professional school degree: 560
Doctorate degree: 159
Housing units in structures:
One, detached: 45,276
One, attached: 2,149
Two: 144
3 or 4: 1,628
5 to 9: 1,446
10 to 19: 2,202
20 to 49: 1,020
50 or more: 3,084
Mobile homes: 1,537
Median worth of mobile homes: $52,800
Housing units lacking complete kitchen facilities in 2022: 0.9%
House/condo owner moved in on average 11 years ago