Jump to a detailed profile or search site with Google Custom Search

Foothill Farms, CA (California) Houses and Residents

Estimated median house or condo value in 2022: $396,778 (it was $113,300 in 2000)
Foothill Farms:

$396,778
California:

$715,900
Lower value quartile - upper value quartile: $306,458 - $446,224

Mean price in 2022:

Detached houses: $389,168
Here:

$389,168
State:

$988,808

Townhouses or other attached units: $278,555
Here:

$278,555
State:

$838,546

In 2-unit structures: $430,338
Here:

$430,338
State:

$1,138,100

In 3-to-4-unit structures: $221,882
Here:

$221,882
State:

$824,253

In 5-or-more-unit structures: $231,671
Here:

$231,671
State:

$730,996

Mobile homes: $157,521
Here:

$157,521
State:

$184,506

Total population: 33,121 (Urban population: 17,393, Rural population: 0)

Houses: 13,215 (12,877 occupied: 6,513 owner occupied, 6,339 renter occupied)

% of renters here:

49%
State:

44%

Housing density: 5,709 houses/condos per square mile

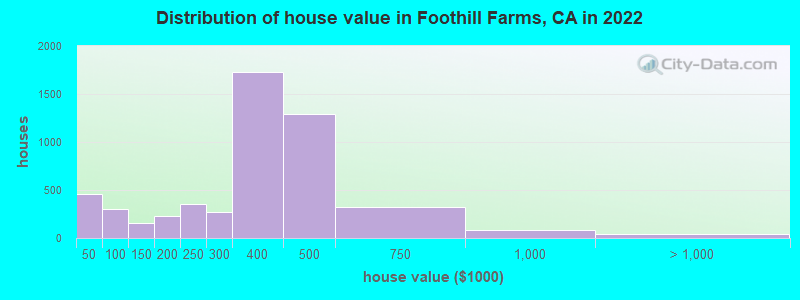
Median price asked for vacant for-sale houses and condos in 2022: $2,193,027.

Median contract rent in 2022: $1,406 (lower quartile is $1,110, upper quartile is $1,724)


Median rent asked for vacant for-rent units in 2022: $1,835


Median gross rent in Foothill Farms, CA in 2022: $1,583

Housing units in Foothill Farms with a mortgage: 4,480 (364 second mortgage, 0 home equity loan, 220 both second mortgage and home equity loan)
Houses without a mortgage: 9

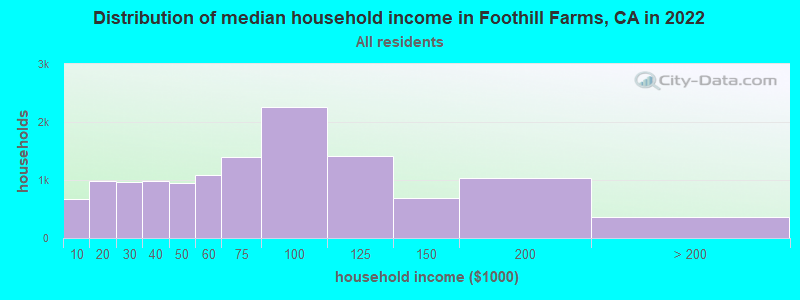
Median household income for houses/condos with a mortgage: $85,998

Median household income for apartments without a mortgage: $72,662

Median monthly housing costs: $1,476

Compare current foreclosures near Foothill Farms, CA:

Check out more offers near Foothill Farms, CA.
Powered by Foreclosure.com

Settings
X
Data:
Loading data...
Based on 2000-2022 data
Loading data...

123
Hide US histogram

Foothill Farms, California Age and Sex of Residents
Median year house/condo built: 1975

Median year apartment built: 1978

Household type by relationship:

Households: 37,753
  • Male householders: 6,034 (1,274 living alone), Female householders: 6,657 (1,502 living alone)
  • 5,060 spouses (4,940 opposite-sex spouses), 1,203 unmarried partners, (1,182 opposite-sex unmarried partners), 13,146 children (12,190 natural, 464 adopted, 491 stepchildren), 812 grandchildren, 747 brothers or sisters, 894 parents, 530 foster children, 1,012 other relatives, 1,571 non-relatives
  • In group quarters: 80

Size of family households: 3,059 2-persons, 2,230 3-persons, 1,773 4-persons, 1,043 5-persons, 508 6-persons, 339 7-or-more-persons.

Size of nonfamily households: 2,910 1-person, 803 2-persons, 80 3-persons, 18 4-persons, 18 5-persons, 22 6-persons.

5,230 married couples with children.
3,695 single-parent households (863 men, 2,832 women).

62.1% of residents of Foothill Farms speak English at home.
14.6% of residents speak Spanish at home (68% speak English very well, 14% speak English well, 14% speak English not well, 4% don't speak English at all).
16.0% of residents speak other Indo-European language at home (42% speak English very well, 32% speak English well, 22% speak English not well, 4% don't speak English at all).
4.8% of residents speak Asian or Pacific Island language at home (65% speak English very well, 22% speak English well, 13% speak English not well).
2.3% of residents speak other language at home (47% speak English very well, 34% speak English well, 19% speak English not well).

Foreign born population: 9,380 (24.8%)
(44.1% of them are naturalized citizens)

Median number of rooms in houses and condos:
Here:

5.8
State:

6.0

Median number of rooms in apartments
Here:

4.0
State:

3.9

Owner-occupied Renter-occupied
Bedrooms in owner-occupied houses and condos in Foothill Farms, California
  • Bedrooms in owner-occupied houses and condos in Foothill Farms, California
  • 26no bedroom
  • 221 bedroom
  • 1,1582 bedrooms
  • 3,5883 bedrooms
  • 1,5944 bedrooms
  • 1255+ bedrooms
Bedrooms in renter-occupied apartments in Foothill Farms, California
  • Bedrooms in renter-occupied apartments in Foothill Farms, California
  • 129no bedroom
  • 8411 bedroom
  • 3,7572 bedrooms
  • 1,0913 bedrooms
  • 4874 bedrooms
  • 355+ bedrooms
Owner-occupied Renter-occupied
Cars and other vehicles available in Foothill Farms in owner-occupied houses/condos
  • Cars and other vehicles available in Foothill Farms in owner-occupied houses/condos
  • 185no vehicle
  • 1,8681 vehicle
  • 2,7912 vehicles
  • 1,2973 vehicles
  • 2844 vehicles
  • 875+ vehicles
Cars and other vehicles available in Foothill Farms in renter-occupied apartments
  • Cars and other vehicles available in Foothill Farms in renter-occupied apartments
  • 714no vehicle
  • 2,4461 vehicle
  • 2,2112 vehicles
  • 6403 vehicles
  • 2784 vehicles
  • 505+ vehicles
Owner-occupied Renter-occupied
Rooms in owner-occupied houses in Foothill Farms, California
  • Rooms in owner-occupied houses in Foothill Farms, California
  • 261 room
  • 82 rooms
  • 3593 rooms
  • 6604 rooms
  • 1,5785 rooms
  • 2,1446 rooms
  • 8157 rooms
  • 6308 rooms
  • 2939+ rooms
Rooms in renter-occupied apartments in Foothill Farms, California
  • Rooms in renter-occupied apartments in Foothill Farms, California
  • 1021 room
  • 2662 rooms
  • 1,2783 rooms
  • 2,4004 rooms
  • 1,1255 rooms
  • 5606 rooms
  • 3617 rooms
  • 1338 rooms
  • 1159+ rooms
Year house built
Median 2022 house/condo value by year built
Median house/condo value by year householder moved into unit
Breakdown of mean house values by ages of householders
Owners and renters by unit type in Foothill Farms, CA
  • Foothill Farms, CA household income distribution

  • Distribution of median household income in Foothill Farms, CA in 2022
  • 673Less than $10,000
  • 978$10,000 to $19,999
  • 966$20,000 to $29,999
  • 978$30,000 to $39,999
  • 948$40,000 to $49,999
  • 1,092$50,000 to $59,999
  • 1,400$60,000 to $74,999
  • 2,264$75,000 to $99,999
  • 1,415$100,000 to $124,999
  • 682$125,000 to $149,999
  • 1,036$150,000 to $199,999
  • 361$200,000 or more
  • Home value of owner - occupied houses in 2022 in Foothill Farms, CA

  • Distribution of house value in Foothill Farms, CA in 2022
  • 91Less than $10,000
  • 19$15,000 to $19,999
  • 101$25,000 to $29,999
  • 26$30,000 to $34,999
  • 70$35,000 to $39,999
  • 147$40,000 to $49,999
  • 30$50,000 to $59,999
  • 52$60,000 to $69,999
  • 37$70,000 to $79,999
  • 26$80,000 to $89,999
  • 8$90,000 to $99,999
  • 90$100,000 to $124,999
  • 63$125,000 to $149,999
  • 227$150,000 to $174,999
  • 5$175,000 to $199,999
  • 352$200,000 to $249,999
  • 269$250,000 to $299,999
  • 1,732$300,000 to $399,999
  • 1,288$400,000 to $499,999
  • 327$500,000 to $749,999
  • 79$750,000 to $999,999
  • 22$1,000,000 to $1,499,999
  • 15$2,000,000 or more
  • Rent paid by renters in 2022 in Foothill Farms, CA

  • Distribution of rent paid by renters in Foothill Farms, CA in 2022
  • 17Less than $100
  • 35$150 to $199
  • 15$200 to $249
  • 34$250 to $299
  • 105$300 to $349
  • 8$350 to $399
  • 18$400 to $449
  • 12$450 to $499
  • 35$500 to $549
  • 30$550 to $599
  • 29$650 to $699
  • 32$700 to $749
  • 21$750 to $799
  • 161$800 to $899
  • 452$900 to $999
  • 1,113$1,000 to $1,249
  • 1,405$1,250 to $1,499
  • 1,982$1,500 to $1,999
  • 379$2,000 to $2,499
  • 19$2,500 to $2,999
  • 118No cash rent
Time Leaving Home To Go To Work in 2022

Percentage of workers working in this county: 75.9%
Number of people working at home: 2,357 (14.6% of all workers)

Travel time (in minutes) to work in 2022

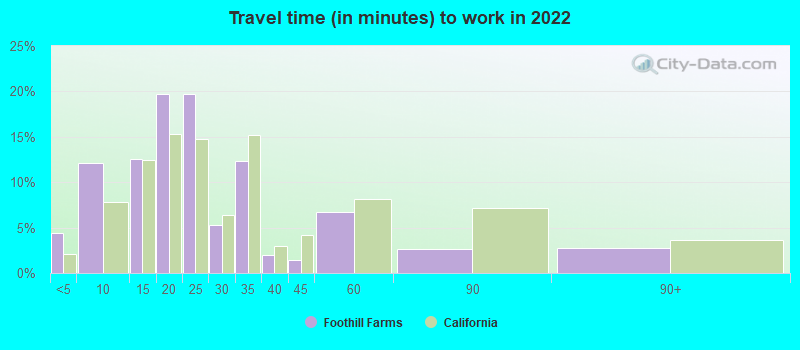
Travel time to work (commute)

  • Less than 5 minutes: 253
  • 5 to 9 minutes: 869
  • 10 to 14 minutes: 1,438
  • 15 to 19 minutes: 2,111
  • 20 to 24 minutes: 2,642
  • 25 to 29 minutes: 1,107
  • 30 to 34 minutes: 2,224
  • 35 to 39 minutes: 658
  • 40 to 44 minutes: 378
  • 45 to 59 minutes: 635
  • 60 to 89 minutes: 713
  • 90 or more minutes: 462
Means of transportation to work in 2022 - Foothill Farms

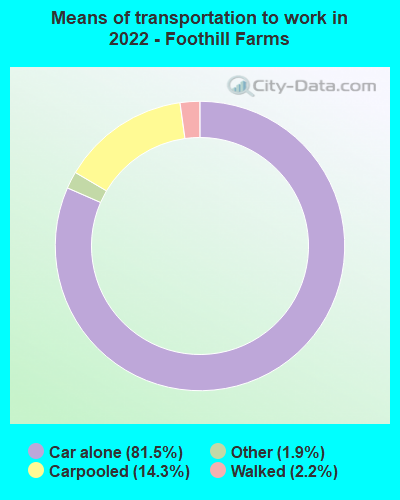
Means of transportation to work:

  • Drove a car alone: 2,172 (46.9%)
  • Carpooled: 393 (8.5%)
  • Taxi: 62 (1.3%)
  • Walked: 66 (1.4%)
  • Worked at home: 2,357 (50.9%)
Class of Workers in 2022
  • Unemployment by race in 2022
  • Unemployment rate for White non-Hispanic residents
  • 7.6%Males
  • 4.8%Females
  • Unemployment rate for Black residents
  • 6.3%Males
  • 9.1%Females
  • Unemployment rate for American Indian and Alaska Native residents
  • 13.0%Females
  • Unemployment rate for Asian residents
  • 6.6%Males
  • 5.4%Females
  • Unemployment rate for other race residents
  • 5.2%Males
  • 10.9%Females
  • Unemployment rate for two or more race residents
  • 8.7%Males
  • 9.9%Females
  • Unemployment rate for Hispanic or Latino residents
  • 2.8%Males
  • 6.2%Females
Year of entry for the foreign-born population in Foothill Farms, California
  • Year of entry for the foreign-born population in Foothill Farms, California
  • 4,5632010 or later
  • 2,0712000 to 2009
  • 1,8611990 to 1999
  • 4871980 to 1989
  • 2531970 to 1979
  • 302Before 1970
Ancestries in Foothill Farms, CA

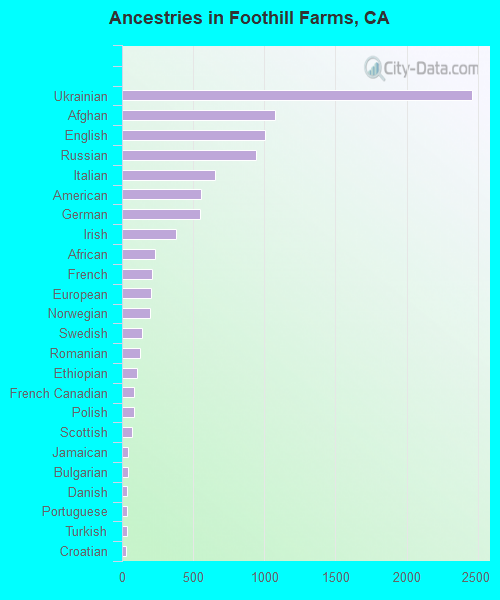
First ancestries reported:

  • Ukrainian: 2,456 (11.4%)
  • Afghan: 1,077 (5.0%)
  • English: 1,002 (4.7%)
  • Russian: 939 (4.4%)
  • Italian: 653 (3.0%)
  • American: 556 (2.6%)
  • German: 550 (2.6%)
  • Irish: 376 (1.7%)
  • African: 234 (1.1%)
  • French: 212 (1.0%)
  • European: 201 (0.9%)
  • Norwegian: 200 (0.9%)
  • Swedish: 144 (0.7%)
  • Romanian: 125 (0.6%)
  • Ethiopian: 108 (0.5%)
  • French Canadian: 85 (0.4%)
  • Polish: 84 (0.4%)
  • Scottish: 71 (0.3%)
  • Jamaican: 42 (0.2%)
  • Bulgarian: 41 (0.2%)
  • Danish: 36 (0.2%)
  • Portuguese: 34 (0.2%)
  • Turkish: 33 (0.2%)
  • Croatian: 31 (0.1%)
  • Palestinian: 22 (0.1%)
  • British: 18 (0.08%)
  • Scotch-Irish: 17 (0.08%)
  • Eastern European: 15 (0.07%)
  • Dutch: 15 (0.07%)
  • Basque: 14 (0.07%)
  • South African: 13 (0.06%)
  • Iranian: 12 (0.06%)
  • Czech: 12 (0.06%)
  • Arab: 12 (0.06%)
  • Greek: 10 (0.05%)
  • Scandinavian: 10 (0.05%)
  • Hungarian: 9 (0.04%)
  • Jordanian: 8 (0.04%)
  • Slavic: 6 (0.03%)
  • Cape Verdean: 6 (0.03%)
  • Armenian: 5 (0.02%)

Most common places of birth for foreign-born residents (%):

Ukraine
Foothill Farms:

22.3% (2,033)
California:

0.6% (60,761)

Afghanistan
Foothill Farms:

19.9% (1,818)
California:

0.5% (53,260)

Mexico
Foothill Farms:

15.9% (1,451)
California:

37.2% (3,881,193)

Philippines
Foothill Farms:

6.6% (598)
California:

7.8% (818,297)

Russia
Foothill Farms:

6.1% (555)
California:

0.7% (71,932)

Syria
Foothill Farms:

3.8% (342)
California:

0.3% (30,949)

Vietnam
Foothill Farms:

3.5% (323)
California:

4.9% (512,335)

Belarus
Foothill Farms:

3.2% (292)
California:

0.1% (11,157)

El Salvador
Foothill Farms:

2.1% (187)
California:

4.2% (440,287)

India
Foothill Farms:

2.0% (178)
California:

5.2% (539,184)

Guatemala
Foothill Farms:

1.9% (176)
California:

2.8% (290,436)

Place of birth for U.S.-born residents:

  • This state: 22,836
  • Other state: 5,044
  • Northeast: 696
  • Midwest: 1,523
  • South: 1,634
  • West: 1,196

88.2% of Foothill Farms residents lived in the same house 1 years ago.
   Out of people who lived in different houses, 40.6% lived in this county.
   Out of people who lived in different counties, 82.4% lived in California.


Foothill Farms:

88.2%
State average:

88.9%

Education attainment for males 25 years and older:

  • No schooling: 335
  • Nursery to 4th grade: 105
  • 5th and 6th grade: 67
  • 7th and 8th grade: 98
  • 9th grade: 76
  • 10th grade: 170
  • 11th grade: 139
  • 12th grade, no diploma: 423
  • High school graduate (or equivalency): 4,029
  • Less than 1 year of college: 848
  • Some college more than 1 year, no degree: 2,419
  • Associate degree: 792
  • Bachelor's degree: 1,547
  • Master's degree: 429
  • Professional school degree: 53
  • Doctorate degree: 44
Educational Attainment for Males

Education attainment for females 25 years and older:

  • No schooling: 410
  • Nursery to 4th grade: 52
  • 5th and 6th grade: 38
  • 7th and 8th grade: 100
  • 9th grade: 73
  • 10th grade: 104
  • 11th grade: 64
  • 12th grade, no diploma: 324
  • High school graduate (or equivalency): 3,679
  • Less than 1 year of college: 1,398
  • Some college more than 1 year, no degree: 2,358
  • Associate degree: 1,538
  • Bachelor's degree: 1,441
  • Master's degree: 464
  • Professional school degree: 50
  • Doctorate degree: 52
Educational Attainment for Females
Foothill Farms marital status for males
Foothill Farms marital status for females

Housing units in structures:

  • One, detached: 7,575
  • One, attached: 913
  • Two: 272
  • 3 or 4: 1,418
  • 5 to 9: 1,054
  • 10 to 19: 805
  • 20 to 49: 174
  • 50 or more: 587
  • Mobile homes: 414

Median worth of mobile homes: $65,226

Housing units lacking complete plumbing facilities in 2022: 0.3%

Housing units lacking complete kitchen facilities in 2022: 0.6%

House/condo owner moved in on average 8 years ago

Renter moved in on average 3 years ago

Year householders moved into residence in Foothill Farms
Houses and condos Apartments
Most commonly used house heating fuel in houses and condos in Foothill Farms, CA
  • 64.1%Utility gas
  • 33.9%Electricity
  • 1.4%Bottled, tank, or LP gas
  • 0.6%Wood
Most commonly used house heating fuel in apartments in Foothill Farms, CA
  • 57.0%Electricity
  • 40.0%Utility gas
  • 2.0%No fuel used
  • 1.0%Bottled, tank, or LP gas

Private vs. public school enrollment:

Students in private schools in grades 1 to 8 (elementary and middle school): 453
Here:

9.4%
California:

10.5%

Students in private schools in grades 9 to 12 (high school): 146
Here:

7.3%
California:

8.5%

Students in private undergraduate colleges: 155
Here:

8.4%
California:

15.9%
School Enrollment by Level of School for Male Students
School Enrollment by Level of School for Female Students
Age and Sex of Sensory-Disabled Noninstitutionalized Residents
Age and Sex of Physically-Disabled Noninstitutionalized Residents
Age and Sex of Mentally-Disabled Noninstitutionalized Residents
Age and Sex of Self-Care Disabled Noninstitutionalized Residents
Age and Sex of Go-Outside-Home Disabled Noninstitutionalized Residents
Age and Sex of Noninstitutionalized Residents with Employment Disability