Forest Acres, SC (South Carolina) Houses and Residents
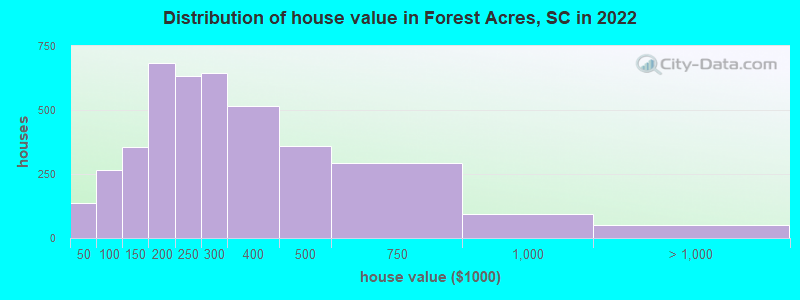
Estimated median house or condo value in 2022: $261,170 (it was $119,300 in 2000 )
Forest Acres:
$261,170South Carolina:
$254,600
Lower value quartile - upper value quartile: $176,407 - $364,791Mean price in 2022: Detached houses: $349,235 Here:
$349,235State:
$368,255
Townhouses or other attached units: $293,591 Here:
$293,591State:
$292,023
In 3-to-4-unit structures: $81,120 Here:
$81,120State:
$230,702
In 5-or-more-unit structures: $182,395 Here:
$182,395State:
$326,361
Total population: 10,603 (All urban)
Houses: 5,330 (4,815 occupied: 3,795 owner occupied, 1,076 renter occupied )
% of renters here:
22%State:
28%
Housing density: 1,162 houses/condos per square mile
Median price asked for vacant for-sale houses and condos in 2022: $226,615.
Median contract rent in 2022: $916 (lower quartile is $787, upper quartile is $1,218)
Median rent asked for vacant for-rent units in 2022: $1,026
Median gross rent in Forest Acres, SC in 2022: $1,119
Housing units in Forest Acres with a mortgage: 2,378 (261 second mortgage, 0 home equity loan, 219 both second mortgage and home equity loan )Houses without a mortgage: 376
Median household income for houses/condos with a mortgage: $97,539
Median household income for apartments without a mortgage: $58,899
Median monthly housing costs: $1,036
Data:
Median house or condo value ($)
Median house or condo value ($ change since 2000)
Median house or condo value ($) - White
Median house or condo value ($) - Black or African American
Median house or condo value ($) - Asian
Median house or condo value ($) - Hispanic or Latino
Median house or condo value ($) - American Indian and Alaska Native
Median house or condo value ($) - Multirace
Median house or condo value ($) - Other Race
Median price asked for mobile homes ($)
Household density (households per square mile)
Mean house or condo value by units in structure - 1, detached ($)
Mean house or condo value by units in structure - 1, attached ($)
Mean house or condo value by units in structure - 2 ($)
Mean house or condo value by units in structure by units in structure - 3 or 4 ($)
Mean house or condo value by units in structure - 5 or more ($)
Mean house or condo value by units in structure - Boat, RV, van, etc. ($)
Mean house or condo value by units in structure - Mobile home ($)
Median contract rent ($)
Median contract rent - Lower quartile ($)
Median contract rent - Upper quartile ($)
Median gross rent ($)
Urban houses (%)
Rural houses (%)
Houses occupied (%)
Houses occupied (% change since 2000)
Houses owner occupied (%)
Houses owner occupied (% change since 2000)
Houses renter occupied (%)
Houses renter occupied (% change since 2000)
Vacant housing units - For rent (%)
Vacant housing units - For rent (% change since 2000)
Vacant housing units - For sale only (%)
Vacant housing units - For sale only (% change since 2000)
Vacant housing units - Rented or sold, not occupied (%)
Vacant housing units - Rented or sold, not occupied (% change since 2000)
Vacant housing units - For seasonal, recreational, or occasional use (%)
Vacant housing units - For seasonal, recreational, or occasional use (% change since 2000)
Vacant housing units - For migrant workers (%)
Vacant housing units - For migrant workers (% change since 2000)
Vacant housing units - Other vacant (%)
Vacant housing units - Other vacant (% change since 2000)
Median monthly housing costs ($)
Median household income for houses/condos with a mortgage ($)
Median household income for houses/condos without a mortgage ($)
Median household income ($)
Median household income ($) - White
Median household income ($) - Black or African American
Median household income ($) - Asian
Median household income ($) - Hispanic or Latino
Median household income ($) - American Indian and Alaska Native
Median household income ($) - Multirace
Median household income ($) - Other Race
Mortgage status - with mortgage (%)
Mortgage status - with second mortgage (%)
Mortgage status - with home equity loan (%)
Mortgage status - with both second mortgage and home equity loan (%)
Mortgage status - without a mortgage (%)
Median year house/condo built
Median year apartment built
Household type by relationship - Male householder living alone (%)
Household type by relationship - Male householder not living alone (%)
Household type by relationship - Female householder living alone (%)
Household type by relationship - Female householder not living alone (%)
Household type by relationship - Opposite-Sex spouse (%)
Household type by relationship - Same-Sex spouse (%)
Household type by relationship - Opposite-Sex unmarried partner (%)
Household type by relationship - Same-Sex unmarried partner (%)
Household type by relationship - In group quarters (%)
Size of family households - 2-person household (%)
Size of family households - 3-person household (%)
Size of family households - 4-person household (%)
Size of family households - 5-person household (%)
Size of family households - 6-person household (%)
Size of family households - 7-or-more-person household (%)
Size of nonfamily households - 1-person household (%)
Size of nonfamily households - 2-person household (%)
Size of nonfamily households - 3-person household (%)
Size of nonfamily households - 4-person household (%)
Size of nonfamily households - 5-person household (%)
Size of nonfamily households - 6-person household (%)
Size of nonfamily households - 7-or-moreperson household (%)
Year house built - Built 2010 or later (%)
Year house built - Built 2000 to 2009 (%)
Year house built - Built 1990 to 1999 (%)
Year house built - Built 1980 to 1989 (%)
Year house built - Built 1970 to 1979 (%)
Year house built - Built 1960 to 1969 (%)
Year house built - Built 1950 to 1959 (%)
Year house built - Built 1940 to 1949 (%)
Year house built - Built 1939 or earlier (%)
Median number of rooms in houses and condos
Median number of rooms in apartments
Median number of bedrooms in owner occupied houses
Mean number of bedrooms in owner occupied houses
Median number of bedrooms in renter occupied houses
Mean number of bedrooms in renter occupied houses
Median number of vehichles in owner occupied houses
Mean number of vehichles in owner occupied houses
Median number of vehichles in renter occupied houses
Mean number of vehichles in renter occupied houses
Rooms in owner-occupied houses - 1 room (%)
Rooms in owner-occupied houses - 2 rooms (%)
Rooms in owner-occupied houses - 3 rooms (%)
Rooms in owner-occupied houses - 4 rooms (%)
Rooms in owner-occupied houses - 5 rooms (%)
Rooms in owner-occupied houses - 6 rooms (%)
Rooms in owner-occupied houses - 7 rooms (%)
Rooms in owner-occupied houses - 8 rooms (%)
Rooms in owner-occupied houses - 9+ rooms (%)
Rooms in renter-occupied houses - 1 room (%)
Rooms in renter-occupied houses - 2 rooms (%)
Rooms in renter-occupied houses - 3 rooms (%)
Rooms in renter-occupied houses - 4 rooms (%)
Rooms in renter-occupied houses - 5 rooms (%)
Rooms in renter-occupied houses - 6 rooms (%)
Rooms in renter-occupied houses - 7 rooms (%)
Rooms in renter-occupied houses - 8 rooms (%)
Rooms in renter-occupied houses - 9+ rooms (%)
Bedrooms in owner-occupied houses - no bedrooms (%)
Bedrooms in owner-occupied houses - 1 bedroom (%)
Bedrooms in owner-occupied houses - 2 bedrooms (%)
Bedrooms in owner-occupied houses - 3 bedrooms (%)
Bedrooms in owner-occupied houses - 4 bedrooms (%)
Bedrooms in owner-occupied houses - 5+ bedrooms (%)
Bedrooms in renter-occupied houses - no bedrooms (%)
Bedrooms in renter-occupied houses - 1 bedroom (%)
Bedrooms in renter-occupied houses - 2 bedrooms (%)
Bedrooms in renter-occupied houses - 3 bedrooms (%)
Bedrooms in renter-occupied houses - 4 bedrooms (%)
Bedrooms in renter-occupied houses - 5+ bedrooms (%)
Vehicles available in owner-occupied houses - no vehicle available (%)
Vehicles available in owner-occupied houses - 1 vehicle available(%)
Vehicles available in owner-occupied houses - 2 Vehicles available (%)
Vehicles available in owner-occupied houses - 3 Vehicles available (%)
Vehicles available in owner-occupied houses - 4 Vehicles available (%)
Vehicles available in owner-occupied houses - 5+ Vehicles available (%)
Vehicles available in renter-occupied houses - no vehicle available (%)
Vehicles available in renter-occupied houses - 1 vehicle available (%)
Vehicles available in renter-occupied houses - 2 Vehicles available (%)
Vehicles available in renter-occupied houses - 3 Vehicles available (%)
Vehicles available in renter-occupied houses - 4 Vehicles available (%)
Vehicles available in renter-occupied houses - 5+ Vehicles available (%)
Housing units in structures - 1, detached (%)
Housing units in structures - 1, attached (%)
Housing units in structures - 2 (%)
Housing units in structures - 3 or 4 (%)
Housing units in structures - 5 to 9 (%)
Housing units in structures - 10 to 19 (%)
Housing units in structures - 20 to 49 (%)
Housing units in structures - 50 or more (%)
Housing units in structures - Mobile home (%)
Housing units in structures - Boat, RV, van, etc. (%)
Housing units in structures - Owners - 1, detached (%)
Housing units in structures - Owners - 1, attached (%)
Housing units in structures - Owners - 2 (%)
Housing units in structures - Owners - 3 or 4 (%)
Housing units in structures - Owners - 5 to 9 (%)
Housing units in structures - Owners - 10 to 19 (%)
Housing units in structures - Owners - 20 to 49 (%)
Housing units in structures - Owners - 50 or more (%)
Housing units in structures - Owners - Mobile home (%)
Housing units in structures - Owners - Boat, RV, van, etc. (%)
Housing units in structures - Renters - 1, detached (%)
Housing units in structures - Renters - 1, attached (%)
Housing units in structures - Renters - 2 (%)
Housing units in structures - Renters - 3 or 4 (%)
Housing units in structures - Renters - 5 to 9 (%)
Housing units in structures - Renters - 10 to 19 (%)
Housing units in structures - Renters - 20 to 49 (%)
Housing units in structures - Renters - 50 or more (%)
Housing units in structures - Renters - Mobile home (%)
Housing units in structures - Renters - Boat, RV, van, etc. (%)
House/condo owner moved in on average (years ago)
Renter moved in on average (years ago)
Year householder moved into unit - Moved in 1999 to March 2000 (%)
Year householder moved into unit - Moved in 1999 to March 2000 (%) - White
Year householder moved into unit - Moved in 1999 to March 2000 (%) - Black or African American
Year householder moved into unit - Moved in 1999 to March 2000 (%) - Asian
Year householder moved into unit - Moved in 1999 to March 2000 (%) - Hispanic or Latino
Year householder moved into unit - Moved in 1999 to March 2000 (%) - American Indian and Alaska Native
Year householder moved into unit - Moved in 1999 to March 2000 (%) - Multirace
Year householder moved into unit - Moved in 1999 to March 2000 (%) - Other Race
Year householder moved into unit - Moved in 1995 to 1998 (%)
Year householder moved into unit - Moved in 1995 to 1998 (%) - White
Year householder moved into unit - Moved in 1995 to 1998 (%) - Black or African American
Year householder moved into unit - Moved in 1995 to 1998 (%) - Asian
Year householder moved into unit - Moved in 1995 to 1998 (%) - Hispanic or Latino
Year householder moved into unit - Moved in 1995 to 1998 (%) - American Indian and Alaska Native
Year householder moved into unit - Moved in 1995 to 1998 (%) - Multirace
Year householder moved into unit - Moved in 1995 to 1998 (%) - Other Race
Year householder moved into unit - Moved in 1990 to 1994 (%)
Year householder moved into unit - Moved in 1990 to 1994 (%) - White
Year householder moved into unit - Moved in 1990 to 1994 (%) - Black or African American
Year householder moved into unit - Moved in 1990 to 1994 (%) - Asian
Year householder moved into unit - Moved in 1990 to 1994 (%) - Hispanic or Latino
Year householder moved into unit - Moved in 1990 to 1994 (%) - American Indian and Alaska Native
Year householder moved into unit - Moved in 1990 to 1994 (%) - Multirace
Year householder moved into unit - Moved in 1990 to 1994 (%) - Other Race
Year householder moved into unit - Moved in 1980 to 1989 (%)
Year householder moved into unit - Moved in 1980 to 1989 (%) - White
Year householder moved into unit - Moved in 1980 to 1989 (%) - Black or African American
Year householder moved into unit - Moved in 1980 to 1989 (%) - Asian
Year householder moved into unit - Moved in 1980 to 1989 (%) - Hispanic or Latino
Year householder moved into unit - Moved in 1980 to 1989 (%) - American Indian and Alaska Native
Year householder moved into unit - Moved in 1980 to 1989 (%) - Multirace
Year householder moved into unit - Moved in 1980 to 1989 (%) - Other Race
Year householder moved into unit - Moved in 1970 to 1979 (%)
Year householder moved into unit - Moved in 1970 to 1979 (%) - White
Year householder moved into unit - Moved in 1970 to 1979 (%) - Black or African American
Year householder moved into unit - Moved in 1970 to 1979 (%) - Asian
Year householder moved into unit - Moved in 1970 to 1979 (%) - Hispanic or Latino
Year householder moved into unit - Moved in 1970 to 1979 (%) - American Indian and Alaska Native
Year householder moved into unit - Moved in 1970 to 1979 (%) - Multirace
Year householder moved into unit - Moved in 1970 to 1979 (%) - Other Race
Year householder moved into unit - Moved in 1969 or earlier (%)
Year householder moved into unit - Moved in 1969 or earlier (%) - White
Year householder moved into unit - Moved in 1969 or earlier (%) - Black or African American
Year householder moved into unit - Moved in 1969 or earlier (%) - Asian
Year householder moved into unit - Moved in 1969 or earlier (%) - Hispanic or Latino
Year householder moved into unit - Moved in 1969 or earlier (%) - American Indian and Alaska Native
Year householder moved into unit - Moved in 1969 or earlier (%) - Multirace
Year householder moved into unit - Moved in 1969 or earlier (%) - Other Race
Housing units lacking complete plumbing facilities (%)
Housing units lacking complete kitchen facilities (%)
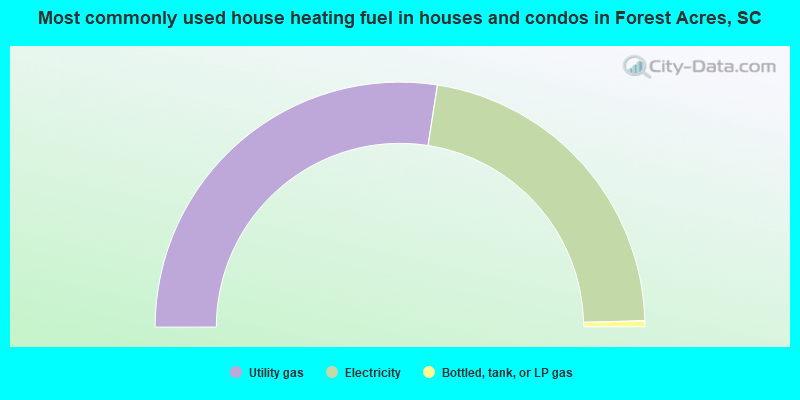
House heating fuel used in houses and condos - Utility gas (%)
House heating fuel used in houses and condos - Bottled, tank, or LP gas (%)
House heating fuel used in houses and condos - Electricity (%)
House heating fuel used in houses and condos - Fuel oil, kerosene, etc. (%)
House heating fuel used in houses and condos - Coal or coke (%)
House heating fuel used in houses and condos - Wood (%)
House heating fuel used in houses and condos - Solar energy (%)
House heating fuel used in houses and condos - Other fuel (%)
House heating fuel used in houses and condos - No fuel used (%)
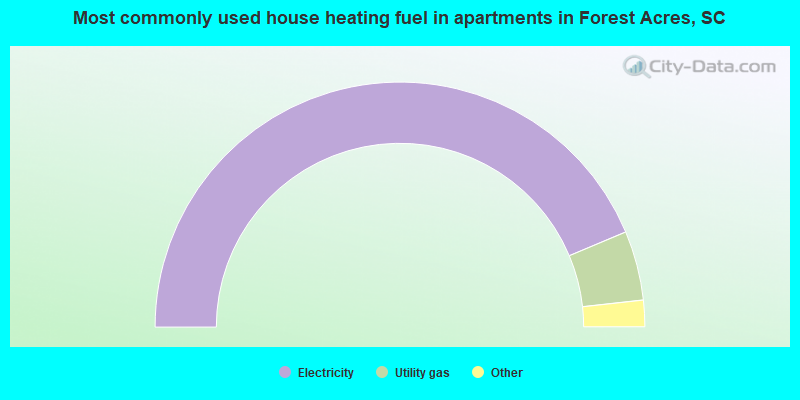
House heating fuel used in apartments - Utility gas (%)
House heating fuel used in apartments - Bottled, tank, or LP gas (%)
House heating fuel used in apartments - Electricity (%)
House heating fuel used in apartments - Fuel oil, kerosene, etc. (%)
House heating fuel used in apartments - Coal or coke (%)
House heating fuel used in apartments - Wood (%)
House heating fuel used in apartments - Solar energy (%)
House heating fuel used in apartments - Other fuel (%)
House heating fuel used in apartments - No fuel used (%)
Median year house/condo built: 1964Median year apartment built: 1965Household type by relationship:
Households: 10,650
Male householders: 2,076 (689 living alone ), Female householders: 2,678 (1,198 living alone )1,981 spouses (1,969 opposite-sex spouses ), 181 unmarried partners , (125 opposite-sex unmarried partners ), 3,069 children (2,903 natural , 70 adopted , 95 stepchildren ), 118 grandchildren , 69 brothers or sisters , 87 parents , 0 foster children , 54 other relatives , 279 non-relatives In group quarters: 53
Size of family households: 1,487 2-persons , 487 3-persons , 456 4-persons , 239 5-persons , 47 6-persons , 29 7-or-more-persons .
Size of nonfamily households: 1,917 1-person , 177 2-persons , 44 3-persons .
1,748 married couples with children. single-parent households (60 men , 576 women ).
94.4% of residents of Forest Acres speak English at home. of residents speak Spanish at home (79% speak English very well , 21% speak English well ).of residents speak other Indo-European language at home (80% speak English very well , 20% speak English well ).of residents speak Asian or Pacific Island language at home (38% speak English very well , 56% speak English well , 7% don't speak English at all ).of residents speak other language at home (96% speak English very well , 4% speak English well ).
Foreign born population: 459 (4.3%)of them are naturalized citizens )
Median number of rooms in houses and condos:
Median number of rooms in apartments
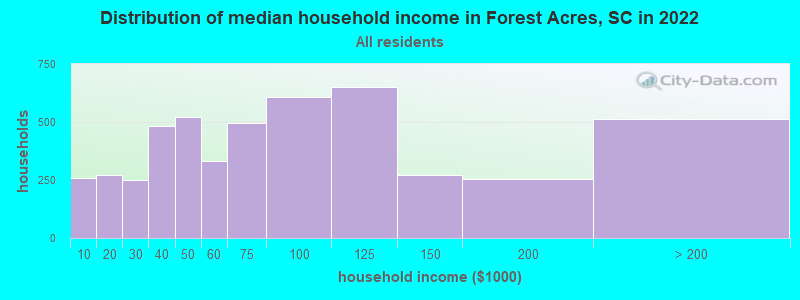
Forest Acres, SC household income distribution 257 Less than $10,000273 $10,000 to $19,999250 $20,000 to $29,999482 $30,000 to $39,999520 $40,000 to $49,999332 $50,000 to $59,999495 $60,000 to $74,999607 $75,000 to $99,999650 $100,000 to $124,999270 $125,000 to $149,999255 $150,000 to $199,999513 $200,000 or more
Home value of owner - occupied houses in 2022 in Forest Acres, SC 44 Less than $10,00038 $20,000 to $24,99922 $25,000 to $29,99912 $35,000 to $39,99921 $40,000 to $49,9995 $50,000 to $59,999117 $60,000 to $69,99969 $70,000 to $79,9996 $80,000 to $89,99945 $90,000 to $99,99957 $100,000 to $124,999297 $125,000 to $149,999355 $150,000 to $174,999330 $175,000 to $199,999633 $200,000 to $249,999645 $250,000 to $299,999514 $300,000 to $399,999361 $400,000 to $499,999293 $500,000 to $749,99992 $750,000 to $999,99946 $1,000,000 to $1,499,9994 $1,500,000 to $1,999,999Rent paid by renters in 2022 in Forest Acres, SC 6 $200 to $2495 $450 to $49936 $550 to $5996 $600 to $64928 $650 to $699147 $700 to $749138 $750 to $799176 $800 to $89995 $900 to $999154 $1,000 to $1,24976 $1,250 to $1,49960 $1,500 to $1,99957 $2,000 to $2,49944 $3,500 or more12 No cash rent
Percentage of workers working in this county: 81.8%Number of people working at home: 561 (11.5% of all workers )
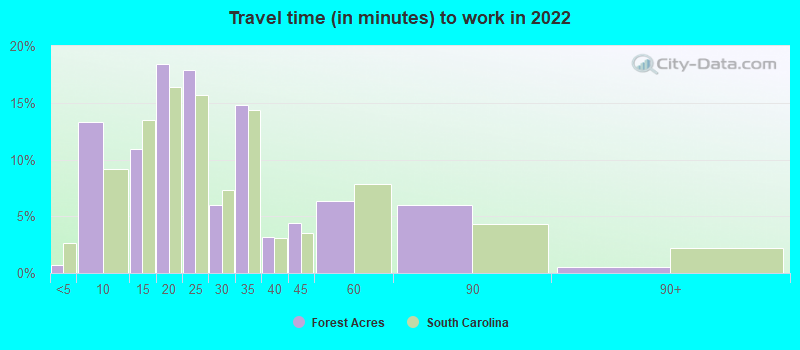
Travel time to work (commute)
Less than 5 minutes: 455 to 9 minutes: 48410 to 14 minutes: 76815 to 19 minutes: 1,32720 to 24 minutes: 84125 to 29 minutes: 14430 to 34 minutes: 29435 to 39 minutes: 3340 to 44 minutes: 5045 to 59 minutes: 15660 to 89 minutes: 5790 or more minutes: 193
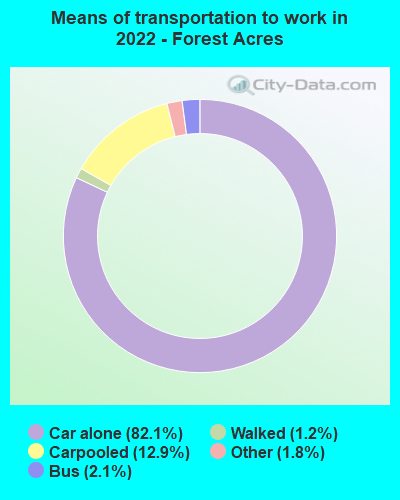
Means of transportation to work:
Drove a car alone: 5,452 (74.8%)Carpooled: 1,078 (14.8%)Bus : 160 (2.2%)Taxi: 170 (2.3%)Walked: 45 (0.6%)Worked at home: 561 (7.7%)
Unemployment by race in 2022
Unemployment rate for White non-Hispanic residents 1.8% Males3.0% FemalesUnemployment rate for Black residents 15.1% Males10.8% FemalesUnemployment rate for Hispanic or Latino residents 32.4% Females
Year of entry for the foreign-born population in Forest Acres, South Carolina
204 2010 or later 107 2000 to 2009 88 1990 to 1999 97 1980 to 1989 33 1970 to 1979 99 Before 1970
First ancestries reported:
English: 1,062 (22.3%)
American: 593 (12.5%)
German: 425 (8.9%)
Irish: 330 (6.9%)
Italian: 329 (6.9%)
European: 175 (3.7%)
Scotch-Irish: 160 (3.4%)
Nigerian: 125 (2.6%)
Lebanese: 93 (2.0%)
Scottish: 78 (1.6%)
Russian: 69 (1.5%)
African: 68 (1.4%)
Iranian: 63 (1.3%)
French Canadian: 43 (0.9%)
Romanian: 38 (0.8%)
British: 32 (0.7%)
Albanian: 14 (0.3%)
Polish: 14 (0.3%)
Czech: 13 (0.3%)
Swedish: 10 (0.2%)
Dutch: 9 (0.2%)
Ukrainian: 9 (0.2%)
Greek: 8 (0.2%)
Slovene: 6 (0.1%)
Austrian: 5 (0.1%)
Northern European: 4 (0.08%)
Norwegian: 3 (0.06%)
Australian: 2 (0.04%) Most common places of birth for foreign-born residents (%): Nigeria Forest Acres:
28.7% (144)South Carolina:
0.6% (1,652)
Canada Forest Acres:
17.0% (85)South Carolina:
3.0% (8,193)
Germany Forest Acres:
11.0% (55)South Carolina:
3.7% (9,982)
Romania Forest Acres:
7.4% (37)South Carolina:
0.6% (1,507)
Korea Forest Acres:
7.2% (36)South Carolina:
1.7% (4,513)
Africa, n.e.c. Forest Acres:
5.0% (25)South Carolina:
0.2% (581)
India Forest Acres:
4.6% (23)South Carolina:
6.8% (18,307)
Russia Forest Acres:
3.8% (19)South Carolina:
1.3% (3,522)
Albania Forest Acres:
3.4% (17)South Carolina:
0.2% (495)
Indonesia Forest Acres:
3.2% (16)South Carolina:
0.1% (269)
Bangladesh Forest Acres:
3.2% (16)South Carolina:
0.2% (628)
Iraq Forest Acres:
3.0% (15)South Carolina:
0.3% (855)
Other Eastern Europe Forest Acres:
2.8% (14)South Carolina:
0.3% (753)
China, excluding Hong Kong and Taiwan Forest Acres:
2.6% (13)South Carolina:
3.2% (8,721)
Vietnam Forest Acres:
2.4% (12)South Carolina:
2.3% (6,308)
Colombia Forest Acres:
1.8% (9)South Carolina:
4.3% (11,533)
Iran Forest Acres:
1.6% (8)South Carolina:
0.5% (1,270)
Place of birth for U.S.-born residents:
This state: 5,752Other state: 4,097Northeast: 755Midwest: 709South: 2,372West: 189 90.8% of Forest Acres residents lived in the same house 1 years ago.
Out of people who lived in different houses, 34.7% lived in this county.
Out of people who lived in different counties, 69.3% lived in South Carolina.
Forest Acres:
90.8%State average:
86.5%
Education attainment for males 25 years and older:
No schooling: 28Nursery to 4th grade: 05th and 6th grade: 197th and 8th grade: 59th grade: 1010th grade: 011th grade: 7812th grade, no diploma: 10High school graduate (or equivalency): 352Less than 1 year of college: 108Some college more than 1 year, no degree: 276Associate degree: 160Bachelor's degree: 1,114Master's degree: 611Professional school degree: 343Doctorate degree: 148
Education attainment for females 25 years and older:
No schooling: 9Nursery to 4th grade: 05th and 6th grade: 07th and 8th grade: 49th grade: 310th grade: 2711th grade: 2612th grade, no diploma: 52High school graduate (or equivalency): 350Less than 1 year of college: 253Some college more than 1 year, no degree: 681Associate degree: 351Bachelor's degree: 1,289Master's degree: 677Professional school degree: 137Doctorate degree: 256
Housing units in structures:
One, detached: 3,595One, attached: 321Two: 1603 or 4: 3755 to 9: 38310 to 19: 10520 to 49: 17850 or more: 191Mobile homes: 18Housing units lacking complete plumbing facilities in 2022: 2.6%Housing units lacking complete kitchen facilities in 2022: 2.3%House/condo owner moved in on average 9 years ago
Renter moved in on average 4 years ago
Private vs. public school enrollment:
Students in private schools in grades 1 to 8 (elementary and middle school): 366 Here:
30.3%South Carolina:
14.4%
Students in private schools in grades 9 to 12 (high school): 109 Here:
16.1%South Carolina:
11.1%
Students in private undergraduate colleges: 79 Here:
20.9%South Carolina:
21.9%