Forest City, FL (Florida) Houses and Residents
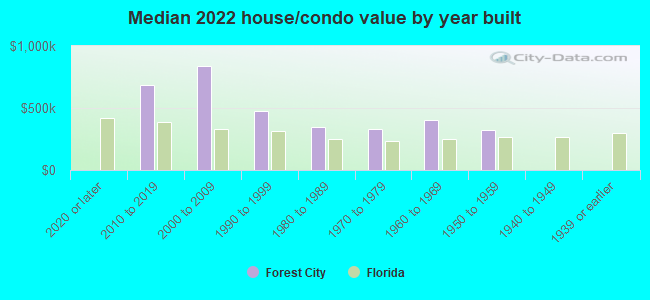
| Forest City: | $410,818 |
| Florida: | $354,100 |
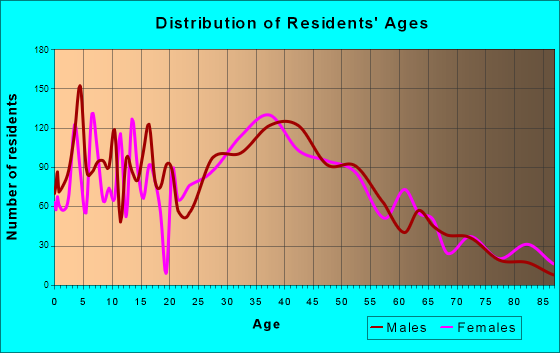
Total population: 13,854 (Urban population: 12,712, Rural population: 0)
Houses: 5,901 (5,551 occupied: 3,604 owner occupied, 1,988 renter occupied)
| % of renters here: | 36% |
| State: | 33% |
Housing density: 1,382 houses/condos per square mile
Median price asked for vacant for-sale houses and condos in 2022: $298,698.
Median contract rent in 2022: $1,465 (lower quartile is $1,280, upper quartile is $1,697)
Median rent asked for vacant for-rent units in 2022: $1,246
Median gross rent in Forest City, FL in 2022: $1,664
Housing units in Forest City with a mortgage: 2,380 (237 second mortgage, 20 home equity loan, 147 both second mortgage and home equity loan)
Houses without a mortgage: 8
Median household income for houses/condos with a mortgage: $112,918
Median household income for apartments without a mortgage: $114,901
Median monthly housing costs: $1,533
Compare current foreclosures near Forest City, FL:
| Photo | Address | Area | Beds / Baths | Price | Details |
|---|---|---|---|---|---|

|
#1
Anzle Ave
Winter Park, FL 32789
|
1,808 sq. feet
|
2 baths 3 beds |
$549,900
|
show details |

|
#2
Largovista Dr
Winter Garden, FL 34787
|
4,475 sq. feet
|
3 baths 5 beds |
$649,900
|
show details |

|
#3
Ford St
Orlando, FL 32811
|
726 sq. feet
|
1 baths 2 beds |
$230,000
|
show details |

|
#4
Cannon Way
Casselberry, FL 32707
|
1,428 sq. feet
|
1 baths 3 beds |
$340,000
|
show details |

|
#5
Brighton Park Cir
Orlando, FL 32812
|
1,634 sq. feet
|
3 baths 3 beds |
show details | |

|
#6
Foxforrest Cir
Apopka, FL 32712
|
2,648 sq. feet
|
2 baths 3 beds |
show details | |

|
#7
Joyce St
Orlando, FL 32839
|
1,176 sq. feet
|
2 baths 3 beds |
show details | |

|
#8
S Alder Ave
Orlando, FL 32807
|
1,824 sq. feet
|
2 baths 4 beds |
show details | |

|
#9
Empire Ave
Orlando, FL 32810
|
1,612 sq. feet
|
1 baths 2 beds |
show details | |

|
#10
Meridian Way
Orlando, FL 32808
|
1,276 sq. feet
|
2 baths 3 beds |
show details |
| Photo | Address | Area | Beds / Baths | Price | Details |
|---|---|---|---|---|---|

|
#11
Luzon Dr
Orlando, FL 32809
|
1,225 sq. feet
|
2 baths 3 beds |
show details | |

|
#12
Page St
Orlando, FL 32806
|
1,605 sq. feet
|
2 baths 3 beds |
show details | |

|
#13
Darwood Dr
Orlando, FL 32812
|
1,072 sq. feet
|
1 baths 3 beds |
show details | |

|
#14
Olive Tree Cir
Altamonte Springs, FL 32714
|
1,438 sq. feet
|
3 baths 3 beds |
show details | |

|
#15
Morning Blossom Ln
Oviedo, FL 32765
|
2,296 sq. feet
|
3 baths 4 beds |
show details | |

|
#16
Biscayne Dr
Orlando, FL 32804
|
2,758 sq. feet
|
3 baths 4 beds |
show details | |

|
#17
Norwalk Pl
Orlando, FL 32808
|
2,290 sq. feet
|
3 baths 4 beds |
show details | |

|
#18
Lundy Ct
Winter Park, FL 32792
|
1,288 sq. feet
|
2 baths 3 beds |
show details | |

|
#19
Turkey Oak Bnd
Orlando, FL 32817
|
1,354 sq. feet
|
2 baths 3 beds |
show details | |

|
#20
Cherry Grove Cir
Orlando, FL 32809
|
1,895 sq. feet
|
2 baths 3 beds |
show details |
| Photo | Address | Area | Beds / Baths | Price | Details |
|---|---|---|---|---|---|

|
#21
Palio Ct
Ocoee, FL 34761
|
3,227 sq. feet
|
3 baths 4 beds |
show details | |

|
#22
Oyster Bay Cir Apt 100
Altamonte Springs, FL 32701
|
992 sq. feet
|
2 baths 2 beds |
show details | |

|
#23
N Orlando Ave Apt 259
Winter Park, FL 32789
|
582 sq. feet
|
1 baths 1 beds |
show details | |

|
#24
Florida Holly Dr
Orlando, FL 32811
|
1,007 sq. feet
|
2 baths 3 beds |
show details | |

|
#25
Shady Willow Dr
Orlando, FL 32808
|
1,460 sq. feet
|
2 baths 3 beds |
show details | |

|
#26
Buttercup Ln
Orlando, FL 32825
|
1,220 sq. feet
|
1 baths 3 beds |
show details | |

|
#27
Red Fox Rd
Altamonte Springs, FL 32714
|
1,988 sq. feet
|
2 baths 3 beds |
show details | |

|
#28
Lake Ave
Sanford, FL 32773
|
3,845 sq. feet
|
4 baths 5 beds |
show details | |

|
#29
S Calhoun Ave
Maitland, FL 32751
|
1,115 sq. feet
|
1 baths 3 beds |
show details | |

|
#30
Roger Babson Rd
Orlando, FL 32808
|
1,501 sq. feet
|
1 baths 3 beds |
show details |
| Photo | Address | Area | Beds / Baths | Price | Details |
|---|---|---|---|---|---|

|
#31
Kays Landing Dr
Sanford, FL 32771
|
2,969 sq. feet
|
3 baths 4 beds |
show details | |

|
#32
Delcrest Dr
Orlando, FL 32817
|
2,053 sq. feet
|
2 baths 3 beds |
show details | |

|
#33
Kintla Rd
Apopka, FL 32712
|
2,599 sq. feet
|
2 baths 3 beds |
show details | |

|
#34
Carriage Hill Dr
Casselberry, FL 32707
|
2,200 sq. feet
|
2 baths 4 beds |
show details | |

|
#35
N Alderwood St
Winter Springs, FL 32708
|
1,223 sq. feet
|
2 baths 3 beds |
show details | |

|
#36
Simmons Rd
Orlando, FL 32812
|
3,936 sq. feet
|
3 baths 4 beds |
show details | |

|
#37
Covered Bridge Dr
Ocoee, FL 34761
|
2,859 sq. feet
|
3 baths 4 beds |
show details | |

|
#38
Fox Glove St
Winter Garden, FL 34787
|
2,122 sq. feet
|
2 baths 4 beds |
show details | |

|
#39
N Hastings St
Orlando, FL 32808
|
1,220 sq. feet
|
2 baths 3 beds |
show details | |

|
#40
Rishley Run Way
Mount Dora, FL 32757
|
2,663 sq. feet
|
3 baths 4 beds |
show details |
| Photo | Address | Area | Beds / Baths | Price | Details |
|---|---|---|---|---|---|

|
#41
Cardassi Dr
Ocoee, FL 34761
|
2,514 sq. feet
|
3 baths 4 beds |
show details | |

|
#42
Flewelling Ave
Ocoee, FL 34761
|
960 sq. feet
|
1 baths 2 beds |
show details | |

|
#43
Cimarosa Ct
Ocoee, FL 34761
|
3,083 sq. feet
|
3 baths 4 beds |
show details | |

|
#44
Edwards Ln
Orlando, FL 32804
|
1,402 sq. feet
|
1 baths 2 beds |
show details | |

|
#45
Springfoot St
Ocoee, FL 34761
|
1,223 sq. feet
|
1 baths 3 beds |
show details | |

|
#46
Lambert Ln
Orlando, FL 32825
|
1,430 sq. feet
|
2 baths 3 beds |
show details | |

|
#47
Castleton St
Orlando, FL 32817
|
1,464 sq. feet
|
2 baths 3 beds |
show details | |

|
#48
Latrobe Dr
Windermere, FL 34786
|
10,221 sq. feet
|
9 baths 9 beds |
show details | |

|
#49
Holts Grove Cir
Winter Park, FL 32789
|
4,356 sq. feet
|
5 baths 4 beds |
show details | |

|
Check over 1 million property listings on Foreclosure.com!
|
browse all offers | |||


 | Maitland / Altamonte Springs condos and apartments (5 replies) |
| Real Estate Question (19 replies) |
| Leesburg vs Mt Dora vs ?? to live (reposting) (25 replies) |
| Moving to the Orlando area in the Fall (15 replies) |
| Best city/neighborhood for young family (21 replies) |
| Need a little Advice about Magnolia Court Condos (0 replies) |
Median year apartment built: 1984
Household type by relationship:
Households: 15,085- Male householders: 2,611 (429 living alone), Female householders: 2,889 (606 living alone)
2,901 spouses (2,841 opposite-sex spouses), 397 unmarried partners, (397 opposite-sex unmarried partners), 4,274 children (3,924 natural, 154 adopted, 196 stepchildren), 382 grandchildren, 217 brothers or sisters, 253 parents, 20 foster children, 271 other relatives, 559 non-relatives
- In group quarters: 305
Size of family households: 1,731 2-persons, 771 3-persons, 825 4-persons, 519 5-persons, 181 6-persons, 29 7-or-more-persons.
Size of nonfamily households: 1,023 1-person, 441 2-persons, 25 3-persons, 41 4-persons.
1,810 married couples with children.
885 single-parent households (139 men, 746 women).
72.6% of residents of Forest City speak English at home.
20.2% of residents speak Spanish at home (68% speak English very well, 18% speak English well, 10% speak English not well, 4% don't speak English at all).
3.3% of residents speak other Indo-European language at home (89% speak English very well, 11% speak English well).
1.7% of residents speak Asian or Pacific Island language at home (51% speak English very well, 47% speak English well, 2% speak English not well).
0.2% of residents speak other language at home (47% speak English very well, 53% speak English not well).
Foreign born population: 2,715 (18.0%)
(71.1% of them are naturalized citizens)
| Here: | 7.2 |
| State: | 5.9 |
| Here: | 4.2 |
| State: | 4.2 |
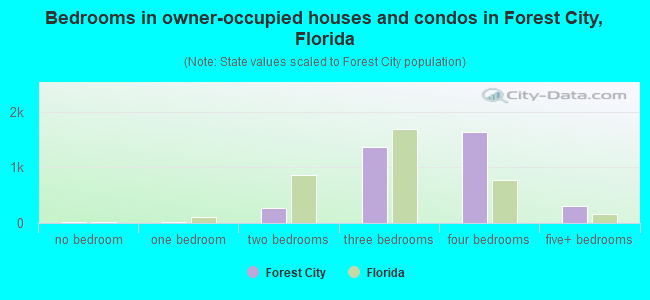
- Bedrooms in owner-occupied houses and condos in Forest City, Florida
- 17no bedroom
- 91 bedroom
- 2682 bedrooms
- 1,3703 bedrooms
- 1,6334 bedrooms
- 3075+ bedrooms
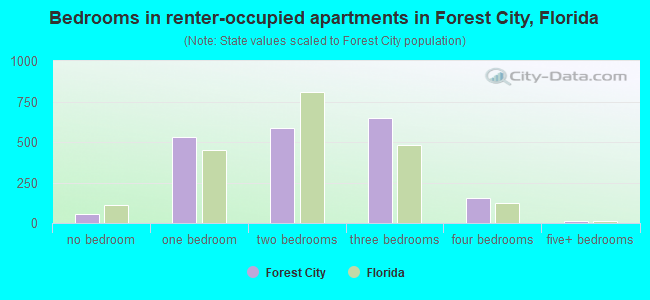
- Bedrooms in renter-occupied apartments in Forest City, Florida
- 54no bedroom
- 5301 bedroom
- 5882 bedrooms
- 6503 bedrooms
- 1574 bedrooms
- 115+ bedrooms
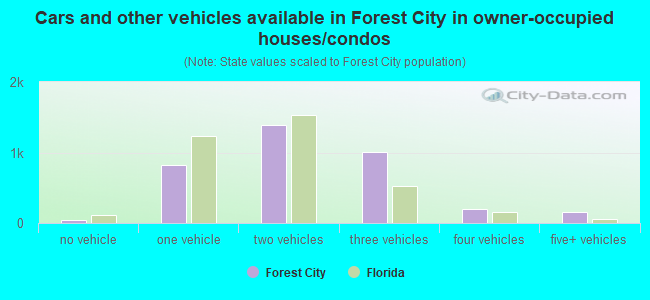
- Cars and other vehicles available in Forest City in owner-occupied houses/condos
- 41no vehicle
- 8191 vehicle
- 1,3862 vehicles
- 1,0093 vehicles
- 1974 vehicles
- 1525+ vehicles
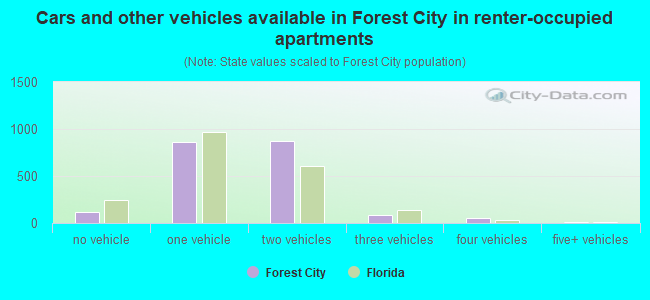
- Cars and other vehicles available in Forest City in renter-occupied apartments
- 119no vehicle
- 8571 vehicle
- 8762 vehicles
- 803 vehicles
- 494 vehicles
- 95+ vehicles
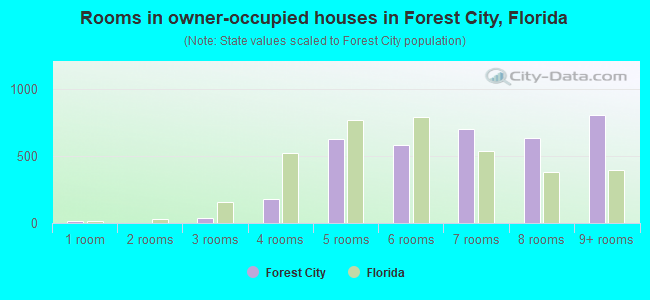
- Rooms in owner-occupied houses in Forest City, Florida
- 171 room
- 02 rooms
- 413 rooms
- 1824 rooms
- 6295 rooms
- 5826 rooms
- 7057 rooms
- 6398 rooms
- 8099+ rooms
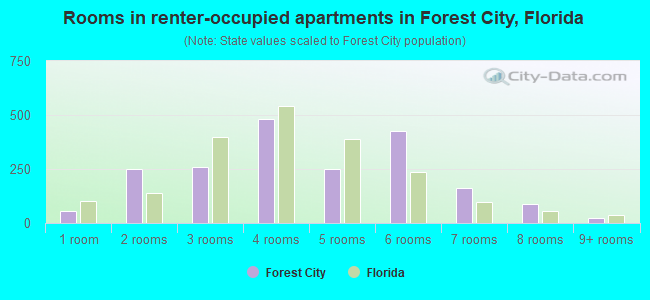
- Rooms in renter-occupied apartments in Forest City, Florida
- 541 room
- 2482 rooms
- 2613 rooms
- 4824 rooms
- 2505 rooms
- 4266 rooms
- 1617 rooms
- 868 rooms
- 219+ rooms
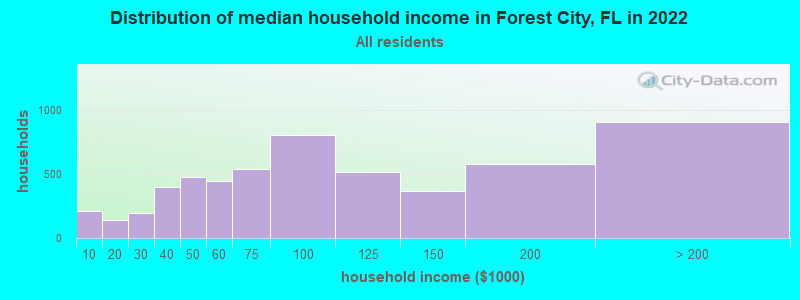
Forest City, FL household income distribution

- 213Less than $10,000
- 138$10,000 to $19,999
- 193$20,000 to $29,999
- 402$30,000 to $39,999
- 478$40,000 to $49,999
- 449$50,000 to $59,999
- 541$60,000 to $74,999
- 808$75,000 to $99,999
- 513$100,000 to $124,999
- 366$125,000 to $149,999
- 582$150,000 to $199,999
- 908$200,000 or more
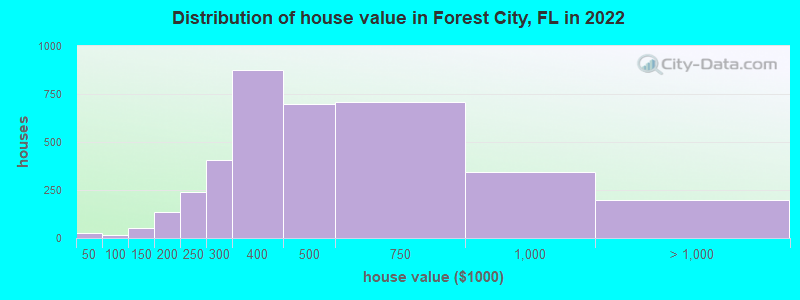
Home value of owner - occupied houses in 2022 in Forest City, FL
-
- 14Less than $10,000
- 8$20,000 to $24,999
- 15$50,000 to $59,999
- 9$100,000 to $124,999
- 40$125,000 to $149,999
- 13$150,000 to $174,999
- 123$175,000 to $199,999
- 237$200,000 to $249,999
- 403$250,000 to $299,999
- 876$300,000 to $399,999
- 697$400,000 to $499,999
- 707$500,000 to $749,999
- 342$750,000 to $999,999
- 189$1,000,000 to $1,499,999
- 10$2,000,000 or more
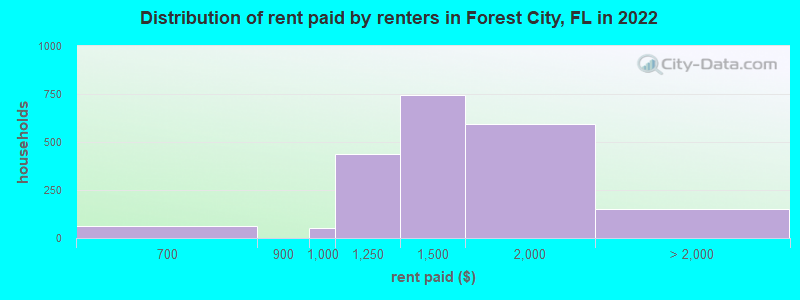
Rent paid by renters in 2022 in Forest City, FL
-
- 49$600 to $649
- 11$650 to $699
- 51$900 to $999
- 434$1,000 to $1,249
- 745$1,250 to $1,499
- 591$1,500 to $1,999
- 68$2,000 to $2,499
- 83$2,500 to $2,999
Percentage of workers working in this county: 53.7%
Number of people working at home: 1,288 (16.3% of all workers)
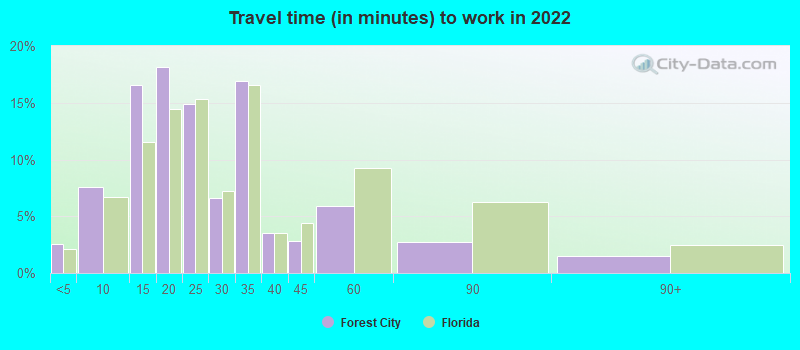
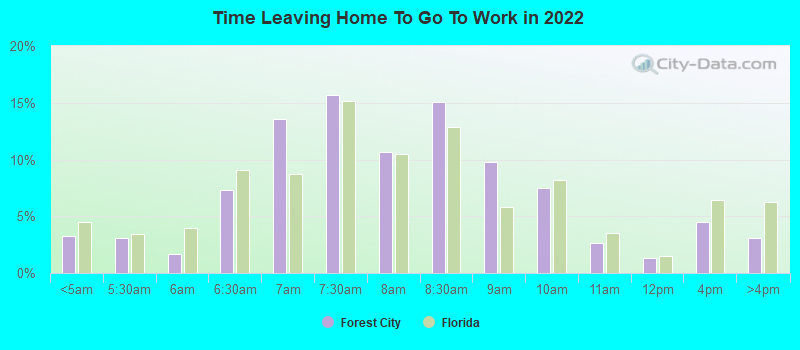
Travel time to work (commute)
- Less than 5 minutes: 80
- 5 to 9 minutes: 338
- 10 to 14 minutes: 876
- 15 to 19 minutes: 596
- 20 to 24 minutes: 1,452
- 25 to 29 minutes: 799
- 30 to 34 minutes: 1,162
- 35 to 39 minutes: 242
- 40 to 44 minutes: 167
- 45 to 59 minutes: 406
- 60 to 89 minutes: 232
- 90 or more minutes: 156
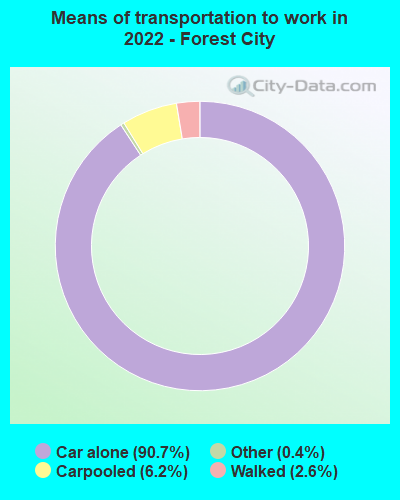
Means of transportation to work:
- Drove a car alone: 2,708 (63.7%)
- Carpooled: 234 (5.5%)
- Bus: 2 (0.0%)
- Taxi: 13 (0.3%)
- Bicycle: 1 (0.0%)
- Walked: 73 (1.7%)
- Worked at home: 1,288 (30.3%)
- Unemployment by race in 2022
- Unemployment rate for White non-Hispanic residents
- 4.3%Males
- 1.5%Females
- Unemployment rate for Black residents
- 1.7%Females
- Unemployment rate for other race residents
- 0.7%Females
- Unemployment rate for two or more race residents
- 1.8%Males
- 1.8%Females
- Unemployment rate for Hispanic or Latino residents
- 1.0%Males
- 1.6%Females
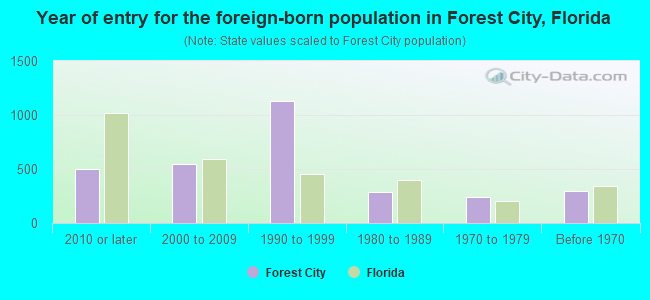
- Year of entry for the foreign-born population in Forest City, Florida
- 5042010 or later
- 5452000 to 2009
- 1,1261990 to 1999
- 2881980 to 1989
- 2411970 to 1979
- 295Before 1970
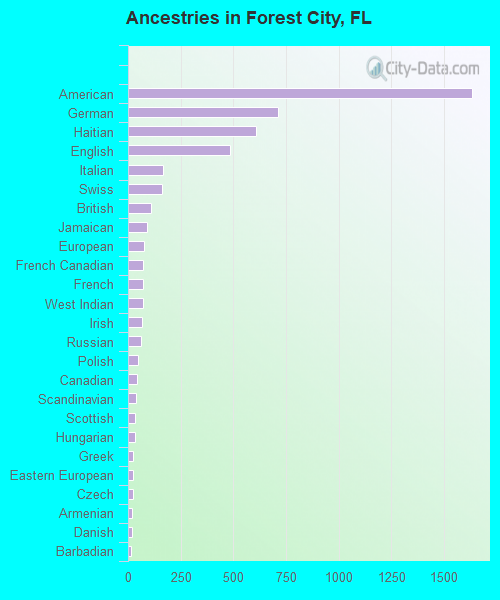
First ancestries reported:
- American: 1,633 (18.8%)
- German: 712 (8.2%)
- Haitian: 608 (7.0%)
- English: 484 (5.6%)
- Italian: 164 (1.9%)
- Swiss: 162 (1.9%)
- British: 109 (1.3%)
- Jamaican: 88 (1.0%)
- European: 75 (0.9%)
- French Canadian: 73 (0.8%)
- French: 70 (0.8%)
- West Indian: 69 (0.8%)
- Irish: 65 (0.7%)
- Russian: 64 (0.7%)
- Polish: 47 (0.5%)
- Canadian: 45 (0.5%)
- Scandinavian: 38 (0.4%)
- Scottish: 35 (0.4%)
- Hungarian: 34 (0.4%)
- Greek: 26 (0.3%)
- Eastern European: 24 (0.3%)
- Czech: 22 (0.3%)
- Armenian: 21 (0.2%)
- Danish: 19 (0.2%)
- Barbadian: 16 (0.2%)
- Portuguese: 11 (0.1%)
- Brazilian: 10 (0.1%)
- Lithuanian: 10 (0.1%)
- Norwegian: 10 (0.1%)
- Bahamian: 10 (0.1%)
- Lebanese: 8 (0.09%)
- Assyrian: 8 (0.09%)
- Swedish: 8 (0.09%)
Most common places of birth for foreign-born residents (%):
| Forest City: | 12.7% (333) |
| Florida: | 22.0% (1,006,576) |
| Forest City: | 11.8% (311) |
| Florida: | 3.0% (137,727) |
| Forest City: | 11.0% (289) |
| Florida: | 6.5% (298,669) |
| Forest City: | 5.5% (144) |
| Florida: | 2.1% (96,693) |
| Forest City: | 5.0% (132) |
| Florida: | 0.3% (13,569) |
| Forest City: | 4.9% (129) |
| Florida: | 7.5% (342,375) |
| Forest City: | 4.1% (108) |
| Florida: | 5.6% (257,152) |
| Forest City: | 3.8% (100) |
| Florida: | 5.0% (227,319) |
| Forest City: | 3.7% (97) |
| Florida: | 0.7% (34,227) |
| Forest City: | 3.5% (91) |
| Florida: | 2.1% (94,349) |
| Forest City: | 3.4% (88) |
| Florida: | 0.4% (19,445) |
| Forest City: | 3.2% (83) |
| Florida: | 1.2% (56,071) |
| Forest City: | 2.9% (77) |
| Florida: | 5.7% (262,042) |
| Forest City: | 2.9% (77) |
| Florida: | 0.5% (22,715) |
| Forest City: | 2.6% (67) |
| Florida: | 2.4% (109,132) |
| Forest City: | 2.3% (61) |
| Florida: | 2.3% (107,160) |
| Forest City: | 1.8% (47) |
| Florida: | 1.3% (57,263) |
| Forest City: | 1.6% (43) |
| Florida: | 1.8% (84,403) |
Place of birth for U.S.-born residents:
- This state: 5,194
- Other state: 6,438
- Northeast: 3,019
- Midwest: 1,227
- South: 1,495
- West: 714
82.6% of Forest City residents lived in the same house 1 years ago.
Out of people who lived in different houses, 29.0% lived in this county.
Out of people who lived in different counties, 56.7% lived in Florida.
| Forest City: | 82.6% |
| State average: | 86.3% |
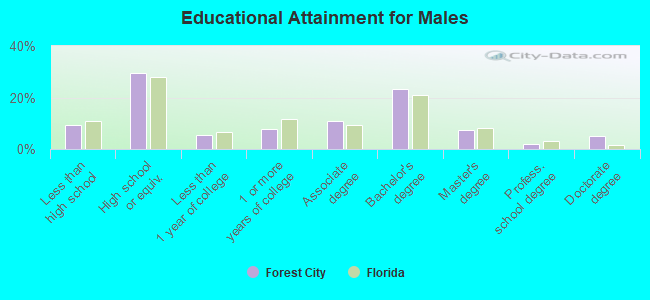
Education attainment for males 25 years and older:
- No schooling: 70
- Nursery to 4th grade: 0
- 5th and 6th grade: 93
- 7th and 8th grade: 31
- 9th grade: 0
- 10th grade: 84
- 11th grade: 0
- 12th grade, no diploma: 198
- High school graduate (or equivalency): 1,504
- Less than 1 year of college: 268
- Some college more than 1 year, no degree: 394
- Associate degree: 546
- Bachelor's degree: 1,177
- Master's degree: 368
- Professional school degree: 90
- Doctorate degree: 262
Education attainment for females 25 years and older:
- No schooling: 38
- Nursery to 4th grade: 49
- 5th and 6th grade: 22
- 7th and 8th grade: 72
- 9th grade: 19
- 10th grade: 71
- 11th grade: 22
- 12th grade, no diploma: 37
- High school graduate (or equivalency): 1,455
- Less than 1 year of college: 365
- Some college more than 1 year, no degree: 680
- Associate degree: 761
- Bachelor's degree: 1,658
- Master's degree: 365
- Professional school degree: 169
- Doctorate degree: 26

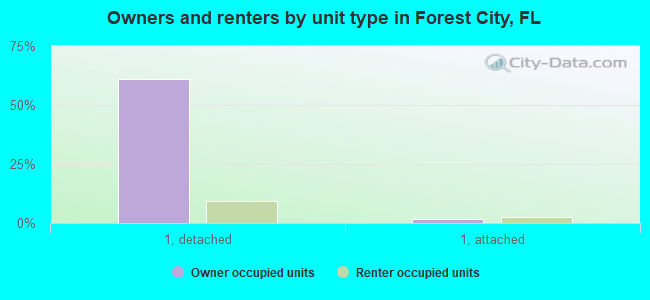
Housing units in structures:
- One, detached: 4,207
- One, attached: 238
- 3 or 4: 74
- 5 to 9: 260
- 10 to 19: 707
- 20 to 49: 228
- 50 or more: 133
- Mobile homes: 51
Housing units lacking complete kitchen facilities in 2022: 0.3%
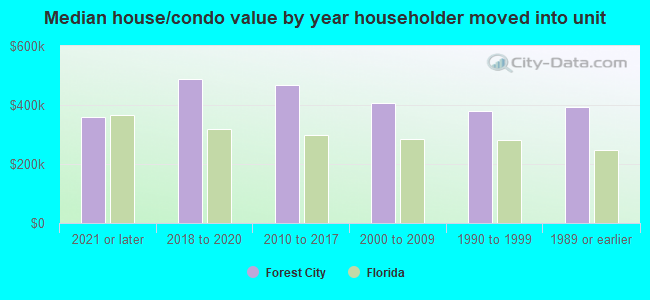
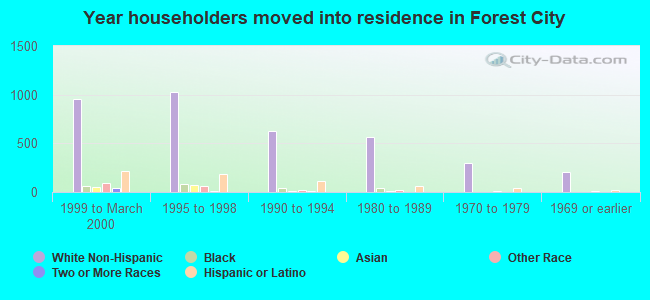
House/condo owner moved in on average 12 years ago
Renter moved in on average 3 years ago
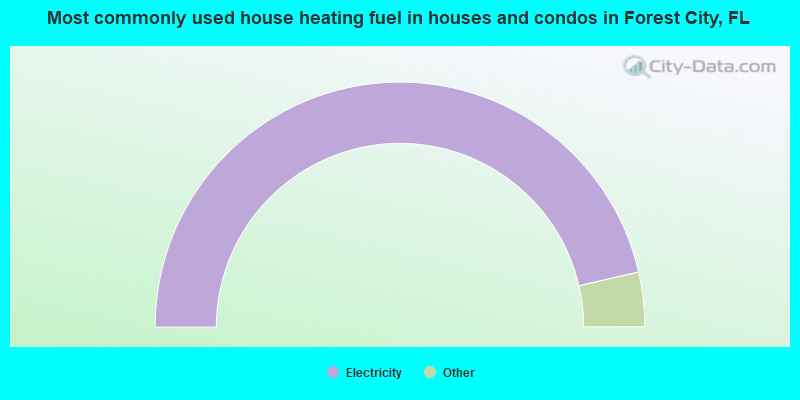
- 92.8%Electricity
- 2.7%Solar energy
- 2.1%Utility gas
- 1.0%No fuel used
- 0.6%Bottled, tank, or LP gas
- 0.5%Fuel oil, kerosene, etc.
- 0.3%Wood
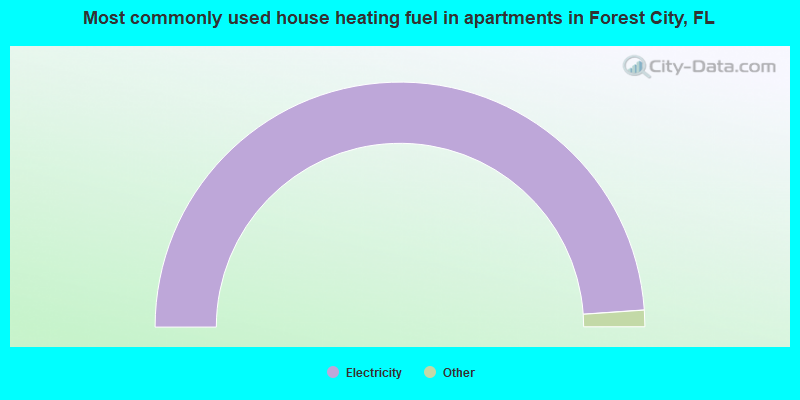
- 97.8%Electricity
- 1.1%Utility gas
- 0.6%No fuel used
- 0.5%Other fuel
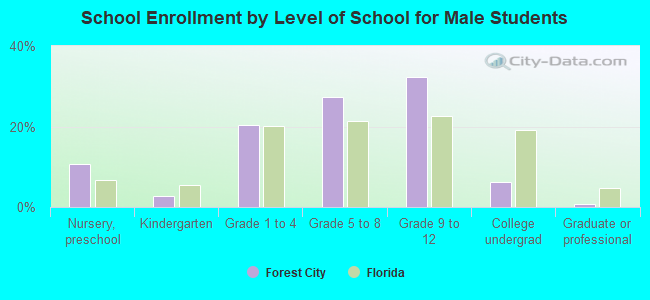
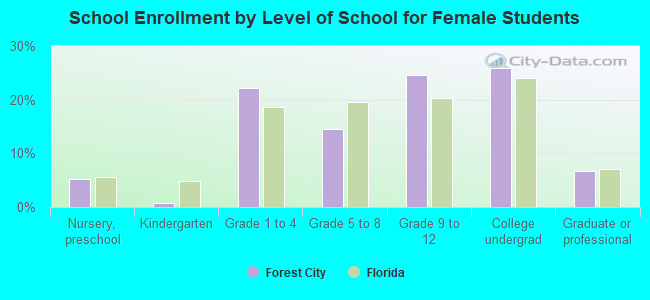
Private vs. public school enrollment:
| Here: | 33.3% |
| Florida: | 15.8% |
| Here: | 18.9% |
| Florida: | 12.9% |
| Here: | 14.4% |
| Florida: | 23.6% |