Forrestville, PA (Pennsylvania) Houses and Residents
| Forrestville: | $125,512 |
| Pennsylvania: | $245,500 |
Total population: 422 (Urban population: 143 (all inside urban clusters), Rural population: 250 (all nonfarm))
Houses: 214 (189 occupied: 179 owner occupied, 10 renter occupied)
| % of renters here: | 5% |
| State: | 31% |
Housing density: 251 houses/condos per square mile
Median price asked for vacant for-sale houses and condos in 2022 in this county: $77,403.
Median contract rent in 2022: $432 (lower quartile is $439, upper quartile is $569)
Median gross rent in Forrestville, PA in 2022: $663
Housing units in Forrestville with a mortgage: 55 (5 second mortgage, 4 home equity loan, 0 both second mortgage and home equity loan)
Houses without a mortgage: 102


Household type by relationship:
Households: 141,509- In family households: 116,384 (28,466 male householders, 10,538 female householders)
28,986 spouses, 38,187 children (35,471 natural, 672 adopted, 2,044 stepchildren), 2,639 grandchildren, 1,049 brothers or sisters, 1,292 parents, foster children, 998 other relatives, 3,479 non-relatives
- In nonfamily households: 25,125 (10,088 male householders (8,177 living alone)), 11,100 female householders (9,868 living alone)), 3,937 nonrelatives
- In group quarters: 6,780 (6,565 institutionalized population)
21,963 married couples with children.
6,784 single-parent households (2,021 men, 4,763 women).
93.5% of residents of Forrestville speak English at home.
0.5% of residents speak Spanish at home (100% speak English very well).
6.0% of residents speak other Indo-European language at home (91% speak English very well, 9% speak English well).
Foreign born population: 10 (2.7%)
(60.0% of them are naturalized citizens)
| Here: | 6.8 |
| State: | 6.8 |
| Here: | 6.8 |
| State: | 4.3 |

- Bedrooms in owner-occupied houses and condos in Forrestville, Pennsylvania
- 0no bedroom
- 21 bedroom
- 422 bedrooms
- 883 bedrooms
- 404 bedrooms
- 75+ bedrooms

- Bedrooms in renter-occupied apartments in Forrestville, Pennsylvania
- 0no bedroom
- 01 bedroom
- 62 bedrooms
- 43 bedrooms
- 04 bedrooms
- 05+ bedrooms

- Cars and other vehicles available in Forrestville in owner-occupied houses/condos
- 13no vehicle
- 711 vehicle
- 432 vehicles
- 483 vehicles
- 24 vehicles
- 25+ vehicles

- Cars and other vehicles available in Forrestville in renter-occupied apartments
- 2no vehicle
- 41 vehicle
- 02 vehicles
- 43 vehicles
- 04 vehicles
- 05+ vehicles

- Rooms in owner-occupied houses in Forrestville, Pennsylvania
- 01 room
- 02 rooms
- 23 rooms
- 104 rooms
- 335 rooms
- 596 rooms
- 307 rooms
- 178 rooms
- 289+ rooms

- Rooms in renter-occupied apartments in Forrestville, Pennsylvania
- 01 room
- 02 rooms
- 03 rooms
- 04 rooms
- 65 rooms
- 26 rooms
- 27 rooms
- 08 rooms
- 09+ rooms


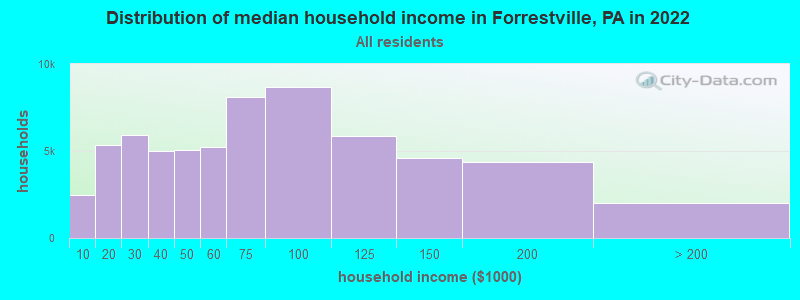
Forrestville, PA household income distribution

- 2,492Less than $10,000
- 5,359$10,000 to $19,999
- 5,895$20,000 to $29,999
- 4,993$30,000 to $39,999
- 5,060$40,000 to $49,999
- 5,232$50,000 to $59,999
- 8,101$60,000 to $74,999
- 8,652$75,000 to $99,999
- 5,878$100,000 to $124,999
- 4,605$125,000 to $149,999
- 4,348$150,000 to $199,999
- 1,984$200,000 or more
Percentage of workers working in this county: 72.3%
Number of people working at home: 22 (13.0% of all workers)
Travel time to work (commute)
- Less than 5 minutes: 4
- 5 to 9 minutes: 6
- 10 to 14 minutes: 12
- 15 to 19 minutes: 34
- 20 to 24 minutes: 29
- 25 to 29 minutes: 7
- 30 to 34 minutes: 5
- 35 to 39 minutes: 0
- 40 to 44 minutes: 5
- 45 to 59 minutes: 15
- 60 to 89 minutes: 15
- 90 or more minutes: 23
Means of transportation to work:
- Drove a car alone: 133 (85.8%)
- Carpooled: 16 (10.3%)
- Bus or trolley bus: 2 (1.3%)
- Walked: 4 (2.6%)


- Year of entry for the foreign-born population in Forrestville, Pennsylvania
- 01995 to March 2000
- 31990 to 1994
- 01985 to 1989
- 01980 to 1984
- 01975 to 1979
- 01970 to 1974
- 01965 to 1969
- 2Before 1965

First ancestries reported:
- Ukrainian: 140 (29.2%)
- Polish: 89 (18.5%)
- Irish: 72 (15.0%)
- Italian: 30 (6.2%)
- Slovak: 30 (6.2%)
- Other: 30 (6.2%)
- German: 24 (5.0%)
- Dutch: 22 (4.6%)
- Lithuanian: 17 (3.5%)
- United States: 9 (1.9%)
- Czech: 4 (0.8%)
- Welsh: 4 (0.8%)
- Russian: 3 (0.6%)
- French: 2 (0.4%)
- Greek: 2 (0.4%)
- Norwegian: 2 (0.4%)
Most common places of birth for foreign-born residents (%):
| Forrestville: | 100.0% (5) |
| Pennsylvania: | 0.7% (3,451) |
Place of birth for U.S.-born residents:
- This state: 384
- Other state: 4
- Northeast: 2
- Midwest: 0
- South: 0
- West: 2
83% of Forrestville residents lived in the same house 5 years ago.
Out of people who lived in different houses, 89% lived in this county.
Out of people who lived in different counties, 14% lived in Pennsylvania.
Education attainment for males 25 years and older:
- No schooling: 2
- Nursery to 4th grade: 0
- 5th and 6th grade: 0
- 7th and 8th grade: 8
- 9th grade: 8
- 10th grade: 10
- 11th grade: 3
- 12th grade, no diploma: 9
- High school graduate (or equivalency): 79
- Less than 1 year of college: 0
- Some college more than 1 year, no degree: 12
- Associate degree: 13
- Bachelor's degree: 3
- Master's degree: 0
- Professional school degree: 0
- Doctorate degree: 0

Education attainment for females 25 years and older:
- No schooling: 0
- Nursery to 4th grade: 0
- 5th and 6th grade: 0
- 7th and 8th grade: 16
- 9th grade: 18
- 10th grade: 14
- 11th grade: 7
- 12th grade, no diploma: 8
- High school graduate (or equivalency): 71
- Less than 1 year of college: 6
- Some college more than 1 year, no degree: 9
- Associate degree: 11
- Bachelor's degree: 7
- Master's degree: 0
- Professional school degree: 2
- Doctorate degree: 0


Housing units in structures:
- One, detached: 134
- One, attached: 52
- Two: 3
- 3 or 4: 6
- Mobile homes: 19
Median worth of mobile homes: $45,054
Housing units lacking complete kitchen facilities: 4.2%

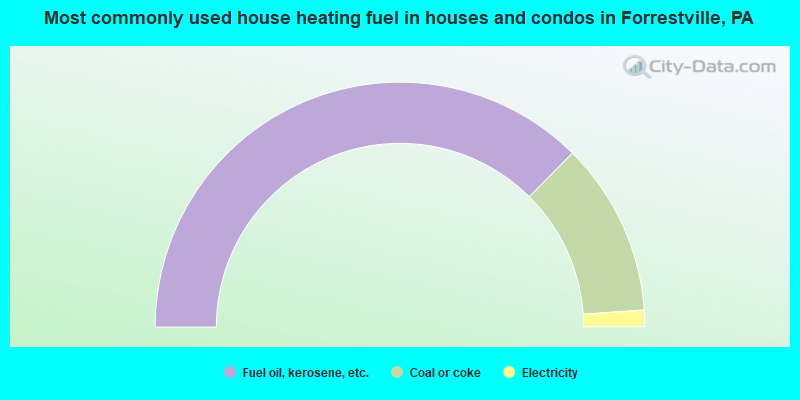
- 74.9%Fuel oil, kerosene, etc.
- 22.9%Coal or coke
- 2.2%Electricity
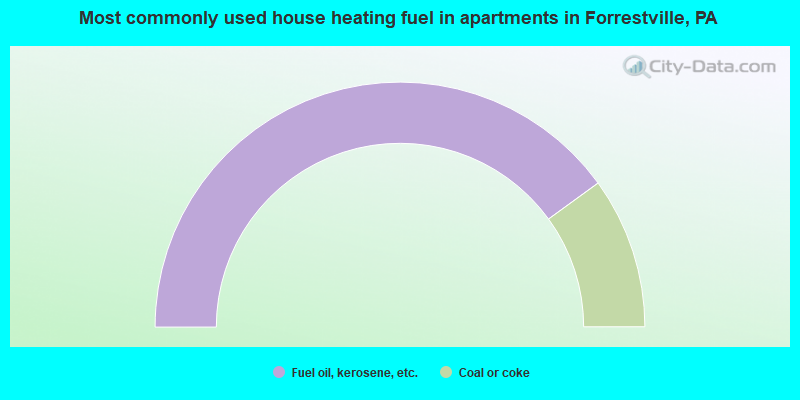
- 80.0%Fuel oil, kerosene, etc.
- 20.0%Coal or coke
Private vs. public school enrollment:
| Here: | 0.0% |
| Pennsylvania: | 16.0% |
| Here: | 13.3% |
| Pennsylvania: | 13.1% |
| Here: | 37.5% |
| Pennsylvania: | 37.3% |


