Fort Bliss, TX (Texas) Houses and Residents
| Fort Bliss: | |
| Texas: |
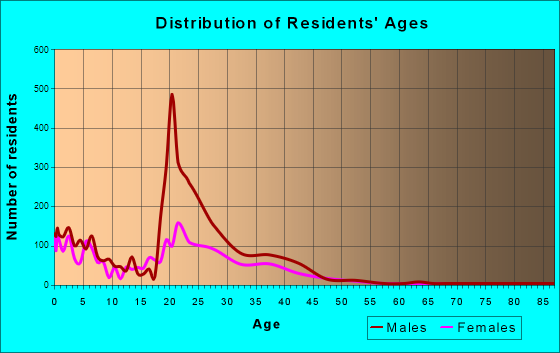
Total population: 8,591 (Urban population: 7,994, Rural population: 234 (all nonfarm))
Houses: 2,649 (2,327 occupied: 0 owner occupied, 2,344 renter occupied)
| % of renters here: | 100% |
| State: | 38% |
Housing density: 430 houses/condos per square mile
Median price asked for vacant for-sale houses and condos in 2022 in this county: $128,915.
Median contract rent in 2022: $1,473 (lower quartile is $1,309, upper quartile is $1,736)
Median rent asked for vacant for-rent units in 2022: $920
Median gross rent in Fort Bliss, TX in 2022: $1,506
Housing units in Fort Bliss with a mortgage: 0 (0 second mortgage, 0 home equity loan, 0 both second mortgage and home equity loan)
Houses without a mortgage: 25
Compare current foreclosures near Fort Bliss, TX:
| Photo | Address | Area | Beds / Baths | Price | Details |
|---|---|---|---|---|---|

|
#1
Hendrich Rd
Chaparral, NM 88081
|
4,256 sq. feet
|
3 baths 6 beds |
$212,000
|
show details |

|
#2
Anita Cir
El Paso, TX 79905
|
1,723 sq. feet
|
2 baths 4 beds |
$132,000
|
show details |

|
#3
Franklin Ridge Dr
El Paso, TX 79912
|
1,657 sq. feet
|
2 baths 4 beds |
show details | |

|
#4
Charles Owens Dr
El Paso, TX 79936
|
1,092 sq. feet
|
2 baths 3 beds |
show details | |

|
#5
Camino Barranca
El Paso, TX 79912
|
2,518 sq. feet
|
3 baths 4 beds |
show details | |

|
#6
Bluff Canyon Cir
El Paso, TX 79912
|
1,711 sq. feet
|
2 baths 3 beds |
show details | |

|
#7
Rutherglen St
El Paso, TX 79925
|
2,110 sq. feet
|
2 baths 3 beds |
show details | |

|
#8
Pleasant Sand Dr
El Paso, TX 79924
|
2,417 sq. feet
|
3 baths 4 beds |
show details | |

|
#9
N Stanton St
El Paso, TX 79902
|
2,395 sq. feet
|
3 baths 4 beds |
show details | |

|
#10
Woodmanstone Rd
El Paso, TX 79928
|
- sq. feet
|
2 baths 4 beds |
show details |
| Photo | Address | Area | Beds / Baths | Price | Details |
|---|---|---|---|---|---|

|
#11
Solar Point Ln
El Paso, TX 79938
|
2,350 sq. feet
|
6 baths 4 beds |
show details | |

|
#12
Emerald Vista Pl
El Paso, TX 79928
|
2,002 sq. feet
|
3 baths 3 beds |
show details | |

|
#13
Red Orchard Dr
El Paso, TX 79938
|
2,906 sq. feet
|
3 baths 4 beds |
show details | |

|
#14
Kingsbury Ave
El Paso, TX 79928
|
- sq. feet
|
2 baths 3 beds |
show details | |

|
#15
Fir St
El Paso, TX 79925
|
2,322 sq. feet
|
2 baths 3 beds |
show details | |

|
#16
Mitchell Jones Dr
El Paso, TX 79936
|
1,796 sq. feet
|
2 baths 3 beds |
show details | |

|
#17
William Caples St
El Paso, TX 79938
|
1,451 sq. feet
|
2 baths 3 beds |
show details | |

|
#18
Blue Cove Drive
El Paso, TX 79938
|
- sq. feet
|
2 baths 4 beds |
show details | |

|
#19
Laramie Cir
El Paso, TX 79924
|
1,045 sq. feet
|
2 baths 3 beds |
show details | |

|
#20
Mclean St
El Paso, TX 79936
|
2,301 sq. feet
|
2 baths 3 beds |
show details |
| Photo | Address | Area | Beds / Baths | Price | Details |
|---|---|---|---|---|---|

|
#21
Wally Dr
El Paso, TX 79924
|
1,740 sq. feet
|
2 baths 3 beds |
show details | |

|
#22
Paseo Del Mar Dr
El Paso, TX 79928
|
2,399 sq. feet
|
2 baths 4 beds |
show details | |

|
#23
Cattle Ranch St
El Paso, TX 79934
|
2,161 sq. feet
|
3 baths 4 beds |
show details | |

|
#24
Colin Powell Ave
El Paso, TX 79934
|
1,511 sq. feet
|
2 baths 3 beds |
show details | |

|
#25
Mumm Ln
El Paso, TX 79924
|
1,548 sq. feet
|
2 baths 3 beds |
show details | |

|
#26
Loma Grande Dr
El Paso, TX 79934
|
1,390 sq. feet
|
2 baths 5 beds |
show details | |

|
#27
Delilah Ave
El Paso, TX 79927
|
784 sq. feet
|
1 baths 2 beds |
show details | |

|
#28
Emerald Falls Dr
El Paso, TX 79928
|
2,836 sq. feet
|
3 baths 4 beds |
show details | |

|
#29
Paseo Hermoso Dr
El Paso, TX 79928
|
3,200 sq. feet
|
2 baths 4 beds |
show details | |

|
#30
Exodus St
El Paso, TX 79936
|
1,187 sq. feet
|
2 baths 3 beds |
show details |
| Photo | Address | Area | Beds / Baths | Price | Details |
|---|---|---|---|---|---|

|
#31
Banner Hill Ave
El Paso, TX 79936
|
1,121 sq. feet
|
2 baths 3 beds |
show details | |

|
#32
Treasure Hill Pl
El Paso, TX 79936
|
1,453 sq. feet
|
2 baths 3 beds |
show details | |

|
#33
Frazier Ct
El Paso, TX 79935
|
2,016 sq. feet
|
2 baths 3 beds |
show details | |

|
#34
Octubre Dr
El Paso, TX 79935
|
2,534 sq. feet
|
2 baths 3 beds |
show details | |

|
#35
Emerald Falls Dr
El Paso, TX 79928
|
3,304 sq. feet
|
2 baths 4 beds |
show details | |

|
#36
Paseo Mision St
El Paso, TX 79928
|
1,970 sq. feet
|
2 baths 3 beds |
show details | |

|
#37
Colin Powell Ave
El Paso, TX 79934
|
1,637 sq. feet
|
2 baths 3 beds |
show details | |

|
#38
Banner Run Dr
El Paso, TX 79936
|
1,873 sq. feet
|
2 baths 4 beds |
show details | |

|
#39
Thrush Way
El Paso, TX 79922
|
1,772 sq. feet
|
2 baths 3 beds |
show details | |

|
#40
Tower View Dr
El Paso, TX 79936
|
1,250 sq. feet
|
2 baths 3 beds |
show details |
| Photo | Address | Area | Beds / Baths | Price | Details |
|---|---|---|---|---|---|

|
#41
Regal Banner Ln
El Paso, TX 79936
|
1,248 sq. feet
|
2 baths 1 beds |
show details | |

|
#42
Castle Hill Cir
El Paso, TX 79936
|
1,376 sq. feet
|
2 baths 3 beds |
show details | |

|
#43
Paseo Sereno Dr
El Paso, TX 79928
|
2,278 sq. feet
|
2 baths 4 beds |
show details | |

|
#44
Mac Kenze Ann Pl
El Paso, TX 79927
|
2,048 sq. feet
|
2 baths 4 beds |
show details | |

|
#45
Crown Royal Dr
El Paso, TX 79936
|
1,287 sq. feet
|
2 baths 4 beds |
show details | |

|
#46
Parque Del Sol
El Paso, TX 79911
|
2,078 sq. feet
|
2 baths 4 beds |
show details | |

|
#47
Crest Gate Way
El Paso, TX 79936
|
1,701 sq. feet
|
2 baths 3 beds |
show details | |

|
#48
Paseo Real Cir
El Paso, TX 79936
|
2,217 sq. feet
|
2 baths 3 beds |
show details | |

|
#49
Aparicio Dr
El Paso, TX 79907
|
900 sq. feet
|
1 baths 3 beds |
show details | |

|
Check over 1 million property listings on Foreclosure.com!
|
browse all offers | |||


 | looking to rent horse property near Fort Bliss (1 reply) |
| renting horse property near Fort Bliss (0 replies) |
| Fort Bliss Opportunity (7 replies) |
| Moving to EL Paso Fort Bliss, anyone know about the schools and housing? (52 replies) |
| Military Move. Rent, Buy, what area? Child free couple (28 replies) |
| Fort Bliss Living (24 replies) |
Household type by relationship:
Households: 12,582- Male householders: 1,843 (49 living alone), Female householders: 451 (61 living alone)
2,005 spouses (2,005 opposite-sex spouses), 0 unmarried partners, (0 opposite-sex unmarried partners), 4,343 children (3,821 natural, 43 adopted, 478 stepchildren), 73 grandchildren, 0 brothers or sisters, 33 parents, 0 foster children, 25 other relatives, 0 non-relatives
- In group quarters: 3,806
Size of family households: 313 2-persons, 467 3-persons, 845 4-persons, 358 5-persons, 104 6-persons, 41 7-or-more-persons.
Size of nonfamily households: 116 1-person.
3,889 married couples with children.
176 single-parent households (37 men, 139 women).
82.2% of residents of Fort Bliss speak English at home.
10.5% of residents speak Spanish at home (46% speak English very well, 44% speak English well, 8% speak English not well, 1% don't speak English at all).
3.4% of residents speak other Indo-European language at home (64% speak English very well, 36% speak English well).
3.4% of residents speak Asian or Pacific Island language at home (50% speak English very well, 47% speak English well, 3% speak English not well).
0.8% of residents speak other language at home (79% speak English very well, 21% speak English well).
Foreign born population: 666 (5.3%)
(74.2% of them are naturalized citizens)
| Here: | -666666666.0 |
| State: | 6.3 |
| Here: | 5.7 |
| State: | 4.0 |
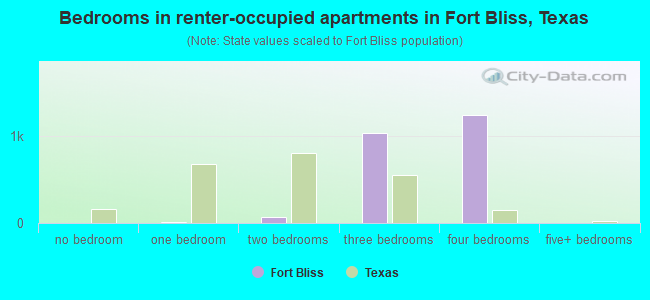
- Bedrooms in renter-occupied apartments in Fort Bliss, Texas
- 0no bedroom
- 91 bedroom
- 702 bedrooms
- 1,0293 bedrooms
- 1,2374 bedrooms
- 05+ bedrooms
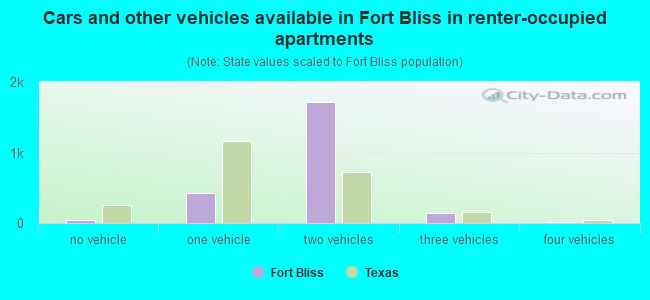
- Cars and other vehicles available in Fort Bliss in renter-occupied apartments
- 45no vehicle
- 4311 vehicle
- 1,7152 vehicles
- 1383 vehicles
- 164 vehicles
- 05+ vehicles
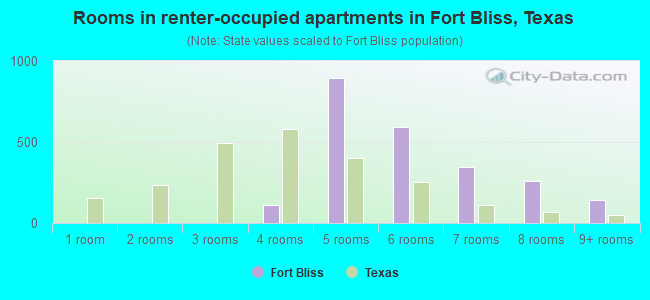
- Rooms in renter-occupied apartments in Fort Bliss, Texas
- 01 room
- 02 rooms
- 03 rooms
- 1094 rooms
- 8935 rooms
- 5926 rooms
- 3457 rooms
- 2618 rooms
- 1459+ rooms
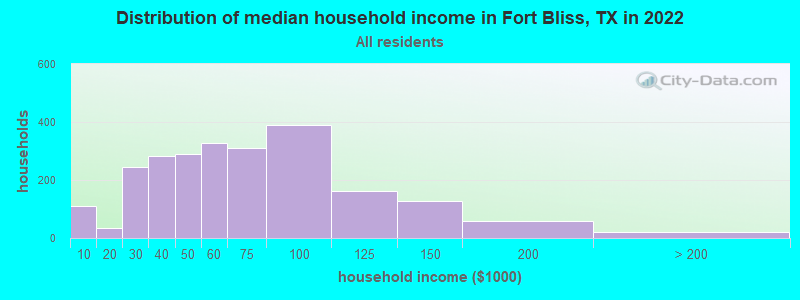
Fort Bliss, TX household income distribution

- 109Less than $10,000
- 35$10,000 to $19,999
- 244$20,000 to $29,999
- 284$30,000 to $39,999
- 288$40,000 to $49,999
- 329$50,000 to $59,999
- 311$60,000 to $74,999
- 388$75,000 to $99,999
- 163$100,000 to $124,999
- 129$125,000 to $149,999
- 59$150,000 to $199,999
- 22$200,000 or more
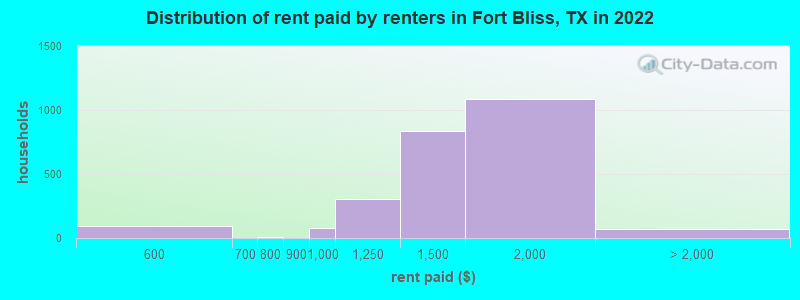
Rent paid by renters in 2022 in Fort Bliss, TX
-
- 8$250 to $299
- 97$500 to $549
- 5$700 to $749
- 79$900 to $999
- 306$1,000 to $1,249
- 835$1,250 to $1,499
- 1,088$1,500 to $1,999
- 39$2,000 to $2,499
- 33No cash rent
Percentage of workers working in this county: 94.4%
Number of people working at home: 647 (10.1% of all workers)
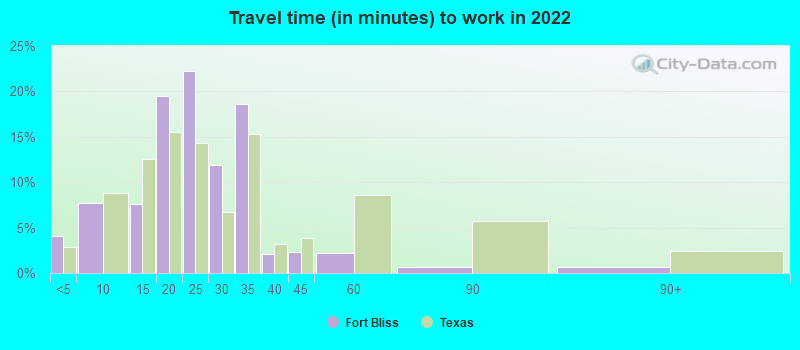
Travel time to work (commute)
- Less than 5 minutes: 815
- 5 to 9 minutes: 1,277
- 10 to 14 minutes: 868
- 15 to 19 minutes: 1,182
- 20 to 24 minutes: 671
- 25 to 29 minutes: 188
- 30 to 34 minutes: 270
- 35 to 39 minutes: 54
- 40 to 44 minutes: 14
- 45 to 59 minutes: 83
- 60 to 89 minutes: 26
- 90 or more minutes: 24
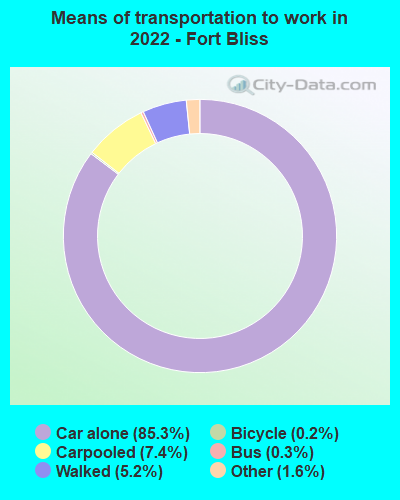
Means of transportation to work:
- Drove a car alone: 24,150 (81.4%)
- Carpooled: 2,366 (8.0%)
- Bus: 45 (0.2%)
- Taxi: 364 (1.2%)
- Bicycle: 57 (0.2%)
- Walked: 1,644 (5.5%)
- Worked at home: 647 (2.2%)
- Unemployment by race in 2022
- Unemployment rate for White non-Hispanic residents
- 10.3%Females
- Unemployment rate for Black residents
- 15.9%Males
- 13.0%Females
- Unemployment rate for other race residents
- 12.1%Females
- Unemployment rate for Hispanic or Latino residents
- 10.0%Females
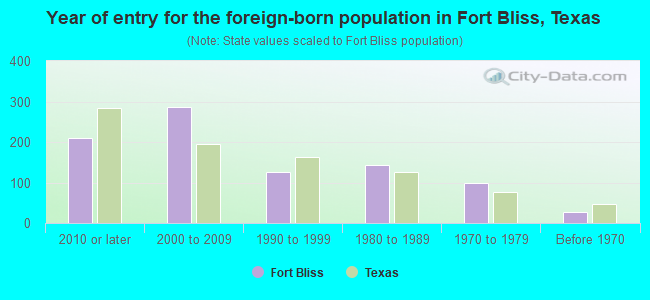
- Year of entry for the foreign-born population in Fort Bliss, Texas
- 2112010 or later
- 2862000 to 2009
- 1271990 to 1999
- 1431980 to 1989
- 991970 to 1979
- 27Before 1970
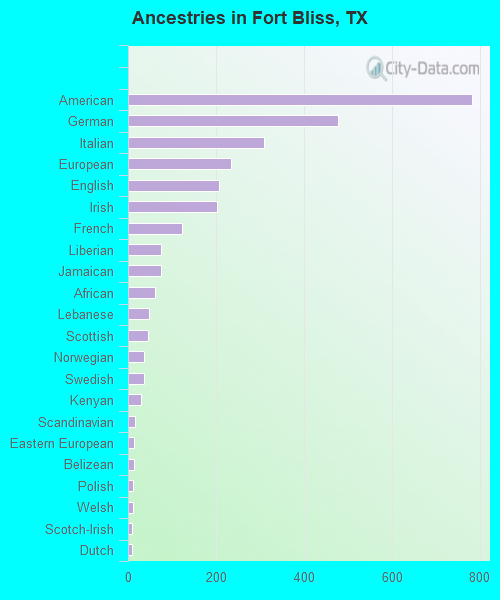
First ancestries reported:
- American: 782 (11.6%)
- German: 478 (7.1%)
- Italian: 309 (4.6%)
- European: 234 (3.5%)
- English: 207 (3.1%)
- Irish: 202 (3.0%)
- French: 123 (1.8%)
- Liberian: 76 (1.1%)
- Jamaican: 76 (1.1%)
- African: 62 (0.9%)
- Lebanese: 47 (0.7%)
- Scottish: 45 (0.7%)
- Norwegian: 36 (0.5%)
- Swedish: 36 (0.5%)
- Kenyan: 29 (0.4%)
- Scandinavian: 15 (0.2%)
- Eastern European: 14 (0.2%)
- Belizean: 13 (0.2%)
- Polish: 12 (0.2%)
- Welsh: 11 (0.2%)
- Scotch-Irish: 10 (0.1%)
- Dutch: 8 (0.1%)
- Brazilian: 7 (0.1%)
- Swiss: 7 (0.1%)
- Belgian: 5 (0.07%)
- Hungarian: 5 (0.07%)
- Nigerian: 5 (0.07%)
- Luxembourger: 4 (0.06%)
- Czechoslovakian: 3 (0.04%)
Most common places of birth for foreign-born residents (%):
| Fort Bliss: | 25.4% (172) |
| Texas: | 48.4% (2,411,723) |
| Fort Bliss: | 17.3% (117) |
| Texas: | 0.4% (17,748) |
| Fort Bliss: | 9.6% (65) |
| Texas: | 1.2% (60,172) |
| Fort Bliss: | 8.4% (57) |
| Texas: | 2.1% (103,148) |
| Fort Bliss: | 6.1% (41) |
| Texas: | 0.1% (5,906) |
| Fort Bliss: | 5.8% (39) |
| Texas: | 1.2% (61,555) |
| Fort Bliss: | 5.2% (35) |
| Texas: | 0.4% (20,458) |
| Fort Bliss: | 3.0% (20) |
| Texas: | 0.0% (1,934) |
| Fort Bliss: | 2.2% (15) |
| Texas: | 0.3% (15,368) |
| Fort Bliss: | 2.1% (14) |
| Texas: | 2.3% (115,558) |
| Fort Bliss: | 2.1% (14) |
| Texas: | 0.2% (9,629) |
| Fort Bliss: | 1.8% (12) |
| Texas: | 1.3% (62,978) |
| Fort Bliss: | 1.8% (12) |
| Texas: | 0.1% (2,928) |
| Fort Bliss: | 1.6% (11) |
| Texas: | 0.1% (4,295) |
Place of birth for U.S.-born residents:
- This state: 2,064
- Other state: 8,593
- Northeast: 464
- Midwest: 1,707
- South: 3,961
- West: 2,571
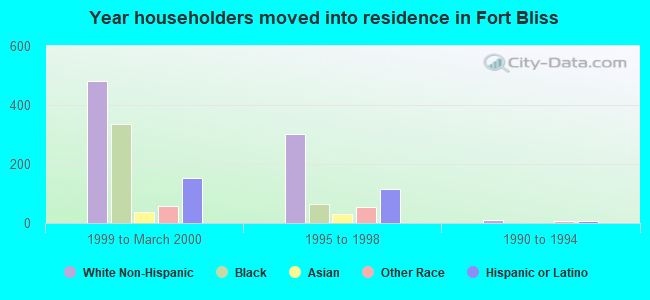
57.5% of Fort Bliss residents lived in the same house 1 years ago.
Out of people who lived in different houses, 11.2% lived in this county.
Out of people who lived in different counties, 15.3% lived in Texas.
| Fort Bliss: | 57.5% |
| State average: | 85.7% |
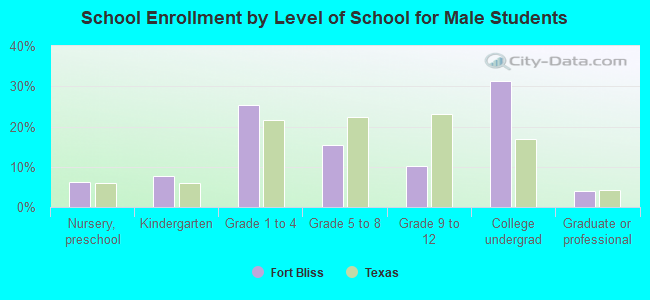
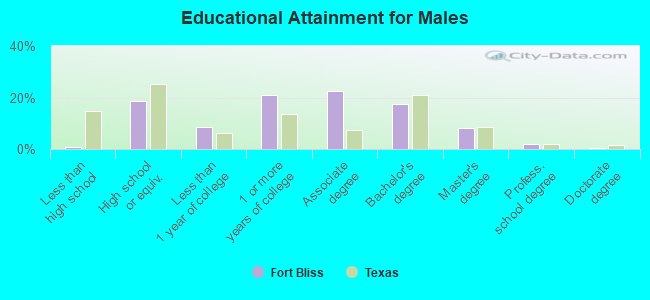
Education attainment for males 25 years and older:
- No schooling: 0
- Nursery to 4th grade: 0
- 5th and 6th grade: 0
- 7th and 8th grade: 0
- 9th grade: 0
- 10th grade: 0
- 11th grade: 15
- 12th grade, no diploma: 12
- High school graduate (or equivalency): 548
- Less than 1 year of college: 244
- Some college more than 1 year, no degree: 616
- Associate degree: 654
- Bachelor's degree: 513
- Master's degree: 243
- Professional school degree: 60
- Doctorate degree: 7
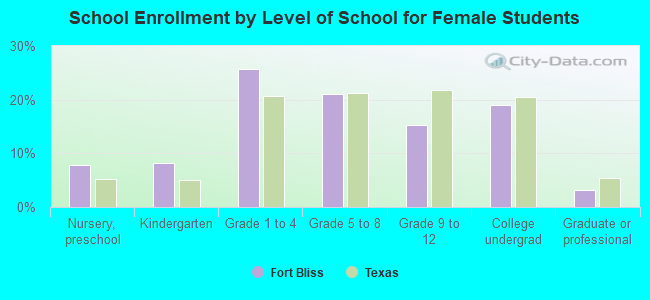
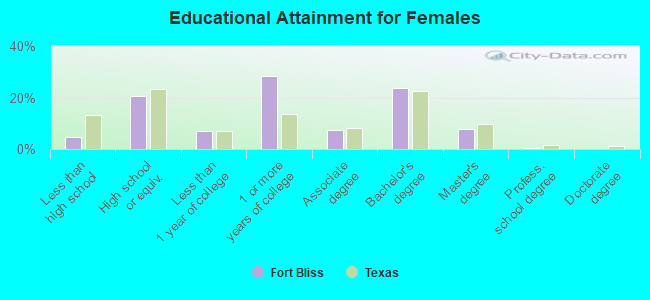
Education attainment for females 25 years and older:
- No schooling: 4
- Nursery to 4th grade: 0
- 5th and 6th grade: 0
- 7th and 8th grade: 0
- 9th grade: 17
- 10th grade: 0
- 11th grade: 0
- 12th grade, no diploma: 69
- High school graduate (or equivalency): 394
- Less than 1 year of college: 133
- Some college more than 1 year, no degree: 549
- Associate degree: 140
- Bachelor's degree: 460
- Master's degree: 150
- Professional school degree: 11
- Doctorate degree: 0
Housing units in structures:
- One, detached: 987
- One, attached: 996
- Two: 160
- 3 or 4: 496
- 50 or more: 9
Housing units lacking complete kitchen facilities in 2022: 3.3%
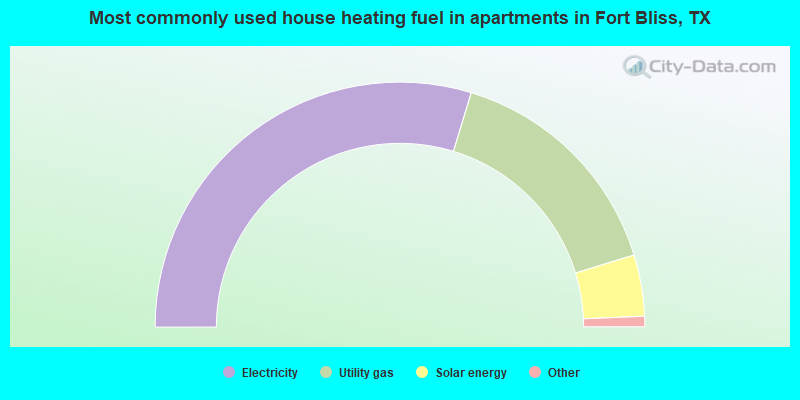
- 59.4%Electricity
- 31.1%Utility gas
- 8.1%Solar energy
- 0.7%No fuel used
- 0.7%Bottled, tank, or LP gas
Private vs. public school enrollment:
| Here: | 11.3% |
| Texas: | 8.8% |
| Here: | 0.6% |
| Texas: | 8.0% |
| Here: | 10.1% |
| Texas: | 16.2% |