Fort Gibson, OK (Oklahoma) Houses and Residents
| Fort Gibson: | $179,281 |
| Oklahoma: | $191,700 |
Mean price in 2022:
Detached houses: $209,870
Here: $209,870 State: $255,409 Mobile homes: $67,800
Here: $67,800 State: $110,804
Total population: 4,104 (Urban population: 3,586 (all inside urban clusters), Rural population: 471 (all nonfarm))
Houses: 1,850 (1,676 occupied: 1,127 owner occupied, 562 renter occupied)
| % of renters here: | 33% |
| State: | 35% |
Housing density: 138 houses/condos per square mile
Median price asked for vacant for-sale houses and condos in 2022: $682,640.
Median contract rent in 2022: $608 (lower quartile is $367, upper quartile is $706)
Median rent asked for vacant for-rent units in 2022: $560
Median gross rent in Fort Gibson, OK in 2022: $718
Housing units in Fort Gibson with a mortgage: 750 (19 second mortgage, 26 home equity loan, 14 both second mortgage and home equity loan)
Houses without a mortgage: 38
Median household income for houses/condos with a mortgage: $106,866
Median household income for apartments without a mortgage: $69,834
Median monthly housing costs: $817
Compare current foreclosures near Fort Gibson, OK:
| Photo | Address | Area | Beds / Baths | Price | Details |
|---|---|---|---|---|---|

|
#1
Bowden Pl
Fort Gibson, OK 74434
|
1,591 sq. feet
|
2 baths 3 beds |
$233,500
|
show details |

|
#2
Leaning Tree Rd
Fort Gibson, OK 74434
|
1,316 sq. feet
|
1 baths 3 beds |
show details | |

|
#3
Irene Ln
Fort Gibson, OK 74434
|
1,488 sq. feet
|
2 baths 3 beds |
show details | |

|
#4
W 805 Rd
Fort Gibson, OK 74434
|
- sq. feet
|
- baths - beds |
show details | |

|
#5
S Lee St
Fort Gibson, OK 74434
|
- sq. feet
|
- baths - beds |
show details | |

|
#6
W 805 Rd
Fort Gibson, OK 74434
|
- sq. feet
|
- baths - beds |
show details | |

|
#7
N 4 Mile Rd
Fort Gibson, OK 74434
|
- sq. feet
|
- baths - beds |
show details | |

|
#8
N 49th St E
Fort Gibson, OK 74434
|
- sq. feet
|
- baths - beds |
show details | |

|
#9
S Arthur Ave
Wagoner, OK 74467
|
1,991 sq. feet
|
3 baths 3 beds |
$243,900
|
show details |

|
#10
S Cherokee St
Muskogee, OK 74403
|
2,176 sq. feet
|
1 baths 3 beds |
$325,000
|
show details |
| Photo | Address | Area | Beds / Baths | Price | Details |
|---|---|---|---|---|---|

|
#11
W Stick Ross Mountain Cir
Tahlequah, OK 74464
|
1,500 sq. feet
|
1 baths 4 beds |
$212,000
|
show details |

|
#12
Cyclone Ln
Wagoner, OK 74467
|
2,223 sq. feet
|
2 baths 4 beds |
$397,500
|
show details |

|
#13
NE 2nd St
Wagoner, OK 74467
|
1,508 sq. feet
|
2 baths 3 beds |
show details | |

|
#14
Carolyn St
Muskogee, OK 74401
|
1,069 sq. feet
|
1 baths 2 beds |
show details | |

|
#15
S Monroe Ave
Wagoner, OK 74467
|
1,161 sq. feet
|
2 baths 3 beds |
show details | |

|
#16
E 107th St N
Wagoner, OK 74467
|
1,716 sq. feet
|
2 baths 3 beds |
show details | |

|
#17
W Willis Rd
Tahlequah, OK 74464
|
1,088 sq. feet
|
1 baths 2 beds |
show details | |

|
#18
Circle Dr
Muskogee, OK 74403
|
875 sq. feet
|
1 baths 3 beds |
show details | |

|
#19
NE 2nd St
Wagoner, OK 74467
|
1,262 sq. feet
|
2 baths 3 beds |
show details | |

|
#20
Garland St
Muskogee, OK 74401
|
1,112 sq. feet
|
1 baths 2 beds |
show details |
| Photo | Address | Area | Beds / Baths | Price | Details |
|---|---|---|---|---|---|

|
#21
S 29th St
Muskogee, OK 74401
|
1,456 sq. feet
|
1 baths 3 beds |
show details | |

|
#22
S 73rd St W
Muskogee, OK 74401
|
1,140 sq. feet
|
1 baths 2 beds |
show details | |

|
#23
N 35th St
Muskogee, OK 74401
|
876 sq. feet
|
1 baths 3 beds |
show details | |

|
#24
Palmer Dr
Muskogee, OK 74401
|
1,191 sq. feet
|
1 baths 2 beds |
show details | |

|
#25
Blue Jay Ln
Muskogee, OK 74403
|
1,341 sq. feet
|
2 baths 3 beds |
show details | |

|
#26
Quail Run
Muskogee, OK 74403
|
1,292 sq. feet
|
2 baths 3 beds |
show details | |

|
#27
Grandview Blvd
Muskogee, OK 74403
|
1,492 sq. feet
|
2 baths 4 beds |
show details | |

|
#28
W Main St
Hulbert, OK 74441
|
1,216 sq. feet
|
2 baths 3 beds |
show details | |

|
#29
S 26th St
Muskogee, OK 74401
|
1,596 sq. feet
|
2 baths 3 beds |
show details | |

|
#30
Elwell Rd
Muskogee, OK 74401
|
978 sq. feet
|
1 baths 3 beds |
show details |
| Photo | Address | Area | Beds / Baths | Price | Details |
|---|---|---|---|---|---|

|
#31
W Clyde Maher Rd
Tahlequah, OK 74464
|
1,020 sq. feet
|
1 baths 2 beds |
show details | |

|
#32
S 54th St
Muskogee, OK 74401
|
2,149 sq. feet
|
2 baths 3 beds |
show details | |

|
#33
Kendall Blvd
Muskogee, OK 74401
|
48 sq. feet
|
2 baths 3 beds |
show details | |

|
#34
S 41st St E
Muskogee, OK 74403
|
1,439 sq. feet
|
2 baths 3 beds |
show details | |

|
#35
S 3rd St
Muskogee, OK 74401
|
1,200 sq. feet
|
2 baths 3 beds |
show details | |

|
#36
S B St
Muskogee, OK 74403
|
1,266 sq. feet
|
2 baths 2 beds |
show details | |

|
#37
E 18th St S
Muskogee, OK 74403
|
1,456 sq. feet
|
1 baths 3 beds |
show details | |

|
#38
Bacon Rd
Muskogee, OK 74403
|
2,581 sq. feet
|
2 baths 3 beds |
show details | |

|
#39
Hillcrest Ave
Tahlequah, OK 74464
|
1,700 sq. feet
|
1 baths 3 beds |
show details | |

|
#40
Highway 62
Tahlequah, OK 74464
|
1,683 sq. feet
|
1 baths 3 beds |
show details |
| Photo | Address | Area | Beds / Baths | Price | Details |
|---|---|---|---|---|---|

|
#41
N David Ln
Muskogee, OK 74403
|
1,680 sq. feet
|
2 baths 2 beds |
show details | |

|
#42
Se15 St
Wagoner, OK 74467
|
1,518 sq. feet
|
2 baths - beds |
show details | |

|
#43
Elton Dr
Muskogee, OK 74403
|
1,633 sq. feet
|
2 baths 3 beds |
show details | |

|
#44
Irving St
Muskogee, OK 74403
|
972 sq. feet
|
1 baths 2 beds |
show details | |

|
#45
Tull Pl
Muskogee, OK 74403
|
1,328 sq. feet
|
2 baths 3 beds |
show details | |

|
#46
W Golf Course Rd
Tahlequah, OK 74464
|
1,953 sq. feet
|
2 baths 4 beds |
show details | |

|
#47
N T St
Muskogee, OK 74403
|
1,956 sq. feet
|
2 baths 3 beds |
show details | |

|
#48
Baltimore St
Muskogee, OK 74403
|
808 sq. feet
|
1 baths 2 beds |
show details | |

|
#49
S Sizemore Rd
Park Hill, OK 74451
|
3,568 sq. feet
|
3 baths 4 beds |
show details | |

|
Check over 1 million property listings on Foreclosure.com!
|
browse all offers | |||


 | Need as much info as possible on Muskogee (6 replies) |
| Where to live near Muskogee?? (2 replies) |
| Is the any Justice? (Fort Gibson, OK) (10 replies) |
| Lake house near Tulsa? (7 replies) |
| Relocation Question- Central Park Condominiums-deer hunting (20 replies) |
| Moving to Oklahoma, where is a good place to live? (15 replies) |

Median year apartment built: 1982
Household type by relationship:
Households: 3,795- Male householders: 694 (240 living alone), Female householders: 979 (361 living alone)
733 spouses (733 opposite-sex spouses), 87 unmarried partners, (87 opposite-sex unmarried partners), 1,112 children (919 natural, 115 adopted, 77 stepchildren), 52 grandchildren, 33 brothers or sisters, 15 parents, 0 foster children, 29 other relatives, 0 non-relatives
- In group quarters: 55
Size of family households: 472 2-persons, 259 3-persons, 143 4-persons, 78 5-persons, 47 6-persons.
Size of nonfamily households: 595 1-person, 107 2-persons.
411 married couples with children.
384 single-parent households (55 men, 329 women).
98.8% of residents of Fort Gibson speak English at home.
0.6% of residents speak Spanish at home (100% speak English very well).
0.5% of residents speak other language at home (100% speak English very well).
| Here: | 6.4 |
| State: | 6.1 |
| Here: | 4.1 |
| State: | 4.5 |

- Bedrooms in owner-occupied houses and condos in Fort Gibson, Oklahoma
- 0no bedroom
- 261 bedroom
- 1502 bedrooms
- 7373 bedrooms
- 1934 bedrooms
- 215+ bedrooms

- Bedrooms in renter-occupied apartments in Fort Gibson, Oklahoma
- 62no bedroom
- 651 bedroom
- 2542 bedrooms
- 1293 bedrooms
- 524 bedrooms
- 05+ bedrooms

- Cars and other vehicles available in Fort Gibson in owner-occupied houses/condos
- 0no vehicle
- 2601 vehicle
- 4982 vehicles
- 2233 vehicles
- 1084 vehicles
- 395+ vehicles

- Cars and other vehicles available in Fort Gibson in renter-occupied apartments
- 169no vehicle
- 2921 vehicle
- 742 vehicles
- 273 vehicles
- 04 vehicles
- 05+ vehicles

- Rooms in owner-occupied houses in Fort Gibson, Oklahoma
- 01 room
- 02 rooms
- 03 rooms
- 1004 rooms
- 2595 rooms
- 3526 rooms
- 1557 rooms
- 1168 rooms
- 1479+ rooms

- Rooms in renter-occupied apartments in Fort Gibson, Oklahoma
- 461 room
- 342 rooms
- 383 rooms
- 2414 rooms
- 1235 rooms
- 106 rooms
- 527 rooms
- 178 rooms
- 09+ rooms


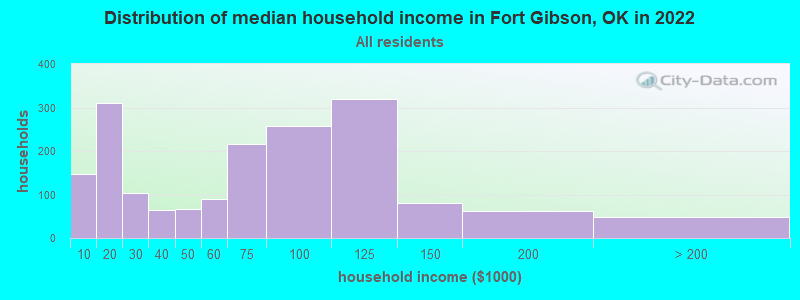
Fort Gibson, OK household income distribution

- 146Less than $10,000
- 311$10,000 to $19,999
- 104$20,000 to $29,999
- 65$30,000 to $39,999
- 67$40,000 to $49,999
- 90$50,000 to $59,999
- 216$60,000 to $74,999
- 257$75,000 to $99,999
- 319$100,000 to $124,999
- 80$125,000 to $149,999
- 63$150,000 to $199,999
- 48$200,000 or more
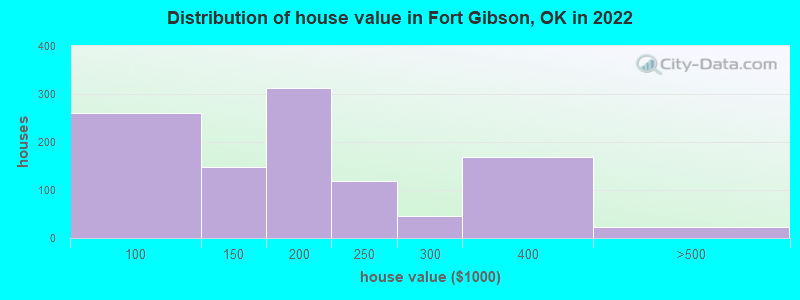
Home value of owner - occupied houses in 2022 in Fort Gibson, OK
-
- 38$50,000 to $59,999
- 33$60,000 to $69,999
- 71$70,000 to $79,999
- 70$80,000 to $89,999
- 46$90,000 to $99,999
- 33$100,000 to $124,999
- 114$125,000 to $149,999
- 110$150,000 to $174,999
- 201$175,000 to $199,999
- 118$200,000 to $249,999
- 46$250,000 to $299,999
- 168$300,000 to $399,999
- 22$400,000 to $499,999
Rent paid by renters in 2022 in Fort Gibson, OK
-
- 28$100 to $149
- 56$150 to $199
- 17$200 to $249
- 53$300 to $349
- 32$350 to $399
- 11$450 to $499
- 38$500 to $549
- 78$550 to $599
- 70$600 to $649
- 94$650 to $699
- 13$700 to $749
- 35$900 to $999
- 64$1,000 to $1,249
- 37No cash rent


Percentage of workers working in this county: 75.8%
Number of people working at home: 267 (14.2% of all workers)
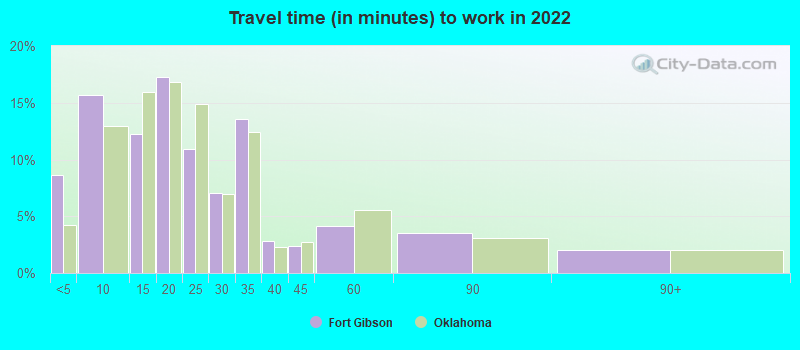
Travel time to work (commute)
- Less than 5 minutes: 244
- 5 to 9 minutes: 234
- 10 to 14 minutes: 113
- 15 to 19 minutes: 425
- 20 to 24 minutes: 144
- 25 to 29 minutes: 136
- 30 to 34 minutes: 152
- 35 to 39 minutes: 0
- 40 to 44 minutes: 22
- 45 to 59 minutes: 177
- 60 to 89 minutes: 23
- 90 or more minutes: 57
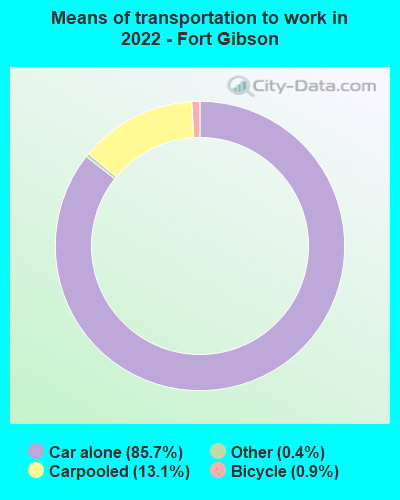
Means of transportation to work:
- Drove a car alone: 1,214 (73.0%)
- Carpooled: 189 (11.4%)
- Taxi: 4 (0.2%)
- Bicycle: 12 (0.7%)
- Worked at home: 267 (16.1%)

- Unemployment by race in 2022
- Unemployment rate for White non-Hispanic residents
- 4.2%Males
- Unemployment rate for American Indian and Alaska Native residents
- 3.8%Females
- Unemployment rate for two or more race residents
- 5.7%Females

- Year of entry for the foreign-born population in Fort Gibson, Oklahoma
- 651995 to March 2000
- 221990 to 1994
- 221985 to 1989
- 31980 to 1984
- 31975 to 1979
- 41970 to 1974
- 01965 to 1969
- 4Before 1965

First ancestries reported:
- American: 274 (13.0%)
- Irish: 211 (10.0%)
- English: 172 (8.2%)
- European: 102 (4.8%)
- German: 47 (2.2%)
- Scandinavian: 13 (0.6%)
- Scottish: 13 (0.6%)
Most common places of birth for foreign-born residents (%):
| Fort Gibson: | 74.8% (92) |
| Oklahoma: | 42.5% (55,971) |
| Fort Gibson: | 11.4% (14) |
| Oklahoma: | 7.6% (9,958) |
| Fort Gibson: | 5.7% (7) |
| Oklahoma: | 2.8% (3,710) |
| Fort Gibson: | 4.9% (6) |
| Oklahoma: | 4.7% (6,144) |
| Fort Gibson: | 3.3% (4) |
| Oklahoma: | 2.9% (3,814) |
Place of birth for U.S.-born residents:
- This state: 2,979
- Other state: 806
- Northeast: 0
- Midwest: 231
- South: 324
- West: 222
89.3% of Fort Gibson residents lived in the same house 1 years ago.
Out of people who lived in different houses, 34.7% lived in this county.
Out of people who lived in different counties, 100.0% lived in Oklahoma.
| Fort Gibson: | 89.3% |
| State average: | 85.5% |
Education attainment for males 25 years and older:
- No schooling: 22
- Nursery to 4th grade: 0
- 5th and 6th grade: 2
- 7th and 8th grade: 0
- 9th grade: 7
- 10th grade: 21
- 11th grade: 27
- 12th grade, no diploma: 0
- High school graduate (or equivalency): 454
- Less than 1 year of college: 0
- Some college more than 1 year, no degree: 148
- Associate degree: 22
- Bachelor's degree: 270
- Master's degree: 30
- Professional school degree: 42
- Doctorate degree: 16

Education attainment for females 25 years and older:
- No schooling: 0
- Nursery to 4th grade: 0
- 5th and 6th grade: 13
- 7th and 8th grade: 7
- 9th grade: 0
- 10th grade: 0
- 11th grade: 10
- 12th grade, no diploma: 5
- High school graduate (or equivalency): 339
- Less than 1 year of college: 158
- Some college more than 1 year, no degree: 221
- Associate degree: 154
- Bachelor's degree: 442
- Master's degree: 108
- Professional school degree: 0
- Doctorate degree: 42


Housing units in structures:
- One, detached: 1,274
- One, attached: 17
- Two: 124
- 3 or 4: 69
- 5 to 9: 22
- 10 to 19: 113
- 20 to 49: 16
- Mobile homes: 209
Median worth of mobile homes: $96,499
Housing units lacking complete kitchen facilities in 2022: 1.8%
House/condo owner moved in on average 14 years ago
Renter moved in on average 3 years ago

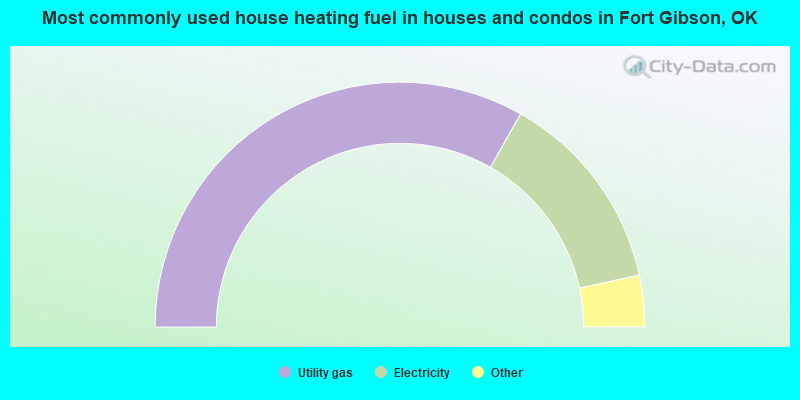
- 66.5%Utility gas
- 26.8%Electricity
- 3.7%Bottled, tank, or LP gas
- 3.0%Wood
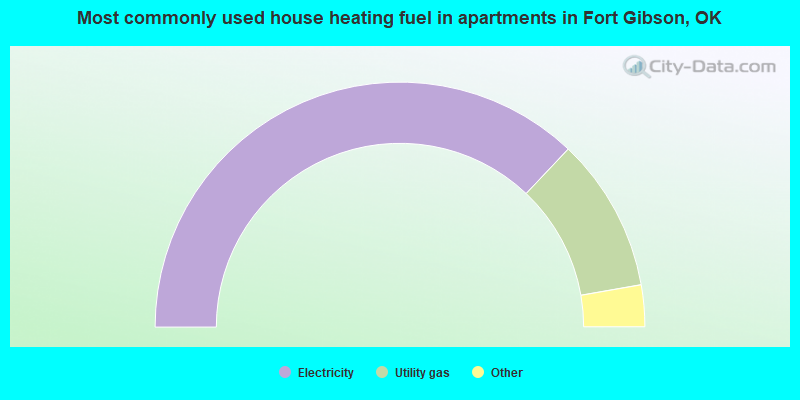
- 74.2%Electricity
- 20.4%Utility gas
- 3.4%Wood
- 2.0%No fuel used
Private vs. public school enrollment:
| Here: | 3.7% |
| Oklahoma: | 11.7% |
| Here: | 7.4% |
| Oklahoma: | 11.7% |
| Here: | 16.0% |
| Oklahoma: | 19.3% |


