Fort Lawn, SC (South Carolina) Houses and Residents
| Fort Lawn: | $176,642 |
| South Carolina: | $254,600 |
Mean price in 2022:
Detached houses: $155,423
Here: $155,423 State: $368,255 Mobile homes: $90,425
Here: $90,425 State: $102,531
Total population: 870 (Urban population: 0, Rural population: 868 (7 farm, 861 nonfarm))
Houses: 427 (397 occupied: 261 owner occupied, 143 renter occupied)
| % of renters here: | 35% |
| State: | 28% |
Housing density: 309 houses/condos per square mile
Median price asked for vacant for-sale houses and condos in 2022 in this county: $126,519.
Median contract rent in 2022: $883 (lower quartile is $779, upper quartile is $937)
Median rent asked for vacant for-rent units in 2022: $4,109
Median gross rent in Fort Lawn, SC in 2022: $1,181
Housing units in Fort Lawn with a mortgage: 136 (4 second mortgage, 0 home equity loan, 3 both second mortgage and home equity loan)
Houses without a mortgage: 5
Median household income for houses/condos with a mortgage: $80,160
Median household income for apartments without a mortgage: $46,769
Median monthly housing costs: $915
Compare current foreclosures near Fort Lawn, SC:
| Photo | Address | Area | Beds / Baths | Price | Details |
|---|---|---|---|---|---|

|
#1
Stinson Rd
Fort Lawn, SC 29714
|
- sq. feet
|
- baths - beds |
show details | |

|
#2
W Shiloh Unity Rd
Lancaster, SC 29720
|
- sq. feet
|
2 baths 3 beds |
show details | |

|
#3
Windblown Pl
Rock Hill, SC 29730
|
1,840 sq. feet
|
3 baths 3 beds |
show details | |

|
#4
Kershaw St
Lancaster, SC 29720
|
1,040 sq. feet
|
2 baths 3 beds |
show details | |

|
#5
Whitner St
Rock Hill, SC 29730
|
833 sq. feet
|
1 baths 2 beds |
show details | |

|
#6
Spruce Pine Trl
Waxhaw, NC 28173
|
1,559 sq. feet
|
1 baths 2 beds |
show details | |

|
#7
Waxhaw Creek Rd
Waxhaw, NC 28173
|
1,440 sq. feet
|
2 baths - beds |
show details | |

|
#8
Waxhaw Creek Rd
Waxhaw, NC 28173
|
1,056 sq. feet
|
1 baths - beds |
show details | |

|
#9
Mccain Blvd
Waxhaw, NC 28173
|
1,568 sq. feet
|
1 baths - beds |
show details | |

|
#10
Braintree Ter
Rock Hill, SC 29730
|
- sq. feet
|
- baths - beds |
show details |
| Photo | Address | Area | Beds / Baths | Price | Details |
|---|---|---|---|---|---|

|
#11
Rough Hewn Ln
Rock Hill, SC 29730
|
- sq. feet
|
- baths - beds |
show details | |

|
#12
Firewood Rd
Lancaster, SC 29720
|
- sq. feet
|
- baths - beds |
show details | |

|
#13
Shady Oak Ln
Rock Hill, SC 29730
|
- sq. feet
|
- baths - beds |
show details | |

|
#14
Earl Cauthen Rd
Heath Springs, SC 29058
|
- sq. feet
|
2 baths - beds |
show details | |

|
#15
Border Rd E
Rock Hill, SC 29730
|
- sq. feet
|
- baths - beds |
show details | |

|
#16
Confederate Ave
Lancaster, SC 29720
|
- sq. feet
|
2 baths - beds |
show details | |

|
#17
Abbey Ct
Lancaster, SC 29720
|
- sq. feet
|
1 baths - beds |
show details | |

|
#18
Grace Ave
Lancaster, SC 29720
|
- sq. feet
|
1 baths - beds |
show details | |

|
#19
Marty Ln
Lancaster, SC 29720
|
- sq. feet
|
2 baths - beds |
show details | |

|
#20
Faulkenberry Rd
Rock Hill, SC 29730
|
- sq. feet
|
- baths - beds |
show details |
| Photo | Address | Area | Beds / Baths | Price | Details |
|---|---|---|---|---|---|

|
#21
Hagler Dr
Rock Hill, SC 29730
|
- sq. feet
|
- baths - beds |
show details | |

|
#22
Pennington Dr
Lancaster, SC 29720
|
- sq. feet
|
- baths - beds |
show details | |

|
#23
Abbey Ct
Lancaster, SC 29720
|
- sq. feet
|
1 baths - beds |
show details | |

|
#24
Kendlewood Dr
Lancaster, SC 29720
|
- sq. feet
|
1 baths - beds |
show details | |

|
#25
Astella Way
Lancaster, SC 29720
|
- sq. feet
|
- baths - beds |
show details | |

|
#26
Hathaway Dr
Rock Hill, SC 29730
|
- sq. feet
|
- baths - beds |
show details | |

|
#27
Scotland Ave
Fort Mill, SC 29707
|
- sq. feet
|
- baths - beds |
show details | |

|
#28
Springdale Rd Apt 104
Rock Hill, SC 29730
|
- sq. feet
|
- baths - beds |
show details | |

|
#29
Shetland Ln
Rock Hill, SC 29730
|
- sq. feet
|
- baths - beds |
show details | |

|
#30
Agora Ct
Lancaster, SC 29720
|
- sq. feet
|
- baths - beds |
show details |
| Photo | Address | Area | Beds / Baths | Price | Details |
|---|---|---|---|---|---|

|
#31
Tenby Dr, Apt 107
Rock Hill, SC 29730
|
- sq. feet
|
- baths - beds |
show details | |

|
#32
Tenby Dr, Apt 305
Rock Hill, SC 29730
|
- sq. feet
|
- baths - beds |
show details | |

|
#33
Doby Dr
Rock Hill, SC 29730
|
- sq. feet
|
- baths - beds |
show details | |

|
#34
N Jones Ave Apt C
Rock Hill, SC 29730
|
- sq. feet
|
- baths - beds |
show details | |

|
#35
Green St
Rock Hill, SC 29730
|
- sq. feet
|
- baths - beds |
show details | |

|
#36
Union Church Rd
Lancaster, SC 29720
|
- sq. feet
|
2 baths - beds |
show details | |

|
#37
Annafrel St
Rock Hill, SC 29730
|
- sq. feet
|
- baths - beds |
show details | |

|
#38
Wallace Lake Rd
Fort Mill, SC 29707
|
- sq. feet
|
- baths - beds |
show details | |

|
#39
Alston Dr
Lancaster, SC 29720
|
- sq. feet
|
- baths - beds |
show details | |

|
#40
Thompson Rd
Lancaster, SC 29720
|
- sq. feet
|
2 baths - beds |
show details |
| Photo | Address | Area | Beds / Baths | Price | Details |
|---|---|---|---|---|---|

|
#41
Wilson Dr
Lancaster, SC 29720
|
- sq. feet
|
- baths - beds |
show details | |

|
#42
Sunshine Rd
Lancaster, SC 29720
|
- sq. feet
|
1 baths - beds |
show details | |

|
#43
Tiger Paw Ln
Lancaster, SC 29720
|
- sq. feet
|
2 baths - beds |
show details | |

|
#44
Travertine Dr
Lancaster, SC 29720
|
- sq. feet
|
3 baths - beds |
show details | |

|
#45
W Arch St
Lancaster, SC 29720
|
- sq. feet
|
2 baths - beds |
show details | |

|
#46
W Shiloh Unity Rd
Lancaster, SC 29720
|
- sq. feet
|
2 baths - beds |
show details | |

|
#47
Old Camden Hwy
Lancaster, SC 29720
|
- sq. feet
|
- baths - beds |
show details | |

|
#48
Camp Creek Rd
Lancaster, SC 29720
|
- sq. feet
|
2 baths - beds |
show details | |

|
#49
Edgeland Rd
Edgemoor, SC 29712
|
- sq. feet
|
- baths - beds |
show details | |

|
Check over 1 million property listings on Foreclosure.com!
|
browse all offers | |||


 | ATL fan's Greenville SC Planning Commision (1271 replies) |
| W O W in Fort Lawn SC to close (1 reply) |
| Festivals, Fairs, and Fun in York and Lancaster County 2013 (47 replies) |
| New Home Furnishings/Home Decor Store in Lancaster, Maybe old Mill conversion (3 replies) |
| Anybody have info about Chester, SC? (19 replies) |
| Moving from Naples, FL to Lancaster (11 replies) |

Median year apartment built: 1994
Household type by relationship:
Households: 1,180- Male householders: 160 (23 living alone), Female householders: 234 (40 living alone)
179 spouses (179 opposite-sex spouses), 25 unmarried partners, (22 opposite-sex unmarried partners), 488 children (446 natural, 22 adopted, 19 stepchildren), 57 grandchildren, 7 brothers or sisters, 6 parents, 0 foster children, 11 other relatives, 9 non-relatives
Size of family households: 135 2-persons, 82 3-persons, 60 4-persons, 43 5-persons, 3 6-persons, 2 7-or-more-persons.
Size of nonfamily households: 64 1-person, 11 2-persons.
109 married couples with children.
197 single-parent households (2 men, 195 women).
96.1% of residents of Fort Lawn speak English at home.
3.0% of residents speak Spanish at home (100% speak English very well).
0.2% of residents speak other Indo-European language at home (100% speak English very well).
0.4% of residents speak Asian or Pacific Island language at home (100% speak English very well).
Foreign born population: 6 (0.5%)
(100.0% of them are naturalized citizens)
| Here: | 6.1 |
| State: | 6.4 |
| Here: | 4.7 |
| State: | 4.5 |

- Bedrooms in owner-occupied houses and condos in Fort Lawn, South Carolina
- 0no bedroom
- 01 bedroom
- 482 bedrooms
- 1723 bedrooms
- 344 bedrooms
- 85+ bedrooms

- Bedrooms in renter-occupied apartments in Fort Lawn, South Carolina
- 0no bedroom
- 01 bedroom
- 382 bedrooms
- 1063 bedrooms
- 04 bedrooms
- 05+ bedrooms

- Cars and other vehicles available in Fort Lawn in owner-occupied houses/condos
- 26no vehicle
- 381 vehicle
- 1222 vehicles
- 553 vehicles
- 74 vehicles
- 135+ vehicles

- Cars and other vehicles available in Fort Lawn in renter-occupied apartments
- 1no vehicle
- 761 vehicle
- 442 vehicles
- 223 vehicles
- 04 vehicles
- 05+ vehicles

- Rooms in owner-occupied houses in Fort Lawn, South Carolina
- 01 room
- 02 rooms
- 43 rooms
- 354 rooms
- 315 rooms
- 1016 rooms
- 357 rooms
- 228 rooms
- 349+ rooms

- Rooms in renter-occupied apartments in Fort Lawn, South Carolina
- 01 room
- 02 rooms
- 83 rooms
- 514 rooms
- 655 rooms
- 46 rooms
- 157 rooms
- 08 rooms
- 09+ rooms


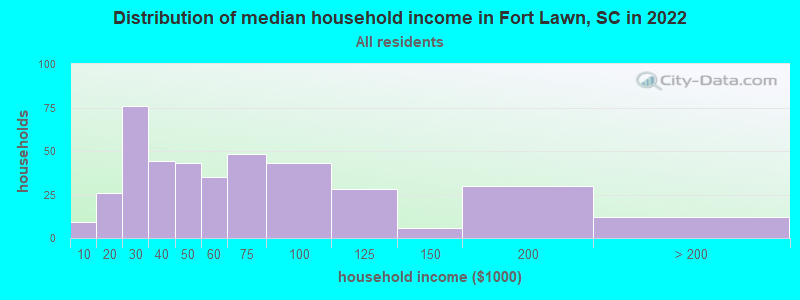
Fort Lawn, SC household income distribution

- 9Less than $10,000
- 26$10,000 to $19,999
- 76$20,000 to $29,999
- 44$30,000 to $39,999
- 43$40,000 to $49,999
- 35$50,000 to $59,999
- 48$60,000 to $74,999
- 43$75,000 to $99,999
- 28$100,000 to $124,999
- 6$125,000 to $149,999
- 30$150,000 to $199,999
- 12$200,000 or more
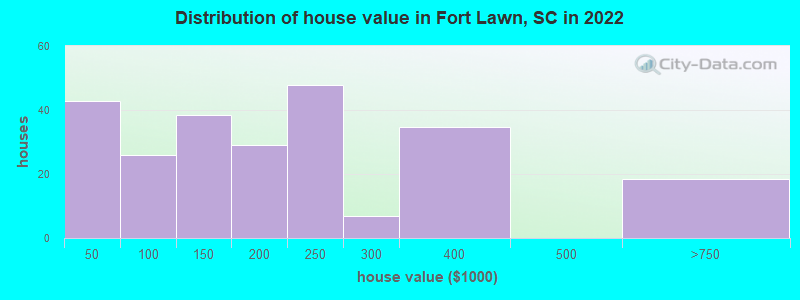
Home value of owner - occupied houses in 2022 in Fort Lawn, SC
-
- 6Less than $10,000
- 18$10,000 to $14,999
- 4$15,000 to $19,999
- 10$20,000 to $24,999
- 3$30,000 to $34,999
- 1$50,000 to $59,999
- 2$60,000 to $69,999
- 3$70,000 to $79,999
- 14$80,000 to $89,999
- 4$90,000 to $99,999
- 26$100,000 to $124,999
- 11$125,000 to $149,999
- 24$150,000 to $174,999
- 4$175,000 to $199,999
- 47$200,000 to $249,999
- 6$250,000 to $299,999
- 34$300,000 to $399,999
- 18$500,000 to $749,999
Rent paid by renters in 2022 in Fort Lawn, SC
-
- 0Less than $100
- 6$450 to $499
- 4$500 to $549
- 22$700 to $749
- 3$750 to $799
- 56$800 to $899
- 18$900 to $999
- 9$1,000 to $1,249
- 8No cash rent


Percentage of workers working in this county: 32.4%
Number of people working at home: 14 (2.9% of all workers)
Travel time to work (commute)
- Less than 5 minutes: 1
- 5 to 9 minutes: 7
- 10 to 14 minutes: 13
- 15 to 19 minutes: 103
- 20 to 24 minutes: 55
- 25 to 29 minutes: 7
- 30 to 34 minutes: 135
- 35 to 39 minutes: 6
- 40 to 44 minutes: 42
- 45 to 59 minutes: 48
- 60 to 89 minutes: 27
- 90 or more minutes: 16
Means of transportation to work:
- Drove a car alone: 311 (79.5%)
- Carpooled: 62 (15.9%)
- Other means: 7 (1.8%)
- Worked at home: 11 (2.8%)

- Unemployment by race in 2022
- Unemployment rate for White non-Hispanic residents
- 3.7%Males
- 6.5%Females
- Unemployment rate for Black residents
- 31.2%Males

- Year of entry for the foreign-born population in Fort Lawn, South Carolina
- 02010 or later
- 42000 to 2009
- 01990 to 1999
- 01980 to 1989
- 61970 to 1979
- 0Before 1970

First ancestries reported:
- American: 170 (22.2%)
- English: 61 (8.0%)
- German: 45 (5.9%)
- African: 13 (1.7%)
- Irish: 6 (0.8%)
- Scottish: 4 (0.5%)
- Scotch-Irish: 3 (0.4%)
- Eastern European: 2 (0.3%)
- European: 2 (0.3%)
- French Canadian: 1 (0.1%)
- Greek: 1 (0.1%)
Most common places of birth for foreign-born residents (%):
| Fort Lawn: | 50.0% (3) |
| South Carolina: | 0.7% (1,840) |
| Fort Lawn: | 33.3% (2) |
| South Carolina: | 0.5% (1,296) |
Place of birth for U.S.-born residents:
- This state: 840
- Other state: 288
- Northeast: 110
- Midwest: 33
- South: 142
- West: 0
90.9% of Fort Lawn residents lived in the same house 1 years ago.
Out of people who lived in different houses, 1.8% lived in this county.
Out of people who lived in different counties, 92.5% lived in South Carolina.
| Fort Lawn: | 90.9% |
| State average: | 86.5% |
Education attainment for males 25 years and older:
- No schooling: 8
- Nursery to 4th grade: 0
- 5th and 6th grade: 3
- 7th and 8th grade: 0
- 9th grade: 6
- 10th grade: 0
- 11th grade: 10
- 12th grade, no diploma: 26
- High school graduate (or equivalency): 108
- Less than 1 year of college: 28
- Some college more than 1 year, no degree: 29
- Associate degree: 12
- Bachelor's degree: 22
- Master's degree: 10
- Professional school degree: 9
- Doctorate degree: 21

Education attainment for females 25 years and older:
- No schooling: 5
- Nursery to 4th grade: 0
- 5th and 6th grade: 0
- 7th and 8th grade: 4
- 9th grade: 15
- 10th grade: 11
- 11th grade: 15
- 12th grade, no diploma: 5
- High school graduate (or equivalency): 105
- Less than 1 year of college: 10
- Some college more than 1 year, no degree: 93
- Associate degree: 61
- Bachelor's degree: 25
- Master's degree: 34
- Professional school degree: 1
- Doctorate degree: 3


Housing units in structures:
- One, detached: 212
- One, attached: 3
- Two: 8
- 10 to 19: 1
- Mobile homes: 201
- Boats, RVs, vans, etc.: 1
Housing units lacking complete kitchen facilities in 2022: 1.2%
House/condo owner moved in on average 15 years ago
Renter moved in on average 4 years ago

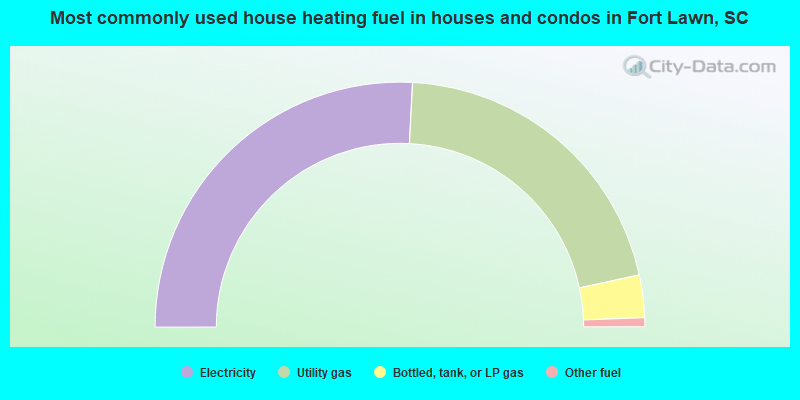
- 51.6%Electricity
- 41.5%Utility gas
- 5.6%Bottled, tank, or LP gas
- 1.2%Other fuel
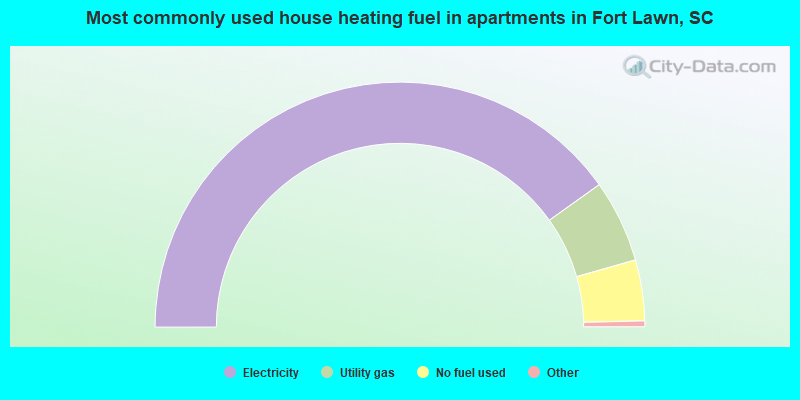
- 80.9%Electricity
- 11.0%Utility gas
- 8.1%No fuel used
Private vs. public school enrollment:
| Here: | 0.0% |
| South Carolina: | 14.4% |
| Here: | 0.0% |
| South Carolina: | 11.1% |
| Here: | 5.6% |
| South Carolina: | 21.9% |


