Fort Motte-Lone Star, SC (South Carolina) Houses and Residents
| Fort Motte-Lone Star: | $179,841 |
| South Carolina: | $254,600 |
Total population: 1,034 (Urban population: 0, Rural population: 1,066 (94 farm, 972 nonfarm))
Houses: 534 (437 occupied: 364 owner occupied, 73 renter occupied)
| % of renters here: | 17% |
| State: | 28% |
Housing density: 7 houses/condos per square mile
Median price asked for vacant for-sale houses and condos in 2022 in this county: $166,881.
Median contract rent in 2022: $398 (lower quartile is $352, upper quartile is $598)
Median rent asked for vacant for-rent units in 2022: $390
Median gross rent in Fort Motte-Lone Star, SC in 2022: $881
Housing units in Fort Motte-Lone Star with a mortgage: 54 (4 second mortgage, 11 home equity loan, 0 both second mortgage and home equity loan)
Houses without a mortgage: 96
Compare current foreclosures near Fort Motte-Lone Star, SC:


Household type by relationship:
Households: 15,022- In family households: 12,840 (2,719 male householders, 1,485 female householders)
2,955 spouses, 4,159 children (3,825 natural, 109 adopted, 225 stepchildren), 663 grandchildren, 181 brothers or sisters, 124 parents, foster children, 240 other relatives, 258 non-relatives
- In nonfamily households: 2,182 (969 male householders (834 living alone)), 907 female householders (796 living alone)), 306 nonrelatives
- In group quarters: 153 (106 institutionalized population)
2,152 married couples with children.
1,012 single-parent households (213 men, 799 women).
97.6% of residents of Fort Motte-Lone Star speak English at home.
2.3% of residents speak Spanish at home (78% speak English very well, 22% speak English well).
0.1% of residents speak other Indo-European language at home (100% speak English very well).
Foreign born population: 23 (2.0%)
(34.8% of them are naturalized citizens)
| Here: | 7.4 |
| State: | 6.4 |
| Here: | 6.1 |
| State: | 4.5 |

- Bedrooms in owner-occupied houses and condos in Fort Motte-Lone Star, South Carolina
- 0no bedroom
- 111 bedroom
- 572 bedrooms
- 2243 bedrooms
- 644 bedrooms
- 85+ bedrooms

- Bedrooms in renter-occupied apartments in Fort Motte-Lone Star, South Carolina
- 0no bedroom
- 21 bedroom
- 322 bedrooms
- 303 bedrooms
- 74 bedrooms
- 25+ bedrooms

- Cars and other vehicles available in Fort Motte-Lone Star in owner-occupied houses/condos
- 15no vehicle
- 1041 vehicle
- 1152 vehicles
- 853 vehicles
- 304 vehicles
- 155+ vehicles

- Cars and other vehicles available in Fort Motte-Lone Star in renter-occupied apartments
- 19no vehicle
- 271 vehicle
- 202 vehicles
- 53 vehicles
- 24 vehicles
- 05+ vehicles

- Rooms in owner-occupied houses in Fort Motte-Lone Star, South Carolina
- 01 room
- 42 rooms
- 103 rooms
- 314 rooms
- 865 rooms
- 896 rooms
- 717 rooms
- 388 rooms
- 359+ rooms

- Rooms in renter-occupied apartments in Fort Motte-Lone Star, South Carolina
- 01 room
- 22 rooms
- 103 rooms
- 124 rooms
- 215 rooms
- 176 rooms
- 27 rooms
- 58 rooms
- 49+ rooms


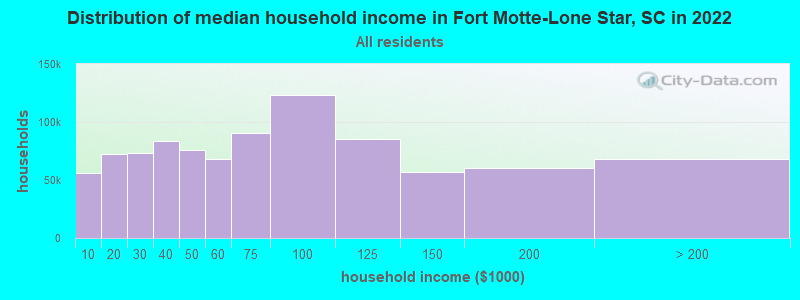
Fort Motte-Lone Star, SC household income distribution

- 38,968Less than $10,000
- 59,610$10,000 to $19,999
- 52,145$20,000 to $29,999
- 57,900$30,000 to $39,999
- 53,444$40,000 to $49,999
- 41,742$50,000 to $59,999
- 55,660$60,000 to $74,999
- 73,773$75,000 to $99,999
- 52,057$100,000 to $124,999
- 32,612$125,000 to $149,999
- 32,441$150,000 to $199,999
- 31,984$200,000 or more
Percentage of workers working in this county: 32.6%
Number of people working at home: 35 (7.4% of all workers)
Travel time to work (commute)
- Less than 5 minutes: 28
- 5 to 9 minutes: 17
- 10 to 14 minutes: 29
- 15 to 19 minutes: 59
- 20 to 24 minutes: 30
- 25 to 29 minutes: 23
- 30 to 34 minutes: 112
- 35 to 39 minutes: 17
- 40 to 44 minutes: 11
- 45 to 59 minutes: 78
- 60 to 89 minutes: 32
- 90 or more minutes: 19
Means of transportation to work:
- Drove a car alone: 375 (80.8%)
- Carpooled: 63 (13.6%)
- Bus or trolley bus: 1 (0.2%)
- Subway or elevated: 3 (0.6%)
- Walked: 5 (1.1%)
- Other means: 8 (1.7%)
- Worked at home: 9 (1.9%)


- Year of entry for the foreign-born population in Fort Motte-Lone Star, South Carolina
- 01995 to March 2000
- 01990 to 1994
- 01985 to 1989
- 81980 to 1984
- 01975 to 1979
- 01970 to 1974
- 01965 to 1969
- 3Before 1965
Most common places of birth for foreign-born residents (%):
| Fort Motte-Lone Star: | 72.7% (8) |
| South Carolina: | 0.7% (823) |
| Fort Motte-Lone Star: | 27.3% (3) |
| South Carolina: | 1.8% (2,125) |
Place of birth for U.S.-born residents:
- This state: 862
- Other state: 189
- Northeast: 44
- Midwest: 26
- South: 109
- West: 10
72% of Fort Motte-Lone Star residents lived in the same house 5 years ago.
Out of people who lived in different houses, 26% lived in this county.
Out of people who lived in different counties, 67% lived in South Carolina.
Education attainment for males 25 years and older:
- No schooling: 2
- Nursery to 4th grade: 7
- 5th and 6th grade: 11
- 7th and 8th grade: 25
- 9th grade: 7
- 10th grade: 2
- 11th grade: 9
- 12th grade, no diploma: 22
- High school graduate (or equivalency): 131
- Less than 1 year of college: 25
- Some college more than 1 year, no degree: 25
- Associate degree: 16
- Bachelor's degree: 45
- Master's degree: 5
- Professional school degree: 14
- Doctorate degree: 5

Education attainment for females 25 years and older:
- No schooling: 13
- Nursery to 4th grade: 11
- 5th and 6th grade: 10
- 7th and 8th grade: 13
- 9th grade: 5
- 10th grade: 13
- 11th grade: 20
- 12th grade, no diploma: 13
- High school graduate (or equivalency): 109
- Less than 1 year of college: 43
- Some college more than 1 year, no degree: 46
- Associate degree: 32
- Bachelor's degree: 60
- Master's degree: 18
- Professional school degree: 0
- Doctorate degree: 5


Housing units in structures:
- One, detached: 312
- One, attached: 7
- Mobile homes: 215
Median worth of mobile homes: $66,264
Housing units lacking complete kitchen facilities: 3.2%

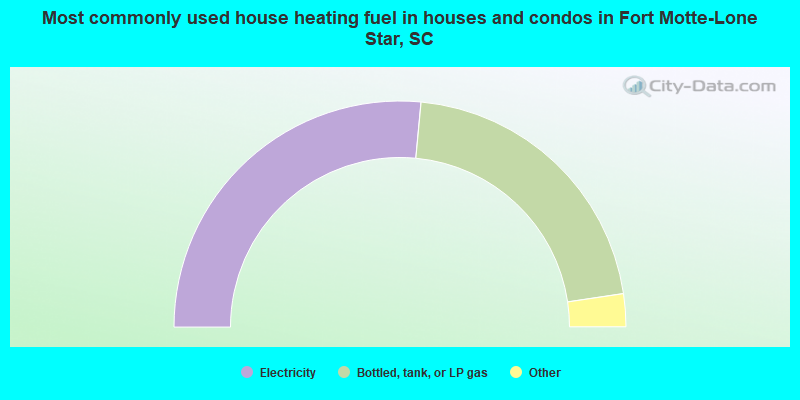
- 53.0%Electricity
- 42.3%Bottled, tank, or LP gas
- 2.2%Wood
- 1.9%Utility gas
- 0.5%Fuel oil, kerosene, etc.
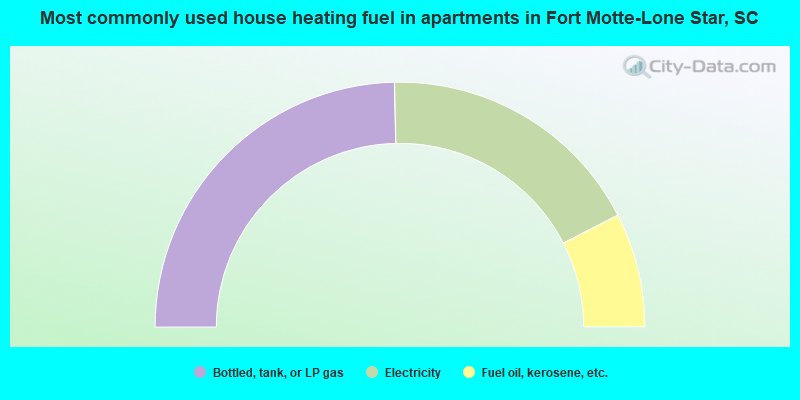
- 49.3%Bottled, tank, or LP gas
- 35.6%Electricity
- 15.1%Fuel oil, kerosene, etc.
Private vs. public school enrollment:
| Here: | 12.6% |
| South Carolina: | 9.2% |
| Here: | 19.6% |
| South Carolina: | 8.1% |
| Here: | 22.9% |
| South Carolina: | 20.3% |


