Fort Stewart, GA (Georgia) Houses and Residents
| Fort Stewart: | |
| Georgia: |
Total population: 4,924 (All urban)
Houses: 2,940 (2,450 occupied: 4 owner occupied, 2,474 renter occupied)
| % of renters here: | 100% |
| State: | 34% |
Housing density: 445 houses/condos per square mile
Median price asked for vacant for-sale houses and condos in 2022 in this county: $176,786.
Median contract rent in 2022: $1,508 (lower quartile is $1,274, upper quartile is $1,828)
Median rent asked for vacant for-rent units in 2022: $1,667
Median gross rent in Fort Stewart, GA in 2022: $1,493
Housing units in Fort Stewart with a mortgage: 0 (0 second mortgage, 0 home equity loan, 0 both second mortgage and home equity loan)
Houses without a mortgage: 0
Compare current foreclosures near Fort Stewart, GA:
| Photo | Address | Area | Beds / Baths | Price | Details |
|---|---|---|---|---|---|

|
#1
Subic Cir Apt D
Fort Stewart, GA 31315
|
- sq. feet
|
- baths - beds |
show details | |

|
#2
Gwinett St Apt C
Fort Stewart, GA 31315
|
- sq. feet
|
- baths - beds |
show details | |

|
#3
Laurel Oak Ave
Fort Stewart, GA 31315
|
- sq. feet
|
- baths - beds |
show details | |

|
#4
Scarlet Oak Dr
Fort Stewart, GA 31315
|
- sq. feet
|
- baths - beds |
show details | |

|
#5
San Isidro Rd Apt A
Fort Stewart, GA 31315
|
- sq. feet
|
- baths - beds |
show details | |

|
#6
Courage Loop
Fort Stewart, GA 31315
|
- sq. feet
|
- baths - beds |
show details | |

|
#7
Lacey Oak Dr
Fort Stewart, GA 31315
|
- sq. feet
|
- baths - beds |
show details | |

|
#8
Breakneck Cir Apt G
Fort Stewart, GA 31315
|
- sq. feet
|
- baths - beds |
show details | |

|
#9
Courage Loop
Fort Stewart, GA 31315
|
- sq. feet
|
- baths - beds |
show details | |

|
#10
Golden Birch Dr
Fort Stewart, GA 31315
|
- sq. feet
|
- baths - beds |
show details |
| Photo | Address | Area | Beds / Baths | Price | Details |
|---|---|---|---|---|---|

|
#11
Saint Tropez St
Fort Stewart, GA 31315
|
- sq. feet
|
- baths - beds |
show details | |

|
#12
Golden Birch Dr
Fort Stewart, GA 31315
|
- sq. feet
|
- baths - beds |
show details | |

|
#13
Lacey Oak Dr
Fort Stewart, GA 31315
|
- sq. feet
|
- baths - beds |
show details | |

|
#14
Smiley Hall Rd
Riceboro, GA 31323
|
1,045 sq. feet
|
2 baths 3 beds |
show details | |

|
#15
Brightleaf Cir
Hinesville, GA 31313
|
2,423 sq. feet
|
3 baths 5 beds |
show details | |

|
#16
Cove St
Hinesville, GA 31313
|
1,264 sq. feet
|
2 baths 3 beds |
show details | |

|
#17
Cove St
Hinesville, GA 31313
|
1,390 sq. feet
|
2 baths 3 beds |
show details | |

|
#18
Waterlily Court
Hinesville, GA 31313
|
- sq. feet
|
2 baths 3 beds |
show details | |

|
#19
Heathrow Dr
Hinesville, GA 31313
|
1,746 sq. feet
|
2 baths 10 beds |
show details | |

|
#20
Lee Place Rd NE
Ludowici, GA 31316
|
1,216 sq. feet
|
2 baths 3 beds |
show details |
| Photo | Address | Area | Beds / Baths | Price | Details |
|---|---|---|---|---|---|

|
#21
Whippoorwill Way
Hinesville, GA 31313
|
1,356 sq. feet
|
2 baths 3 beds |
show details | |

|
#22
Singleton Rd
Richmond Hill, GA 31324
|
880 sq. feet
|
1 baths 3 beds |
show details | |

|
#23
Jubail Dr
Hinesville, GA 31313
|
1,557 sq. feet
|
2 baths 3 beds |
show details | |

|
#24
Zorn Rd
Hinesville, GA 31313
|
1,476 sq. feet
|
2 baths 3 beds |
show details | |

|
#25
Tower Dr
Hinesville, GA 31313
|
1,170 sq. feet
|
2 baths 3 beds |
show details | |

|
#26
Tower Dr
Hinesville, GA 31313
|
1,270 sq. feet
|
2 baths 3 beds |
show details | |

|
#27
Peregrine Cir
Richmond Hill, GA 31324
|
1,331 sq. feet
|
2 baths 3 beds |
show details | |

|
#28
Cove St
Hinesville, GA 31313
|
1,400 sq. feet
|
2 baths 3 beds |
show details | |

|
#29
Peregrine Cir
Richmond Hill, GA 31324
|
1,898 sq. feet
|
3 baths 3 beds |
show details | |

|
#30
Ashton Dr
Hinesville, GA 31313
|
2,074 sq. feet
|
2 baths 3 beds |
show details |
| Photo | Address | Area | Beds / Baths | Price | Details |
|---|---|---|---|---|---|

|
#31
Pioneer Rd
Hinesville, GA 31313
|
1,186 sq. feet
|
1 baths 3 beds |
show details | |

|
#32
S Maple Dr
Hinesville, GA 31313
|
1,806 sq. feet
|
2 baths 3 beds |
show details | |

|
#33
Parkland Blvd
Hinesville, GA 31313
|
1,281 sq. feet
|
2 baths 3 beds |
show details | |

|
#34
Coalition Cir
Hinesville, GA 31313
|
1,064 sq. feet
|
2 baths 3 beds |
show details | |

|
#35
Flo Zechman Dr
Hinesville, GA 31313
|
1,161 sq. feet
|
2 baths 3 beds |
show details | |

|
#36
Egret Cir
Richmond Hill, GA 31324
|
1,215 sq. feet
|
2 baths 3 beds |
show details | |

|
#37
Cumberland Dr
Hinesville, GA 31313
|
1,985 sq. feet
|
3 baths 3 beds |
show details | |

|
#38
Ricade Dr
Hinesville, GA 31313
|
1,414 sq. feet
|
2 baths 3 beds |
show details | |

|
#39
Whitetail Cir
Hinesville, GA 31313
|
1,570 sq. feet
|
2 baths 3 beds |
show details | |

|
#40
Whitetail Cir
Hinesville, GA 31313
|
1,315 sq. feet
|
2 baths 3 beds |
show details |
| Photo | Address | Area | Beds / Baths | Price | Details |
|---|---|---|---|---|---|

|
#41
Whitetail Cir
Hinesville, GA 31313
|
1,175 sq. feet
|
2 baths 3 beds |
show details | |

|
#42
Ogeechee Rd
Hinesville, GA 31313
|
1,288 sq. feet
|
1 baths 3 beds |
show details | |

|
#43
Whitetail Cir
Hinesville, GA 31313
|
1,431 sq. feet
|
2 baths 3 beds |
show details | |

|
#44
Hilltoppers Ct
Hinesville, GA 31313
|
2,477 sq. feet
|
2 baths 3 beds |
show details | |

|
#45
Bridlepath Ct
Hinesville, GA 31313
|
2,384 sq. feet
|
2 baths 3 beds |
show details | |

|
#46
Live Oak Dr
Hinesville, GA 31313
|
1,648 sq. feet
|
2 baths 4 beds |
show details | |

|
#47
Livingston Ct
Hinesville, GA 31313
|
1,780 sq. feet
|
2 baths 3 beds |
show details | |

|
#48
Falcon Dr
Richmond Hill, GA 31324
|
1,446 sq. feet
|
2 baths 3 beds |
show details | |

|
#49
S Topi Trl
Hinesville, GA 31313
|
1,665 sq. feet
|
2 baths 3 beds |
show details | |

|
Check over 1 million property listings on Foreclosure.com!
|
browse all offers | |||


Household type by relationship:
Households: 9,489- Male householders: 1,686 (314 living alone), Female householders: 746 (102 living alone)
1,615 spouses (1,589 opposite-sex spouses), 31 unmarried partners, (31 opposite-sex unmarried partners), 3,741 children (3,455 natural, 47 adopted, 238 stepchildren), 0 grandchildren, 10 brothers or sisters, 18 parents, 0 foster children, 33 other relatives, 44 non-relatives
- In group quarters: 1,562
Size of family households: 508 2-persons, 564 3-persons, 529 4-persons, 242 5-persons, 132 6-persons, 50 7-or-more-persons.
Size of nonfamily households: 418 1-person, 32 2-persons.
2,826 married couples with children.
635 single-parent households (0 men, 635 women).
77.3% of residents of Fort Stewart speak English at home.
17.9% of residents speak Spanish at home (69% speak English very well, 16% speak English well, 12% speak English not well, 3% don't speak English at all).
1.3% of residents speak other Indo-European language at home (74% speak English very well, 21% speak English well, 6% speak English not well).
2.1% of residents speak Asian or Pacific Island language at home (46% speak English very well, 49% speak English well, 4% speak English not well).
0.7% of residents speak other language at home (93% speak English very well, 7% speak English well).
Foreign born population: 807 (8.5%)
(45.2% of them are naturalized citizens)
| Here: | -666666666.0 |
| State: | 6.8 |
| Here: | 5.7 |
| State: | 4.6 |

- Bedrooms in owner-occupied houses and condos in Fort Stewart, Georgia
- 0no bedroom
- 01 bedroom
- 02 bedrooms
- 03 bedrooms
- 44 bedrooms
- 05+ bedrooms

- Bedrooms in renter-occupied apartments in Fort Stewart, Georgia
- 39no bedroom
- 2431 bedroom
- 8102 bedrooms
- 6143 bedrooms
- 7484 bedrooms
- 215+ bedrooms

- Cars and other vehicles available in Fort Stewart in owner-occupied houses/condos
- 0no vehicle
- 41 vehicle
- 02 vehicles
- 03 vehicles
- 04 vehicles
- 05+ vehicles

- Cars and other vehicles available in Fort Stewart in renter-occupied apartments
- 50no vehicle
- 9471 vehicle
- 1,3292 vehicles
- 1193 vehicles
- 294 vehicles
- 05+ vehicles

- Rooms in owner-occupied houses in Fort Stewart, Georgia
- 01 room
- 02 rooms
- 03 rooms
- 04 rooms
- 05 rooms
- 06 rooms
- 07 rooms
- 08 rooms
- 49+ rooms

- Rooms in renter-occupied apartments in Fort Stewart, Georgia
- 391 room
- 1042 rooms
- 2393 rooms
- 2994 rooms
- 4865 rooms
- 4566 rooms
- 5057 rooms
- 2508 rooms
- 969+ rooms

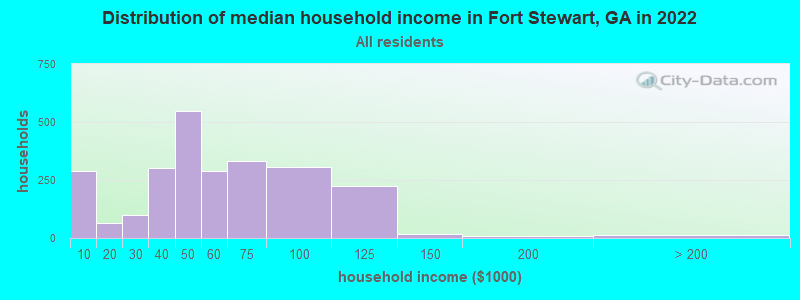
Fort Stewart, GA household income distribution

- 289Less than $10,000
- 65$10,000 to $19,999
- 100$20,000 to $29,999
- 302$30,000 to $39,999
- 548$40,000 to $49,999
- 287$50,000 to $59,999
- 331$60,000 to $74,999
- 306$75,000 to $99,999
- 226$100,000 to $124,999
- 17$125,000 to $149,999
- 8$150,000 to $199,999
- 11$200,000 or more
Rent paid by renters in 2022 in Fort Stewart, GA
-
- 9$200 to $249
- 17$450 to $499
- 33$500 to $549
- 20$600 to $649
- 24$750 to $799
- 47$800 to $899
- 69$900 to $999
- 311$1,000 to $1,249
- 845$1,250 to $1,499
- 1,118$1,500 to $1,999
- 49$2,000 to $2,499
- 50No cash rent


Percentage of workers working in this county: 98.0%
Number of people working at home: 210 (4.6% of all workers)
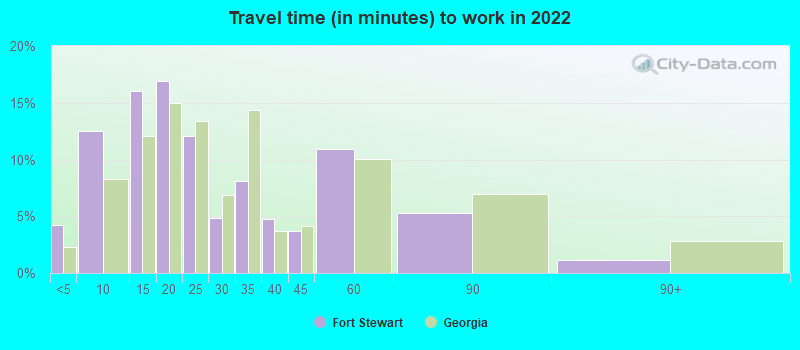
Travel time to work (commute)
- Less than 5 minutes: 438
- 5 to 9 minutes: 1,437
- 10 to 14 minutes: 1,142
- 15 to 19 minutes: 703
- 20 to 24 minutes: 133
- 25 to 29 minutes: 57
- 30 to 34 minutes: 114
- 35 to 39 minutes: 71
- 40 to 44 minutes: 38
- 45 to 59 minutes: 147
- 60 to 89 minutes: 48
- 90 or more minutes: 0
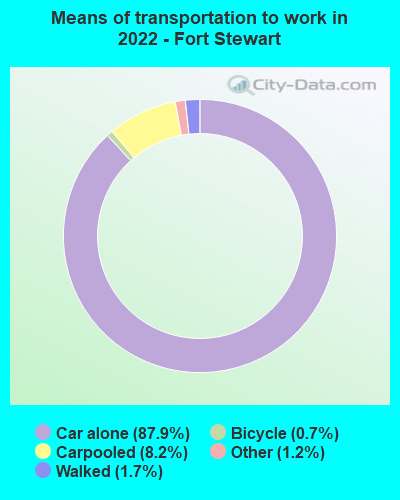
Means of transportation to work:
- Drove a car alone: 12,786 (82.8%)
- Carpooled: 1,252 (8.1%)
- Bus: 3 (0.0%)
- Long-distance train or commuter rail: 7 (0.0%)
- Taxi: 188 (1.2%)
- Bicycle: 107 (0.7%)
- Walked: 264 (1.7%)
- Worked at home: 210 (1.4%)

- Unemployment by race in 2022
- Unemployment rate for White non-Hispanic residents
- 14.6%Males
- 17.4%Females
- Unemployment rate for Black residents
- 8.8%Males
- 12.6%Females
- Unemployment rate for Asian residents
- 10.9%Females
- Unemployment rate for other race residents
- 6.1%Females
- Unemployment rate for two or more race residents
- 10.2%Males
- 6.3%Females
- Unemployment rate for Hispanic or Latino residents
- 6.5%Males
- 8.5%Females

- Year of entry for the foreign-born population in Fort Stewart, Georgia
- 4432010 or later
- 2802000 to 2009
- 1231990 to 1999
- 2901980 to 1989
- 1071970 to 1979
- 19Before 1970

First ancestries reported:
- American: 448 (10.0%)
- German: 363 (8.1%)
- Irish: 136 (3.0%)
- English: 99 (2.2%)
- French: 76 (1.7%)
- Haitian: 64 (1.4%)
- Italian: 63 (1.4%)
- African: 59 (1.3%)
- European: 57 (1.3%)
- Scotch-Irish: 41 (0.9%)
- Jamaican: 33 (0.7%)
- British: 27 (0.6%)
- Scottish: 21 (0.5%)
- Eastern European: 19 (0.4%)
- West Indian: 18 (0.4%)
- Northern European: 9 (0.2%)
- Russian: 5 (0.1%)
- Sudanese: 5 (0.1%)
- Swedish: 5 (0.1%)
Most common places of birth for foreign-born residents (%):
| Fort Stewart: | 27.0% (218) |
| Georgia: | 1.1% (11,847) |
| Fort Stewart: | 19.5% (157) |
| Georgia: | 20.0% (223,400) |
| Fort Stewart: | 12.3% (99) |
| Georgia: | 1.8% (20,700) |
| Fort Stewart: | 11.4% (92) |
| Georgia: | 3.6% (39,974) |
| Fort Stewart: | 5.8% (47) |
| Georgia: | 0.6% (6,963) |
| Fort Stewart: | 4.0% (32) |
| Georgia: | 1.7% (18,651) |
| Fort Stewart: | 3.5% (28) |
| Georgia: | 1.2% (12,946) |
| Fort Stewart: | 2.7% (22) |
| Georgia: | 3.5% (39,227) |
| Fort Stewart: | 2.7% (22) |
| Georgia: | 4.6% (51,270) |
| Fort Stewart: | 2.5% (20) |
| Georgia: | 0.3% (3,839) |
Place of birth for U.S.-born residents:
- This state: 1,964
- Other state: 6,491
- Northeast: 721
- Midwest: 1,123
- South: 3,313
- West: 1,368
63.3% of Fort Stewart residents lived in the same house 1 years ago.
Out of people who lived in different houses, 13.6% lived in this county.
Out of people who lived in different counties, 9.7% lived in Georgia.
| Fort Stewart: | 63.3% |
| State average: | 86.6% |
Education attainment for males 25 years and older:
- No schooling: 15
- Nursery to 4th grade: 0
- 5th and 6th grade: 47
- 7th and 8th grade: 0
- 9th grade: 0
- 10th grade: 0
- 11th grade: 14
- 12th grade, no diploma: 35
- High school graduate (or equivalency): 493
- Less than 1 year of college: 227
- Some college more than 1 year, no degree: 603
- Associate degree: 209
- Bachelor's degree: 137
- Master's degree: 35
- Professional school degree: 6
- Doctorate degree: 0

Education attainment for females 25 years and older:
- No schooling: 9
- Nursery to 4th grade: 5
- 5th and 6th grade: 19
- 7th and 8th grade: 10
- 9th grade: 21
- 10th grade: 37
- 11th grade: 3
- 12th grade, no diploma: 9
- High school graduate (or equivalency): 417
- Less than 1 year of college: 65
- Some college more than 1 year, no degree: 235
- Associate degree: 202
- Bachelor's degree: 371
- Master's degree: 73
- Professional school degree: 0
- Doctorate degree: 0


Housing units in structures:
- One, detached: 214
- One, attached: 575
- Two: 408
- 3 or 4: 1,125
- 5 to 9: 442
- 10 to 19: 74
- 20 to 49: 33
- 50 or more: 15
- Mobile homes: 50
Housing units lacking complete kitchen facilities in 2022: 1.2%

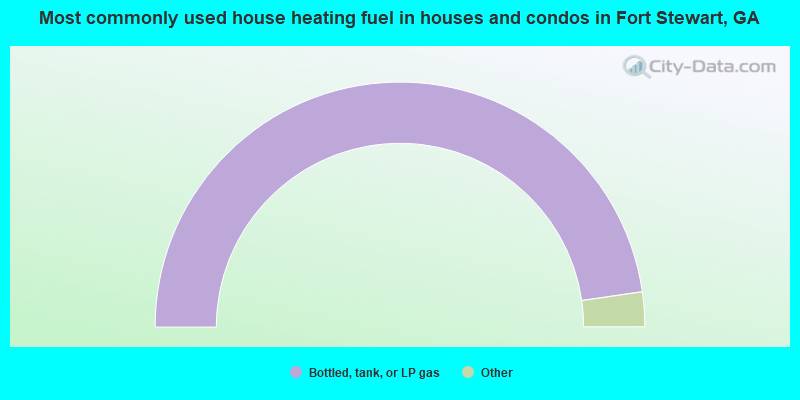
- 100.0%Bottled, tank, or LP gas
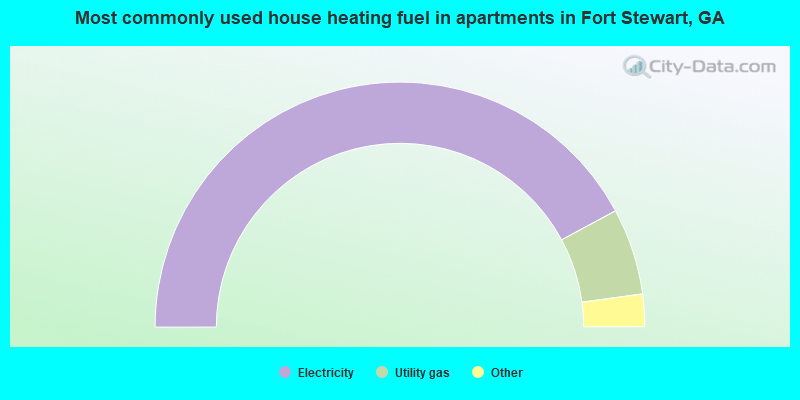
- 84.2%Electricity
- 11.4%Utility gas
- 2.6%Bottled, tank, or LP gas
- 1.4%No fuel used
- 0.3%Solar energy
Private vs. public school enrollment:
| Here: | 12.3% |
| Georgia: | 12.1% |
| Here: | 42.1% |
| Georgia: | 10.8% |
| Here: | 11.7% |
| Georgia: | 17.1% |


