Fort Thomas, KY (Kentucky) Houses and Residents
| Fort Thomas: | $309,189 |
| Kentucky: | $196,300 |
Mean price in 2022:
Detached houses: $360,958
Here: $360,958 State: $256,452 Townhouses or other attached units: $299,750
Here: $299,750 State: $264,090 In 2-unit structures: $329,859
Here: $329,859 State: $211,203 In 3-to-4-unit structures: $358,514
Here: $358,514 State: $169,074 In 5-or-more-unit structures: $177,982
Here: $177,982 State: $245,174 Mobile homes: $233,715
Here: $233,715 State: $84,635
Total population: 16,329 (All urban)
Houses: 6,782 (6,616 occupied: 4,849 owner occupied, 1,856 renter occupied)
| % of renters here: | 28% |
| State: | 31% |
Housing density: 1,196 houses/condos per square mile
Median price asked for vacant for-sale houses and condos in 2022: $208,115.
Median contract rent in 2022: $1,003 (lower quartile is $841, upper quartile is $1,094)
Median rent asked for vacant for-rent units in 2022: $407
Median gross rent in Fort Thomas, KY in 2022: $1,110
Housing units in Fort Thomas with a mortgage: 2,930 (454 second mortgage, 0 home equity loan, 457 both second mortgage and home equity loan)
Houses without a mortgage: 66
Median household income for houses/condos with a mortgage: $134,991
Median household income for apartments without a mortgage: $103,713
Median monthly housing costs: $1,245
Compare current foreclosures near Fort Thomas, KY:
| Photo | Address | Area | Beds / Baths | Price | Details |
|---|---|---|---|---|---|

|
#1
Marian Dr
Fort Thomas, KY 41075
|
1,260 sq. feet
|
1 baths - beds |
show details | |

|
#2
Brentwood Pl
Fort Thomas, KY 41075
|
- sq. feet
|
- baths - beds |
show details | |

|
#3
Memorial Pkwy Apt 1
Fort Thomas, KY 41075
|
- sq. feet
|
- baths - beds |
show details | |

|
#4
Marian Dr
Fort Thomas, KY 41075
|
1,503 sq. feet
|
- baths - beds |
show details | |

|
#5
Sergeant Ave
Fort Thomas, KY 41075
|
1,026 sq. feet
|
- baths - beds |
show details | |

|
#6
Military Pkwy
Fort Thomas, KY 41075
|
- sq. feet
|
- baths - beds |
show details | |

|
#7
S Grand Ave
Fort Thomas, KY 41075
|
832 sq. feet
|
- baths - beds |
show details | |

|
#8
Burney Ln
Fort Thomas, KY 41075
|
- sq. feet
|
- baths - beds |
show details | |

|
#9
Delta Ave
Fort Thomas, KY 41075
|
1,404 sq. feet
|
- baths - beds |
show details | |

|
#10
Klainecrest Ave
Fort Thomas, KY 41075
|
1,546 sq. feet
|
- baths - beds |
show details |
| Photo | Address | Area | Beds / Baths | Price | Details |
|---|---|---|---|---|---|

|
#11
Sunset Ave
Fort Thomas, KY 41075
|
1,614 sq. feet
|
- baths - beds |
show details | |

|
#12
S Grand Ave Apt 1
Fort Thomas, KY 41075
|
- sq. feet
|
- baths - beds |
show details | |

|
#13
Burney Ln
Fort Thomas, KY 41075
|
1,423 sq. feet
|
- baths - beds |
show details | |

|
#14
Southview Ave
Fort Thomas, KY 41075
|
1,180 sq. feet
|
- baths - beds |
show details | |

|
#15
Park Pl Apt 1
Fort Thomas, KY 41075
|
- sq. feet
|
- baths - beds |
show details | |

|
#16
Highland Ave Apt 3
Fort Thomas, KY 41075
|
- sq. feet
|
- baths - beds |
show details | |

|
#17
Water St
Fort Thomas, KY 41075
|
- sq. feet
|
- baths - beds |
show details | |

|
#18
Alexandria Pike Apt 111
Fort Thomas, KY 41075
|
- sq. feet
|
- baths - beds |
show details | |

|
#19
Werner Ave
Cincinnati, OH 45231
|
1,032 sq. feet
|
1 baths 2 beds |
$124,900
|
show details |

|
#20
Andrew St
Cincinnati, OH 45217
|
1,172 sq. feet
|
1 baths 3 beds |
show details |
| Photo | Address | Area | Beds / Baths | Price | Details |
|---|---|---|---|---|---|

|
#21
Delhi Ave
Cincinnati, OH 45204
|
950 sq. feet
|
1 baths 3 beds |
show details | |

|
#22
Garvey Ave
Erlanger, KY 41018
|
848 sq. feet
|
1 baths 3 beds |
show details | |

|
#23
Regent Rd
Cincinnati, OH 45245
|
1,886 sq. feet
|
3 baths 3 beds |
show details | |

|
#24
Bertus St
Cincinnati, OH 45217
|
1,488 sq. feet
|
2 baths 2 beds |
show details | |

|
#25
Creekhill Dr
Cincinnati, OH 45231
|
1,352 sq. feet
|
3 baths 3 beds |
show details | |

|
#26
Musket Cir
Independence, KY 41051
|
1,147 sq. feet
|
2 baths 3 beds |
show details | |

|
#27
Blossom Dr
Newport, KY 41076
|
1,823 sq. feet
|
2 baths 3 beds |
show details | |

|
#28
Lexington Dr
Erlanger, KY 41018
|
1,063 sq. feet
|
1 baths 3 beds |
show details | |

|
#29
Williams St
Cincinnati, OH 45215
|
1,152 sq. feet
|
1 baths 2 beds |
show details | |

|
#30
Glade Ave
Cincinnati, OH 45230
|
1,138 sq. feet
|
1 baths 3 beds |
show details |
| Photo | Address | Area | Beds / Baths | Price | Details |
|---|---|---|---|---|---|

|
#31
Philloret Dr
Cincinnati, OH 45239
|
1,233 sq. feet
|
1 baths 3 beds |
show details | |

|
#32
Alex Ct
Hebron, KY 41048
|
1,432 sq. feet
|
2 baths 3 beds |
show details | |

|
#33
Linda Dr
Cincinnati, OH 45238
|
1,131 sq. feet
|
2 baths 3 beds |
show details | |

|
#34
Kirkup Ave
Cincinnati, OH 45213
|
2,142 sq. feet
|
2 baths 4 beds |
show details | |

|
#35
Cascade Rd
Cincinnati, OH 45240
|
1,423 sq. feet
|
1 baths 4 beds |
show details | |

|
#36
Orchard Ln
Amelia, OH 45102
|
2,212 sq. feet
|
1 baths 4 beds |
show details | |

|
#37
Ramble Vw Unit 102
Cincinnati, OH 45231
|
1,129 sq. feet
|
2 baths 2 beds |
show details | |

|
#38
Woodlyn Hills Dr
Erlanger, KY 41018
|
1,908 sq. feet
|
3 baths 3 beds |
show details | |

|
#39
Stormy Way
Cincinnati, OH 45230
|
2,448 sq. feet
|
2 baths 4 beds |
show details | |

|
#40
Ann St
Newport, KY 41071
|
939 sq. feet
|
1 baths 2 beds |
show details |
| Photo | Address | Area | Beds / Baths | Price | Details |
|---|---|---|---|---|---|

|
#41
Terrydel Ln
Cincinnati, OH 45245
|
832 sq. feet
|
1 baths 2 beds |
show details | |

|
#42
Inlet Ct
Amelia, OH 45102
|
2,658 sq. feet
|
2 baths 4 beds |
show details | |

|
#43
Knollridge Ln
Cincinnati, OH 45231
|
1,307 sq. feet
|
2 baths 3 beds |
show details | |

|
#44
Race Rd
Cincinnati, OH 45211
|
1,523 sq. feet
|
2 baths 3 beds |
show details | |

|
#45
Perry St
Cincinnati, OH 45231
|
1,176 sq. feet
|
1 baths 2 beds |
show details | |

|
#46
Dianna Dr
Cincinnati, OH 45239
|
912 sq. feet
|
1 baths 2 beds |
show details | |

|
#47
Brookview Dr
Batavia, OH 45103
|
1,508 sq. feet
|
1 baths 3 beds |
show details | |

|
#48
Ebenezer Rd
Cincinnati, OH 45248
|
1,260 sq. feet
|
1 baths 3 beds |
show details | |

|
#49
Pringle Dr
Cincinnati, OH 45231
|
1,428 sq. feet
|
1 baths 3 beds |
show details | |

|
Check over 1 million property listings on Foreclosure.com!
|
browse all offers | |||


 | Rental properties around 1988??? (0 replies) |
| Independence, KY Opinions, please (7 replies) |
| Place to retire in KY. Henderson? Covington? (12 replies) |
| Not ready to Buy-- Fort Thomas Rentals (2 replies) |
| A possible move to the Florence area (or nearby) (24 replies) |
| Please help us find somewhere to move in Kentucky! (11 replies) |

Median year apartment built: 1972
Household type by relationship:
Households: 17,343- Male householders: 3,448 (779 living alone), Female householders: 3,075 (1,051 living alone)
3,740 spouses (3,721 opposite-sex spouses), 255 unmarried partners, (243 opposite-sex unmarried partners), 5,121 children (4,664 natural, 160 adopted, 296 stepchildren), 719 grandchildren, 67 brothers or sisters, 73 parents, 0 foster children, 186 other relatives, 273 non-relatives
- In group quarters: 381
Size of family households: 1,937 2-persons, 749 3-persons, 1,224 4-persons, 250 5-persons, 111 6-persons, 114 7-or-more-persons.
Size of nonfamily households: 1,981 1-person, 216 2-persons, 32 3-persons.
3,106 married couples with children.
839 single-parent households (357 men, 482 women).
96.0% of residents of Fort Thomas speak English at home.
1.2% of residents speak Spanish at home (96% speak English very well, 1% speak English well, 3% speak English not well).
1.2% of residents speak other Indo-European language at home (100% speak English very well).
1.2% of residents speak Asian or Pacific Island language at home (43% speak English very well, 14% speak English well, 41% speak English not well, 3% don't speak English at all).
0.2% of residents speak other language at home (100% speak English very well).
Foreign born population: 612 (3.5%)
(57.2% of them are naturalized citizens)
| Here: | 7.1 |
| State: | 6.4 |
| Here: | 4.3 |
| State: | 4.4 |

- Bedrooms in owner-occupied houses and condos in Fort Thomas, Kentucky
- 0no bedroom
- 351 bedroom
- 8692 bedrooms
- 2,0613 bedrooms
- 1,4554 bedrooms
- 4295+ bedrooms

- Bedrooms in renter-occupied apartments in Fort Thomas, Kentucky
- 38no bedroom
- 7381 bedroom
- 9662 bedrooms
- 713 bedrooms
- 434 bedrooms
- 05+ bedrooms

- Cars and other vehicles available in Fort Thomas in owner-occupied houses/condos
- 49no vehicle
- 8531 vehicle
- 2,5432 vehicles
- 9393 vehicles
- 1924 vehicles
- 2745+ vehicles

- Cars and other vehicles available in Fort Thomas in renter-occupied apartments
- 178no vehicle
- 1,1381 vehicle
- 4212 vehicles
- 703 vehicles
- 04 vehicles
- 495+ vehicles

- Rooms in owner-occupied houses in Fort Thomas, Kentucky
- 01 room
- 02 rooms
- 183 rooms
- 1524 rooms
- 6755 rooms
- 8726 rooms
- 1,0307 rooms
- 7848 rooms
- 1,3199+ rooms

- Rooms in renter-occupied apartments in Fort Thomas, Kentucky
- 381 room
- 742 rooms
- 4183 rooms
- 5984 rooms
- 5605 rooms
- 436 rooms
- 557 rooms
- 118 rooms
- 599+ rooms


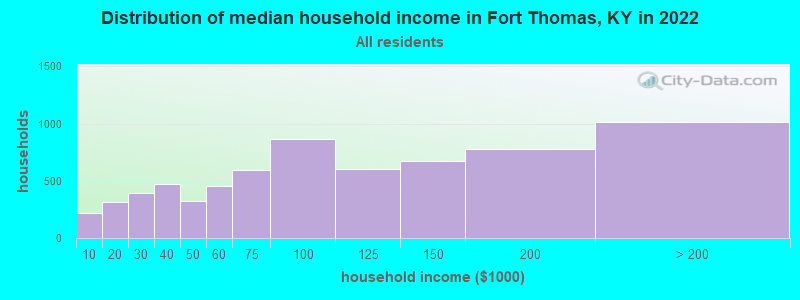
Fort Thomas, KY household income distribution

- 219Less than $10,000
- 314$10,000 to $19,999
- 396$20,000 to $29,999
- 473$30,000 to $39,999
- 320$40,000 to $49,999
- 453$50,000 to $59,999
- 593$60,000 to $74,999
- 868$75,000 to $99,999
- 604$100,000 to $124,999
- 677$125,000 to $149,999
- 776$150,000 to $199,999
- 1,014$200,000 or more
Home value of owner - occupied houses in 2022 in Fort Thomas, KY
-
- 4Less than $10,000
- 16$15,000 to $19,999
- 11$30,000 to $34,999
- 42$35,000 to $39,999
- 10$70,000 to $79,999
- 20$80,000 to $89,999
- 25$90,000 to $99,999
- 177$100,000 to $124,999
- 243$125,000 to $149,999
- 291$150,000 to $174,999
- 425$175,000 to $199,999
- 666$200,000 to $249,999
- 902$250,000 to $299,999
- 998$300,000 to $399,999
- 479$400,000 to $499,999
- 570$500,000 to $749,999
- 203$750,000 to $999,999
- 72$1,000,000 to $1,499,999
- 21$1,500,000 to $1,999,999
- 21$2,000,000 or more

Rent paid by renters in 2022 in Fort Thomas, KY
-
- 25$150 to $199
- 9$350 to $399
- 15$400 to $449
- 41$500 to $549
- 19$550 to $599
- 90$600 to $649
- 61$650 to $699
- 202$700 to $749
- 79$750 to $799
- 286$800 to $899
- 452$900 to $999
- 279$1,000 to $1,249
- 101$1,250 to $1,499
- 52$1,500 to $1,999
- 8$2,500 to $2,999
- 7$3,000 to $3,499
- 9$3,500 or more
- 60No cash rent


Percentage of workers working in this county: 43.9%
Number of people working at home: 1,353 (15.4% of all workers)

Travel time to work (commute)
- Less than 5 minutes: 177
- 5 to 9 minutes: 775
- 10 to 14 minutes: 1,472
- 15 to 19 minutes: 1,574
- 20 to 24 minutes: 978
- 25 to 29 minutes: 715
- 30 to 34 minutes: 901
- 35 to 39 minutes: 213
- 40 to 44 minutes: 115
- 45 to 59 minutes: 79
- 60 to 89 minutes: 124
- 90 or more minutes: 149
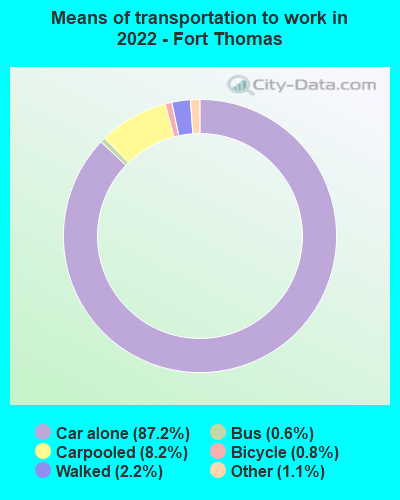
Means of transportation to work:
- Drove a car alone: 3,335 (66.7%)
- Carpooled: 347 (6.9%)
- Bus: 13 (0.3%)
- Taxi: 50 (1.0%)
- Bicycle: 23 (0.5%)
- Walked: 82 (1.6%)
- Worked at home: 1,353 (27.1%)

- Unemployment by race in 2022
- Unemployment rate for White non-Hispanic residents
- 3.5%Males
- 2.9%Females
- Unemployment rate for Black residents
- 43.3%Females

- Year of entry for the foreign-born population in Fort Thomas, Kentucky
- 2012010 or later
- 1172000 to 2009
- 411990 to 1999
- 691980 to 1989
- 111970 to 1979
- 109Before 1970

First ancestries reported:
- German: 2,378 (33.6%)
- English: 819 (11.6%)
- American: 694 (9.8%)
- Italian: 384 (5.4%)
- Irish: 305 (4.3%)
- European: 163 (2.3%)
- British: 78 (1.1%)
- Scotch-Irish: 66 (0.9%)
- Scandinavian: 63 (0.9%)
- French: 53 (0.7%)
- South African: 47 (0.7%)
- Polish: 44 (0.6%)
- Hungarian: 28 (0.4%)
- Dutch: 27 (0.4%)
- Scottish: 22 (0.3%)
- Finnish: 19 (0.3%)
- African: 18 (0.3%)
- Jamaican: 17 (0.2%)
- Lithuanian: 15 (0.2%)
- Greek: 14 (0.2%)
- Lebanese: 12 (0.2%)
- French Canadian: 12 (0.2%)
- Czech: 10 (0.1%)
- Ukrainian: 10 (0.1%)
- Welsh: 10 (0.1%)
- Russian: 8 (0.1%)
- Eastern European: 7 (0.10%)
- Norwegian: 5 (0.07%)
Most common places of birth for foreign-born residents (%):
| Fort Thomas: | 16.6% (77) |
| Kentucky: | 4.2% (7,734) |
| Fort Thomas: | 14.2% (66) |
| Kentucky: | 0.3% (607) |
| Fort Thomas: | 12.9% (60) |
| Kentucky: | 0.4% (723) |
| Fort Thomas: | 11.8% (55) |
| Kentucky: | 1.9% (3,585) |
| Fort Thomas: | 9.7% (45) |
| Kentucky: | 2.3% (4,303) |
| Fort Thomas: | 6.9% (32) |
| Kentucky: | 3.3% (6,109) |
| Fort Thomas: | 4.5% (21) |
| Kentucky: | 7.3% (13,454) |
| Fort Thomas: | 3.4% (16) |
| Kentucky: | 0.8% (1,437) |
| Fort Thomas: | 3.2% (15) |
| Kentucky: | 0.3% (644) |
| Fort Thomas: | 3.0% (14) |
| Kentucky: | 0.2% (442) |
| Fort Thomas: | 2.8% (13) |
| Kentucky: | 0.8% (1,529) |
| Fort Thomas: | 2.8% (13) |
| Kentucky: | 2.9% (5,302) |
| Fort Thomas: | 2.8% (13) |
| Kentucky: | 3.7% (6,894) |
| Fort Thomas: | 2.6% (12) |
| Kentucky: | 0.2% (434) |
| Fort Thomas: | 1.9% (9) |
| Kentucky: | 0.1% (202) |
| Fort Thomas: | 1.7% (8) |
| Kentucky: | 0.9% (1,604) |
Place of birth for U.S.-born residents:
- This state: 8,105
- Other state: 8,608
- Northeast: 657
- Midwest: 6,542
- South: 1,008
- West: 342
87.6% of Fort Thomas residents lived in the same house 1 years ago.
Out of people who lived in different houses, 37.7% lived in this county.
Out of people who lived in different counties, 55.3% lived in Kentucky.
| Fort Thomas: | 87.6% |
| State average: | 87.2% |
Education attainment for males 25 years and older:
- No schooling: 21
- Nursery to 4th grade: 0
- 5th and 6th grade: 23
- 7th and 8th grade: 0
- 9th grade: 40
- 10th grade: 11
- 11th grade: 1
- 12th grade, no diploma: 4
- High school graduate (or equivalency): 962
- Less than 1 year of college: 261
- Some college more than 1 year, no degree: 732
- Associate degree: 608
- Bachelor's degree: 2,002
- Master's degree: 788
- Professional school degree: 388
- Doctorate degree: 172

Education attainment for females 25 years and older:
- No schooling: 18
- Nursery to 4th grade: 0
- 5th and 6th grade: 3
- 7th and 8th grade: 33
- 9th grade: 18
- 10th grade: 13
- 11th grade: 42
- 12th grade, no diploma: 83
- High school graduate (or equivalency): 1,046
- Less than 1 year of college: 285
- Some college more than 1 year, no degree: 855
- Associate degree: 391
- Bachelor's degree: 1,793
- Master's degree: 1,055
- Professional school degree: 78
- Doctorate degree: 229


Housing units in structures:
- One, detached: 4,712
- One, attached: 210
- Two: 283
- 3 or 4: 307
- 5 to 9: 477
- 10 to 19: 611
- 20 to 49: 88
- 50 or more: 88
- Mobile homes: 3
Housing units lacking complete kitchen facilities in 2022: 0.7%
House/condo owner moved in on average 14 years ago
Renter moved in on average 0 years ago


- 78.8%Utility gas
- 19.6%Electricity
- 1.1%Bottled, tank, or LP gas
- 0.4%Other fuel

- 57.9%Electricity
- 39.7%Utility gas
- 1.6%No fuel used
- 0.6%Bottled, tank, or LP gas
- 0.3%Other fuel
Private vs. public school enrollment:
| Here: | 18.6% |
| Kentucky: | 17.2% |
| Here: | 6.3% |
| Kentucky: | 15.2% |
| Here: | 14.2% |
| Kentucky: | 19.6% |


