Fowlerville, MI (Michigan) Houses and Residents
| Fowlerville: | $187,265 |
| Michigan: | $224,400 |
Total population: 2,960 (All urban)
Houses: 1,388 (1,297 occupied: 864 owner occupied, 440 renter occupied)
| % of renters here: | 34% |
| State: | 27% |
Housing density: 600 houses/condos per square mile
Median price asked for vacant for-sale houses and condos in 2022: $302,710.
Median contract rent in 2022: $810 (lower quartile is $623, upper quartile is $898)
Median rent asked for vacant for-rent units in 2022: $780
Median gross rent in Fowlerville, MI in 2022: $886
Housing units in Fowlerville with a mortgage: 454 (40 second mortgage, 0 home equity loan, 31 both second mortgage and home equity loan)
Houses without a mortgage: 0
Median household income for houses/condos with a mortgage: $80,124
Median household income for apartments without a mortgage: $42,639
Median monthly housing costs: $921
Compare current foreclosures near Fowlerville, MI:
| Photo | Address | Area | Beds / Baths | Price | Details |
|---|---|---|---|---|---|

|
#1
Swartz River Dr
Fowlerville, MI 48836
|
1,380 sq. feet
|
2 baths 3 beds |
show details | |

|
#2
Vogt Rd
Fowlerville, MI 48836
|
4,788 sq. feet
|
3 baths 4 beds |
show details | |

|
#3
E Grand River Ave
Fowlerville, MI 48836
|
1,588 sq. feet
|
1 baths 3 beds |
show details | |

|
#4
Fowlerville Rd
Fowlerville, MI 48836
|
1,392 sq. feet
|
1 baths 3 beds |
show details | |

|
#5
Robb Rd
Fowlerville, MI 48836
|
1,820 sq. feet
|
2 baths 2 beds |
show details | |

|
#6
Eagle Ridge Ln
Fowlerville, MI 48836
|
995 sq. feet
|
2 baths 3 beds |
show details | |

|
#7
Marsh Rd
Fowlerville, MI 48836
|
2,016 sq. feet
|
2 baths 3 beds |
show details | |

|
#8
Sycamore River Dr
Fowlerville, MI 48836
|
1,000 sq. feet
|
2 baths 3 beds |
show details | |

|
#9
E Grand River Ave
Fowlerville, MI 48836
|
1,648 sq. feet
|
1 baths 3 beds |
show details | |

|
#10
N Hibbard St
Fowlerville, MI 48836
|
1,023 sq. feet
|
1 baths 3 beds |
show details |
| Photo | Address | Area | Beds / Baths | Price | Details |
|---|---|---|---|---|---|

|
#11
Pierson Rd
Fowlerville, MI 48836
|
2,001 sq. feet
|
2 baths - beds |
show details | |

|
#12
Church St
Fowlerville, MI 48836
|
884 sq. feet
|
1 baths - beds |
show details | |

|
#13
Mackinaw Trl
Fowlerville, MI 48836
|
2,002 sq. feet
|
2 baths - beds |
show details | |

|
#14
Huron Ct
Fowlerville, MI 48836
|
1,850 sq. feet
|
2 baths - beds |
show details | |

|
#15
W Grand River Rd
Fowlerville, MI 48836
|
1,291 sq. feet
|
1 baths - beds |
show details | |

|
#16
Eva Ln
Fowlerville, MI 48836
|
- sq. feet
|
- baths - beds |
show details | |

|
#17
S Grand Ave # 4
Fowlerville, MI 48836
|
- sq. feet
|
- baths - beds |
show details | |

|
#18
N Cedar Rd
Fowlerville, MI 48836
|
- sq. feet
|
- baths - beds |
show details | |

|
#19
Red Pine St
Fowlerville, MI 48836
|
- sq. feet
|
- baths - beds |
show details | |

|
#20
Adelines Way
Fowlerville, MI 48836
|
- sq. feet
|
- baths - beds |
show details |
| Photo | Address | Area | Beds / Baths | Price | Details |
|---|---|---|---|---|---|

|
#21
W Fork River Dr
Fowlerville, MI 48836
|
- sq. feet
|
- baths - beds |
show details | |

|
#22
Sycamore River Dr
Fowlerville, MI 48836
|
- sq. feet
|
- baths - beds |
show details | |

|
#23
Jordan River Dr
Fowlerville, MI 48836
|
- sq. feet
|
- baths - beds |
show details | |

|
#24
Brogan Rd
Stockbridge, MI 49285
|
2,098 sq. feet
|
2 baths 3 beds |
$409,900
|
show details |

|
#25
Dutcher Rd
Howell, MI 48843
|
2,008 sq. feet
|
2 baths 3 beds |
$459,900
|
show details |

|
#26
W Lovejoy Rd
Fowlerville, MI 48836
|
- sq. feet
|
- baths - beds |
show details | |

|
#27
Skyline Dr
Howell, MI 48843
|
1,585 sq. feet
|
2 baths 3 beds |
show details | |

|
#28
Green Rd
Haslett, MI 48840
|
972 sq. feet
|
1 baths 2 beds |
show details | |

|
#29
W View Trl
Howell, MI 48843
|
2,798 sq. feet
|
3 baths 4 beds |
show details | |

|
#30
Geneva Ct
Howell, MI 48855
|
1,636 sq. feet
|
2 baths 3 beds |
show details |
| Photo | Address | Area | Beds / Baths | Price | Details |
|---|---|---|---|---|---|

|
#31
Noble Rd
Williamston, MI 48895
|
1,004 sq. feet
|
1 baths 3 beds |
show details | |

|
#32
Schrepfer Rd
Howell, MI 48855
|
1,800 sq. feet
|
2 baths 3 beds |
show details | |

|
#33
Red Hickory Ct # 24
Howell, MI 48855
|
1,408 sq. feet
|
1 baths 2 beds |
show details | |

|
#34
Mill St
Hartland, MI 48353
|
1,136 sq. feet
|
1 baths 3 beds |
show details | |

|
#35
Thistlewood Dr # 75
Howell, MI 48843
|
1,250 sq. feet
|
2 baths 3 beds |
show details | |

|
#36
Haslett Rd
Williamston, MI 48895
|
1,724 sq. feet
|
2 baths 3 beds |
show details | |

|
#37
Peninsular Dr
Fenton, MI 48430
|
1,051 sq. feet
|
2 baths 3 beds |
show details | |

|
#38
Doyle Rd
Gregory, MI 48137
|
2,357 sq. feet
|
2 baths 3 beds |
show details | |

|
#39
Alger St
Howell, MI 48843
|
992 sq. feet
|
1 baths 3 beds |
show details | |

|
#40
S M 52
Perry, MI 48872
|
1,201 sq. feet
|
1 baths 3 beds |
show details |
| Photo | Address | Area | Beds / Baths | Price | Details |
|---|---|---|---|---|---|

|
#41
E Julie Ct
Byron, MI 48418
|
1,303 sq. feet
|
2 baths 3 beds |
show details | |

|
#42
Melton Dr
Howell, MI 48843
|
960 sq. feet
|
1 baths 3 beds |
show details | |

|
#43
Katsura Ln
Howell, MI 48855
|
1,416 sq. feet
|
2 baths 2 beds |
show details | |

|
#44
County Farm Rd
Howell, MI 48843
|
1,936 sq. feet
|
2 baths 3 beds |
show details | |

|
#45
Richards Rd
Howell, MI 48855
|
1,400 sq. feet
|
2 baths 3 beds |
show details | |

|
#46
Pine Eagles Dr
Brighton, MI 48116
|
1,990 sq. feet
|
2 baths 3 beds |
show details | |

|
#47
Clark Lake Rd
Brighton, MI 48114
|
1,572 sq. feet
|
1 baths 2 beds |
show details | |

|
#48
Ironwood Dr
Pinckney, MI 48169
|
2,880 sq. feet
|
3 baths 4 beds |
show details | |

|
#49
Snowden Ln
Howell, MI 48843
|
2,619 sq. feet
|
2 baths 4 beds |
show details | |

|
Check over 1 million property listings on Foreclosure.com!
|
browse all offers | |||

Latest news about housing in Fowlerville, MI collected exclusively by city-data.com from local newspapers, TV, and radio stations

 | Retired & Looking to buy home near Okemos MI. where our son/grand kids live (5 replies) |
| Tips for house hunting when you have different upbringing? (9 replies) |
| The First Thing That Comes To Mind… (4 replies) |
| Safe, Inexpensive, Temporary Housing Near Brighton (11 replies) |
| Why Michigan to Arizona? (130 replies) |
| Colorado to Michigan (75 replies) |

Median year apartment built: 1975
Household type by relationship:
Households: 2,979- Male householders: 514 (189 living alone), Female householders: 771 (318 living alone)
587 spouses (580 opposite-sex spouses), 63 unmarried partners, (63 opposite-sex unmarried partners), 855 children (830 natural, 0 adopted, 24 stepchildren), 53 grandchildren, 8 brothers or sisters, 35 parents, 0 foster children, 72 other relatives, 12 non-relatives
- In group quarters: 5
Size of family households: 421 2-persons, 162 3-persons, 139 4-persons, 11 5-persons, 10 6-persons, 37 7-or-more-persons.
Size of nonfamily households: 465 1-person, 21 2-persons.
437 married couples with children.
98 single-parent households (15 men, 83 women).
98.5% of residents of Fowlerville speak English at home.
1.1% of residents speak Spanish at home (93% speak English very well, 3% speak English well, 3% don't speak English at all).
0.1% of residents speak other language at home (100% speak English very well).
Foreign born population: 3 (0.1%)
(0.0% of them are naturalized citizens)
| Here: | 5.7 |
| State: | 6.5 |
| Here: | 4.0 |
| State: | 4.3 |

- Bedrooms in owner-occupied houses and condos in Fowlerville, Michigan
- 0no bedroom
- 111 bedroom
- 3062 bedrooms
- 4153 bedrooms
- 1244 bedrooms
- 85+ bedrooms

- Bedrooms in renter-occupied apartments in Fowlerville, Michigan
- 0no bedroom
- 1421 bedroom
- 2222 bedrooms
- 693 bedrooms
- 74 bedrooms
- 05+ bedrooms

- Cars and other vehicles available in Fowlerville in owner-occupied houses/condos
- 16no vehicle
- 3991 vehicle
- 2952 vehicles
- 1463 vehicles
- 74 vehicles
- 05+ vehicles

- Cars and other vehicles available in Fowlerville in renter-occupied apartments
- 88no vehicle
- 2261 vehicle
- 1072 vehicles
- 183 vehicles
- 04 vehicles
- 05+ vehicles

- Rooms in owner-occupied houses in Fowlerville, Michigan
- 01 room
- 02 rooms
- 293 rooms
- 2384 rooms
- 1395 rooms
- 1896 rooms
- 1407 rooms
- 798 rooms
- 509+ rooms

- Rooms in renter-occupied apartments in Fowlerville, Michigan
- 01 room
- 182 rooms
- 903 rooms
- 1484 rooms
- 945 rooms
- 526 rooms
- 137 rooms
- 108 rooms
- 139+ rooms


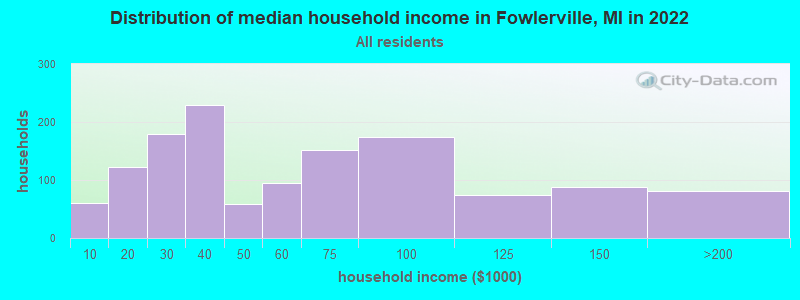
Fowlerville, MI household income distribution

- 61Less than $10,000
- 122$10,000 to $19,999
- 180$20,000 to $29,999
- 230$30,000 to $39,999
- 58$40,000 to $49,999
- 95$50,000 to $59,999
- 152$60,000 to $74,999
- 175$75,000 to $99,999
- 75$100,000 to $124,999
- 88$125,000 to $149,999
- 81$150,000 to $199,999
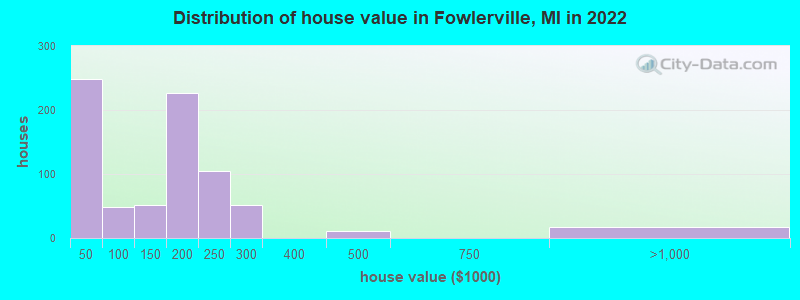
Home value of owner - occupied houses in 2022 in Fowlerville, MI
-
- 192Less than $10,000
- 30$10,000 to $14,999
- 14$15,000 to $19,999
- 12$20,000 to $24,999
- 24$60,000 to $69,999
- 23$90,000 to $99,999
- 41$100,000 to $124,999
- 8$125,000 to $149,999
- 122$150,000 to $174,999
- 103$175,000 to $199,999
- 105$200,000 to $249,999
- 50$250,000 to $299,999
- 10$400,000 to $499,999
- 17$750,000 to $999,999
Rent paid by renters in 2022 in Fowlerville, MI
-
- 8$250 to $299
- 12$300 to $349
- 17$350 to $399
- 6$450 to $499
- 24$500 to $549
- 14$550 to $599
- 20$600 to $649
- 40$650 to $699
- 32$700 to $749
- 16$750 to $799
- 83$800 to $899
- 55$900 to $999
- 67$1,000 to $1,249
- 14No cash rent


Percentage of workers working in this county: 74.7%
Number of people working at home: 76 (5.6% of all workers)
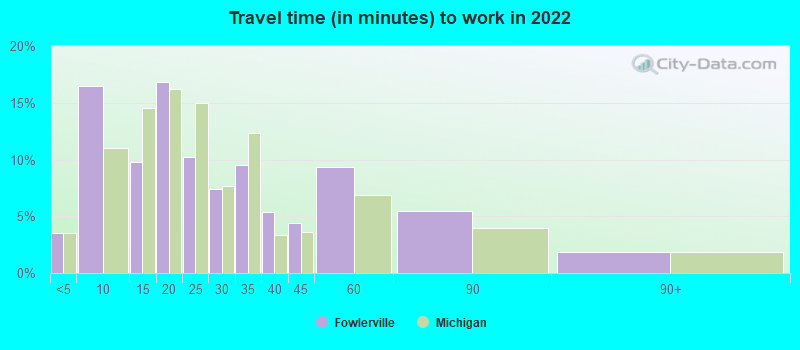
Travel time to work (commute)
- Less than 5 minutes: 72
- 5 to 9 minutes: 277
- 10 to 14 minutes: 101
- 15 to 19 minutes: 206
- 20 to 24 minutes: 66
- 25 to 29 minutes: 111
- 30 to 34 minutes: 45
- 35 to 39 minutes: 99
- 40 to 44 minutes: 39
- 45 to 59 minutes: 89
- 60 to 89 minutes: 134
- 90 or more minutes: 8
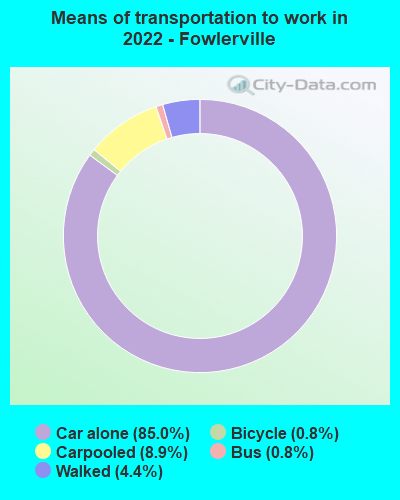
Means of transportation to work:
- Drove a car alone: 2,373 (80.0%)
- Carpooled: 250 (8.4%)
- Bus: 18 (0.6%)
- Taxi: 2 (0.1%)
- Bicycle: 23 (0.8%)
- Walked: 126 (4.2%)
- Worked at home: 74 (2.5%)

- Unemployment by race in 2022
- Unemployment rate for White non-Hispanic residents
- 0.7%Males
- 3.4%Females
- Unemployment rate for two or more race residents
- 41.8%Females

- Year of entry for the foreign-born population in Fowlerville, Michigan
- 12010 or later
- 02000 to 2009
- 21990 to 1999
- 01980 to 1989
- 101970 to 1979
- 27Before 1970

First ancestries reported:
- German: 301 (25.8%)
- American: 220 (18.9%)
- English: 155 (13.3%)
- Italian: 151 (12.9%)
- Finnish: 83 (7.1%)
- Irish: 80 (6.9%)
- French: 66 (5.7%)
- Scandinavian: 21 (1.8%)
- Polish: 20 (1.7%)
- Norwegian: 16 (1.4%)
- Hungarian: 9 (0.8%)
- French Canadian: 6 (0.5%)
- British: 3 (0.3%)
Most common places of birth for foreign-born residents (%):
| Fowlerville: | 66.7% (2) |
| Michigan: | 10.9% (75,965) |
Place of birth for U.S.-born residents:
- This state: 2,495
- Other state: 438
- Northeast: 77
- Midwest: 268
- South: 36
- West: 52
88.3% of Fowlerville residents lived in the same house 1 years ago.
Out of people who lived in different houses, 42.7% lived in this county.
Out of people who lived in different counties, 66.7% lived in Michigan.
| Fowlerville: | 88.3% |
| State average: | 88.4% |
Education attainment for males 25 years and older:
- No schooling: 10
- Nursery to 4th grade: 0
- 5th and 6th grade: 0
- 7th and 8th grade: 0
- 9th grade: 33
- 10th grade: 0
- 11th grade: 0
- 12th grade, no diploma: 3
- High school graduate (or equivalency): 424
- Less than 1 year of college: 138
- Some college more than 1 year, no degree: 124
- Associate degree: 84
- Bachelor's degree: 95
- Master's degree: 9
- Professional school degree: 12
- Doctorate degree: 0

Education attainment for females 25 years and older:
- No schooling: 0
- Nursery to 4th grade: 0
- 5th and 6th grade: 0
- 7th and 8th grade: 38
- 9th grade: 7
- 10th grade: 28
- 11th grade: 11
- 12th grade, no diploma: 16
- High school graduate (or equivalency): 320
- Less than 1 year of college: 71
- Some college more than 1 year, no degree: 228
- Associate degree: 167
- Bachelor's degree: 89
- Master's degree: 48
- Professional school degree: 6
- Doctorate degree: 0


Housing units in structures:
- One, detached: 845
- One, attached: 45
- Two: 61
- 3 or 4: 49
- 5 to 9: 74
- 10 to 19: 63
- 20 to 49: 66
- Mobile homes: 182
Median worth of mobile homes: $9,569
House/condo owner moved in on average 7 years ago
Renter moved in on average 6 years ago

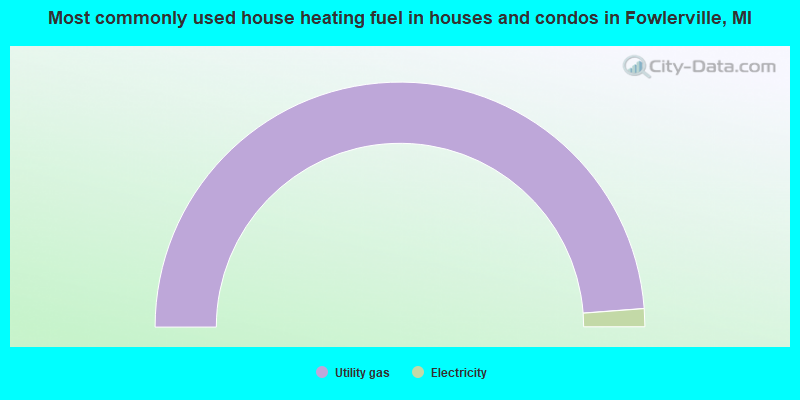
- 97.6%Utility gas
- 2.4%Electricity
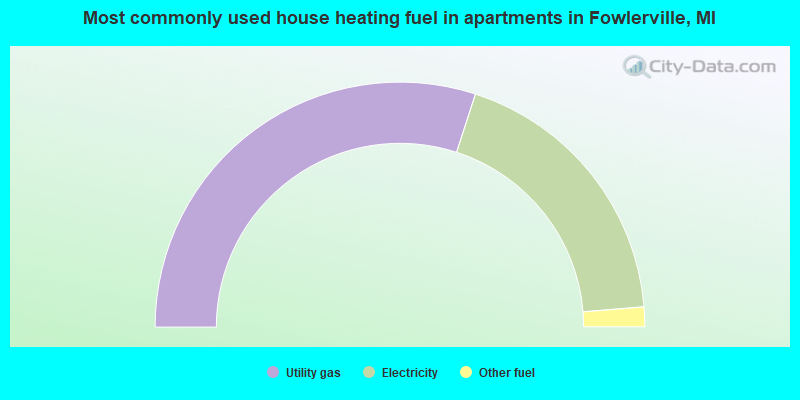
- 60.0%Utility gas
- 37.4%Electricity
- 2.6%Other fuel
Private vs. public school enrollment:
| Here: | 3.7% |
| Michigan: | 12.4% |
| Here: | 0.0% |
| Michigan: | 9.8% |
| Here: | 7.1% |
| Michigan: | 14.9% |


