Foxborough, MA (Massachusetts) Houses and Residents
| Foxborough: | $514,015 |
| Massachusetts: | $534,700 |
Mean price in 2022:
Detached houses: $609,137
Here: $609,137 State: $651,570 Townhouses or other attached units: $457,422
Here: $457,422 State: $617,749 In 2-unit structures: $543,950
Here: $543,950 State: $594,808 In 3-to-4-unit structures: $361,221
Here: $361,221 State: $601,912 In 5-or-more-unit structures: $262,001
Here: $262,001 State: $555,768
Total population: 5,625 (Urban population: 5,516, Rural population: 0)
Houses: 2,997 (2,926 occupied: 1,486 owner occupied, 1,424 renter occupied)
| % of renters here: | 49% |
| State: | 38% |
Housing density: 1,031 houses/condos per square mile
Median price asked for vacant for-sale houses and condos in 2022 in this county: $751,928.
Median contract rent in 2022: $1,541 (lower quartile is $1,011, upper quartile is $1,817)
Median rent asked for vacant for-rent units in 2022: $1,602
Median gross rent in Foxborough, MA in 2022: $1,585
Housing units in Foxborough with a mortgage: 1,068 (247 second mortgage, 70 home equity loan, 185 both second mortgage and home equity loan)
Houses without a mortgage: 9
Median household income for houses/condos with a mortgage: $112,650
Median household income for apartments without a mortgage: $73,931
Median monthly housing costs: $1,671
Compare current foreclosures near Foxborough, MA:
| Photo | Address | Area | Beds / Baths | Price | Details |
|---|---|---|---|---|---|

|
#1
Stillman St
Framingham, MA 01702
|
1,122 sq. feet
|
1 baths 2 beds |
$418,000
|
show details |

|
#2
Somerset Ave
Taunton, MA 02780
|
3,196 sq. feet
|
3 baths 4 beds |
$754,900
|
show details |

|
#3
Loomis St
North Attleboro, MA 02760
|
2,294 sq. feet
|
2 baths 4 beds |
$700,000
|
show details |

|
#4
Adams St
Hyde Park, MA 02136
|
1,988 sq. feet
|
2 baths 4 beds |
$499,200
|
show details |

|
#5
Cook Rd
Cumberland, RI 02864
|
2,050 sq. feet
|
2 baths 4 beds |
$724,900
|
show details |

|
#6
Bittersweet Ln
Randolph, MA 02368
|
882 sq. feet
|
1 baths 2 beds |
show details | |

|
#7
Broadway
North Attleboro, MA 02760
|
2,602 sq. feet
|
3 baths 5 beds |
show details | |

|
#8
Emily Jeffers Rd # L
Randolph, MA 02368
|
1,350 sq. feet
|
1 baths 3 beds |
show details | |

|
#9
Rockwell Ave
Brockton, MA 02302
|
1,774 sq. feet
|
1 baths 3 beds |
show details | |

|
#10
Valley Green Court
Providence, RI 02904
|
1,440 sq. feet
|
3 baths 2 beds |
show details |
| Photo | Address | Area | Beds / Baths | Price | Details |
|---|---|---|---|---|---|

|
#11
Riverside Rd
Franklin, MA 02038
|
3,093 sq. feet
|
2 baths 4 beds |
show details | |

|
#12
Cappys Way
Brockton, MA 02302
|
2,128 sq. feet
|
2 baths 4 beds |
show details | |

|
#13
S Franklin St
Holbrook, MA 02343
|
940 sq. feet
|
2 baths 2 beds |
show details | |

|
#14
Melville Ct
Brockton, MA 02301
|
1,140 sq. feet
|
2 baths 3 beds |
show details | |

|
#15
Ridgehill Rd
Canton, MA 02021
|
1,196 sq. feet
|
1 baths 3 beds |
show details | |

|
#16
Marcy Rd
Mattapan, MA 02126
|
1,168 sq. feet
|
1 baths 3 beds |
show details | |

|
#17
Pond St
Franklin, MA 02038
|
1,100 sq. feet
|
1 baths 3 beds |
show details | |

|
#18
Dwinell Rd
Taunton, MA 02780
|
1,632 sq. feet
|
2 baths 4 beds |
show details | |

|
#19
Pridemark Ln
Attleboro, MA 02703
|
1,340 sq. feet
|
1 baths 2 beds |
show details | |

|
#20
Magoun Ave
Brockton, MA 02301
|
868 sq. feet
|
1 baths 3 beds |
show details |
| Photo | Address | Area | Beds / Baths | Price | Details |
|---|---|---|---|---|---|

|
#21
Neponset St
Canton, MA 02021
|
1,053 sq. feet
|
1 baths 2 beds |
show details | |

|
#22
Ashland St
Taunton, MA 02780
|
1,680 sq. feet
|
2 baths 4 beds |
show details | |

|
#23
Grv St
Needham, MA 02492
|
6,542 sq. feet
|
4 baths 6 beds |
show details | |

|
#24
Webster St
Randolph, MA 02368
|
1,080 sq. feet
|
1 baths 3 beds |
show details | |

|
#25
Ballou St
Quincy, MA 02169
|
1,758 sq. feet
|
1 baths 3 beds |
show details | |

|
#26
Rockland St
Abington, MA 02351
|
1,700 sq. feet
|
1 baths 4 beds |
show details | |

|
#27
Brahms St
Roslindale, MA 02131
|
1,604 sq. feet
|
1 baths 4 beds |
show details | |

|
#28
Tremont St
Brockton, MA 02301
|
1,470 sq. feet
|
2 baths 4 beds |
show details | |

|
#29
Berkshire Ave
Sharon, MA 02067
|
1,289 sq. feet
|
2 baths 3 beds |
show details | |

|
#30
Cedar St
Ashland, MA 01721
|
2,756 sq. feet
|
3 baths 4 beds |
show details |
| Photo | Address | Area | Beds / Baths | Price | Details |
|---|---|---|---|---|---|

|
#31
Tamarack Ln
Abington, MA 02351
|
1,495 sq. feet
|
2 baths 2 beds |
show details | |

|
#32
Gilbert Rd
Needham, MA 02492
|
1,778 sq. feet
|
2 baths 3 beds |
show details | |

|
#33
Congress Pl
Dedham, MA 02026
|
1,966 sq. feet
|
2 baths 4 beds |
show details | |

|
#34
Woodland Ave
Seekonk, MA 02771
|
4,611 sq. feet
|
4 baths 4 beds |
show details | |

|
#35
Congress Pl
Dedham, MA 02026
|
2,747 sq. feet
|
2 baths 3 beds |
show details | |

|
#36
Windsor Rd
Pawtucket, RI 02861
|
1,092 sq. feet
|
1 baths 3 beds |
show details | |

|
#37
Rhode Island Ave
Woonsocket, RI 02895
|
2,080 sq. feet
|
2 baths 6 beds |
show details | |

|
#38
Sherwood Ln
Raynham, MA 02767
|
2,765 sq. feet
|
4 baths 3 beds |
show details | |

|
#39
Belknap St
Dedham, MA 02026
|
1,114 sq. feet
|
1 baths 4 beds |
show details | |

|
#40
Bertenshaw Rd
Woonsocket, RI 02895
|
1,512 sq. feet
|
2 baths 4 beds |
show details |
| Photo | Address | Area | Beds / Baths | Price | Details |
|---|---|---|---|---|---|

|
#41
Winthrop St
Taunton, MA 02780
|
2,057 sq. feet
|
2 baths 4 beds |
show details | |

|
#42
Roseen Rd
Holbrook, MA 02343
|
960 sq. feet
|
1 baths 2 beds |
show details | |

|
#43
Union St
Foxboro, MA 02035
|
1,485 sq. feet
|
1 baths 3 beds |
show details | |

|
#44
N Main St
Raynham, MA 02767
|
2,694 sq. feet
|
3 baths 3 beds |
show details | |

|
#45
Oak St
Taunton, MA 02780
|
2,371 sq. feet
|
2 baths 5 beds |
show details | |

|
#46
Webster St # 1
Pawtucket, RI 02861
|
2,399 sq. feet
|
2 baths 4 beds |
show details | |

|
#47
Rindone St
Holbrook, MA 02343
|
1,828 sq. feet
|
2 baths 6 beds |
show details | |

|
#48
Rindone St
Holbrook, MA 02343
|
1,224 sq. feet
|
1 baths 3 beds |
show details | |

|
#49
School St
Taunton, MA 02780
|
1,486 sq. feet
|
1 baths 2 beds |
show details | |

|
Check over 1 million property listings on Foreclosure.com!
|
browse all offers | |||

Latest news about housing in Foxborough, MA collected exclusively by city-data.com from local newspapers, TV, and radio stations

 | How Much Massachusetts Households Make Per Year: Census Data (37 replies) |
| 2023 Real Estate Observations (5278 replies) |
| 2021 Real Estate Observations (1729 replies) |
| Family home in Boston outskirts (a.k.a which overpriced suburb to choose now)? (55 replies) |
| How About Those Patriots? (1190 replies) |
| Gov Declares "State of Emergency" for Migrant Crisis (1384 replies) |

Median year apartment built: 1971
Household type by relationship:
Households: 6,341- Male householders: 1,373 (588 living alone), Female householders: 1,523 (759 living alone)
1,064 spouses (1,035 opposite-sex spouses), 174 unmarried partners, (174 opposite-sex unmarried partners), 1,814 children (1,723 natural, 30 adopted, 61 stepchildren), 20 grandchildren, 137 brothers or sisters, 59 parents, 0 foster children, 14 other relatives, 137 non-relatives
- In group quarters: 23
Size of family households: 501 2-persons, 280 3-persons, 407 4-persons, 146 5-persons, 18 6-persons.
Size of nonfamily households: 1,407 1-person, 175 2-persons.
1,070 married couples with children.
270 single-parent households (0 men, 270 women).
76.2% of residents of Foxborough speak English at home.
6.5% of residents speak other Indo-European language at home (96% speak English very well, 4% speak English not well).
7.3% of residents speak Asian or Pacific Island language at home (48% speak English very well, 12% speak English well, 29% speak English not well, 11% don't speak English at all).
10.0% of residents speak other language at home (100% speak English very well).
Foreign born population: 881 (13.9%)
(52.7% of them are naturalized citizens)
| Here: | 6.4 |
| State: | 6.5 |
| Here: | 3.9 |
| State: | 4.0 |

- Bedrooms in owner-occupied houses and condos in Foxborough, Massachusetts
- 14no bedroom
- 321 bedroom
- 4462 bedrooms
- 5973 bedrooms
- 3274 bedrooms
- 705+ bedrooms

- Bedrooms in renter-occupied apartments in Foxborough, Massachusetts
- 57no bedroom
- 4261 bedroom
- 8182 bedrooms
- 633 bedrooms
- 204 bedrooms
- 415+ bedrooms

- Cars and other vehicles available in Foxborough in owner-occupied houses/condos
- 62no vehicle
- 4561 vehicle
- 5972 vehicles
- 3063 vehicles
- 664 vehicles
- 05+ vehicles

- Cars and other vehicles available in Foxborough in renter-occupied apartments
- 79no vehicle
- 1,0131 vehicle
- 2402 vehicles
- 763 vehicles
- 174 vehicles
- 05+ vehicles

- Rooms in owner-occupied houses in Foxborough, Massachusetts
- 141 room
- 02 rooms
- 313 rooms
- 1514 rooms
- 2055 rooms
- 3906 rooms
- 2617 rooms
- 2638 rooms
- 1729+ rooms

- Rooms in renter-occupied apartments in Foxborough, Massachusetts
- 571 room
- 372 rooms
- 3533 rooms
- 6774 rooms
- 1975 rooms
- 426 rooms
- 07 rooms
- 418 rooms
- 209+ rooms


Foxborough, MA household income distribution

- 195Less than $10,000
- 349$10,000 to $19,999
- 340$20,000 to $29,999
- 144$30,000 to $39,999
- 144$40,000 to $49,999
- 212$50,000 to $59,999
- 194$60,000 to $74,999
- 442$75,000 to $99,999
- 294$100,000 to $124,999
- 100$125,000 to $149,999
- 219$150,000 to $199,999
- 314$200,000 or more

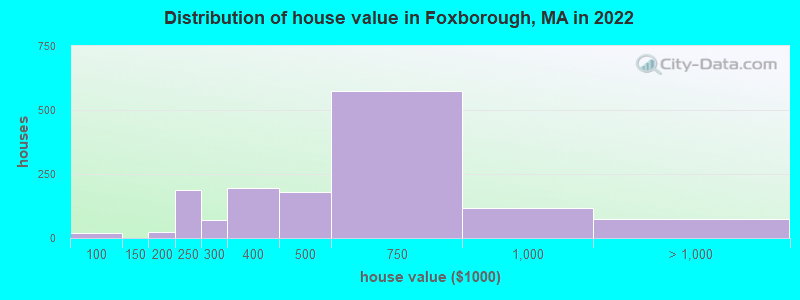
Home value of owner - occupied houses in 2022 in Foxborough, MA
-
- 19$70,000 to $79,999
- 14$150,000 to $174,999
- 7$175,000 to $199,999
- 189$200,000 to $249,999
- 72$250,000 to $299,999
- 195$300,000 to $399,999
- 178$400,000 to $499,999
- 574$500,000 to $749,999
- 118$750,000 to $999,999
- 76$1,000,000 to $1,499,999
Rent paid by renters in 2022 in Foxborough, MA
-
- 119$250 to $299
- 51$350 to $399
- 50$400 to $449
- 38$450 to $499
- 32$650 to $699
- 7$750 to $799
- 14$800 to $899
- 15$900 to $999
- 122$1,000 to $1,249
- 199$1,250 to $1,499
- 585$1,500 to $1,999
- 48$2,000 to $2,499
- 24No cash rent


Percentage of workers working in this county: 64.4%
Number of people working at home: 367 (12.2% of all workers)

Travel time to work (commute)
- Less than 5 minutes: 90
- 5 to 9 minutes: 206
- 10 to 14 minutes: 294
- 15 to 19 minutes: 262
- 20 to 24 minutes: 211
- 25 to 29 minutes: 153
- 30 to 34 minutes: 394
- 35 to 39 minutes: 136
- 40 to 44 minutes: 126
- 45 to 59 minutes: 285
- 60 to 89 minutes: 310
- 90 or more minutes: 91
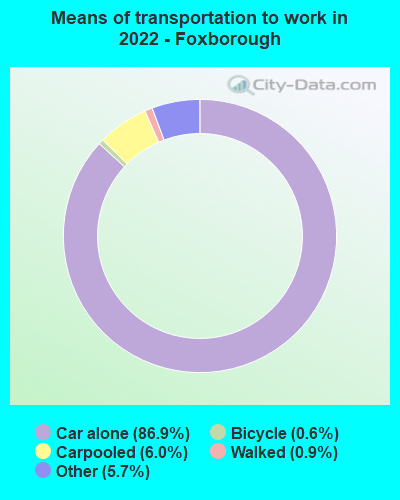
Means of transportation to work:
- Drove a car alone: 3,363 (77.0%)
- Carpooled: 226 (5.2%)
- Taxi: 238 (5.5%)
- Bicycle: 14 (0.3%)
- Walked: 31 (0.7%)
- Worked at home: 367 (8.4%)

- Unemployment by race in 2022
- Unemployment rate for White non-Hispanic residents
- 0.9%Males
- 2.6%Females
- Unemployment rate for two or more race residents
- 49.6%Females

- Year of entry for the foreign-born population in Foxborough, Massachusetts
- 5192010 or later
- 452000 to 2009
- 1511990 to 1999
- 261980 to 1989
- 411970 to 1979
- 86Before 1970

First ancestries reported:
- Irish: 834 (26.2%)
- Nigerian: 311 (9.8%)
- Italian: 190 (6.0%)
- English: 161 (5.1%)
- French Canadian: 103 (3.2%)
- Haitian: 95 (3.0%)
- Lebanese: 92 (2.9%)
- French: 79 (2.5%)
- Portuguese: 67 (2.1%)
- American: 62 (1.9%)
- Egyptian: 48 (1.5%)
- German: 45 (1.4%)
- Swedish: 33 (1.0%)
- Polish: 28 (0.9%)
- Scotch-Irish: 18 (0.6%)
- Lithuanian: 16 (0.5%)
- Hungarian: 14 (0.4%)
- Latvian: 14 (0.4%)
- Russian: 13 (0.4%)
- Austrian: 12 (0.4%)
- Slovak: 12 (0.4%)
- Scandinavian: 9 (0.3%)
- Welsh: 9 (0.3%)
- British: 3 (0.09%)
Most common places of birth for foreign-born residents (%):
| Foxborough: | 26.3% (230) |
| Massachusetts: | 3.0% (37,197) |
| Foxborough: | 18.9% (166) |
| Massachusetts: | 6.8% (82,934) |
| Foxborough: | 12.1% (106) |
| Massachusetts: | 8.3% (101,767) |
| Foxborough: | 7.1% (62) |
| Massachusetts: | 0.6% (7,064) |
| Foxborough: | 6.3% (55) |
| Massachusetts: | 1.5% (18,278) |
| Foxborough: | 5.0% (44) |
| Massachusetts: | 0.5% (6,109) |
| Foxborough: | 4.6% (40) |
| Massachusetts: | 0.7% (8,746) |
| Foxborough: | 4.3% (38) |
| Massachusetts: | 0.9% (10,808) |
| Foxborough: | 3.7% (32) |
| Massachusetts: | 4.1% (50,360) |
| Foxborough: | 2.1% (18) |
| Massachusetts: | 4.9% (60,432) |
Place of birth for U.S.-born residents:
- This state: 4,016
- Other state: 1,399
- Northeast: 760
- Midwest: 208
- South: 279
- West: 146
88.7% of Foxborough residents lived in the same house 1 years ago.
Out of people who lived in different houses, 16.1% lived in this county.
Out of people who lived in different counties, 56.1% lived in Massachusetts.
| Foxborough: | 88.7% |
| State average: | 87.7% |
Education attainment for males 25 years and older:
- No schooling: 13
- Nursery to 4th grade: 0
- 5th and 6th grade: 0
- 7th and 8th grade: 0
- 9th grade: 19
- 10th grade: 0
- 11th grade: 16
- 12th grade, no diploma: 0
- High school graduate (or equivalency): 477
- Less than 1 year of college: 23
- Some college more than 1 year, no degree: 341
- Associate degree: 179
- Bachelor's degree: 814
- Master's degree: 267
- Professional school degree: 0
- Doctorate degree: 57

Education attainment for females 25 years and older:
- No schooling: 27
- Nursery to 4th grade: 0
- 5th and 6th grade: 67
- 7th and 8th grade: 15
- 9th grade: 0
- 10th grade: 0
- 11th grade: 39
- 12th grade, no diploma: 0
- High school graduate (or equivalency): 421
- Less than 1 year of college: 125
- Some college more than 1 year, no degree: 267
- Associate degree: 123
- Bachelor's degree: 598
- Master's degree: 503
- Professional school degree: 45
- Doctorate degree: 0


Housing units in structures:
- One, detached: 956
- One, attached: 275
- Two: 184
- 3 or 4: 454
- 5 to 9: 932
- 10 to 19: 179
- 20 to 49: 14
Housing units lacking complete kitchen facilities in 2022: 0.5%
House/condo owner moved in on average 10 years ago
Renter moved in on average 5 years ago


- 61.5%Utility gas
- 19.8%Fuel oil, kerosene, etc.
- 11.1%Electricity
- 3.5%Bottled, tank, or LP gas
- 2.7%Other fuel
- 1.4%Wood

- 42.0%Utility gas
- 41.3%Electricity
- 11.3%Fuel oil, kerosene, etc.
- 3.8%Bottled, tank, or LP gas
- 1.6%No fuel used
Private vs. public school enrollment:
| Here: | 0.0% |
| Massachusetts: | 10.3% |
| Here: | 24.0% |
| Massachusetts: | 12.3% |
| Here: | 47.7% |
| Massachusetts: | 51.2% |


