Franconia, VA (Virginia) Houses and Residents
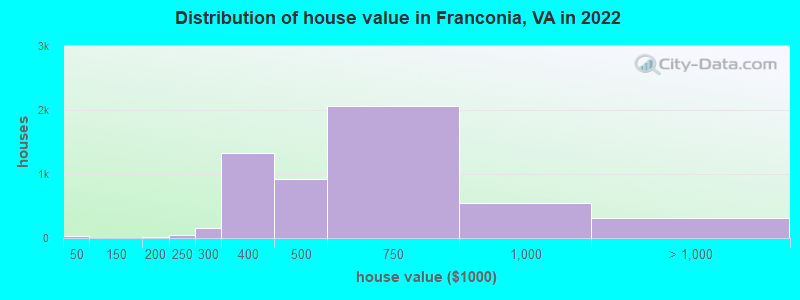
Estimated median house or condo value in 2022: $529,481 (it was $177,900 in 2000 )
Franconia:
$529,481Virginia:
$365,700
Lower value quartile - upper value quartile: $408,354 - $701,733Mean price in 2022: Detached houses: $1,026,198 Here:
$1,026,198State:
$472,865
Townhouses or other attached units: $542,835 Here:
$542,835State:
$457,437
In 2-unit structures: $384,878 Here:
$384,878State:
$396,289
In 3-to-4-unit structures: $322,575 Here:
$322,575State:
$252,346
In 5-or-more-unit structures: $375,759 Here:
$375,759State:
$382,551
Total population: 18,245 (All urban)
Houses: 7,726 (7,505 occupied: 5,711 owner occupied, 1,835 renter occupied )
% of renters here:
24%State:
33%
Housing density: 1,081 houses/condos per square mile
Median price asked for vacant for-sale houses and condos in 2022: $264,245.
Median contract rent in 2022: over $2,000 (lower quartile is $1,739, upper quartile is over $2,000)
Median rent asked for vacant for-rent units in 2022: $2,856
Median gross rent in Franconia, VA in 2022: over $2,000
Housing units in Franconia with a mortgage: 4,357 (305 second mortgage, 5 home equity loan, 266 both second mortgage and home equity loan )Houses without a mortgage: 115
Median household income for houses/condos with a mortgage: $170,662
Median household income for apartments without a mortgage: $112,400
Median monthly housing costs: $2,284
Data:
Median house or condo value ($)
Median house or condo value ($ change since 2000)
Median house or condo value ($) - White
Median house or condo value ($) - Black or African American
Median house or condo value ($) - Asian
Median house or condo value ($) - Hispanic or Latino
Median house or condo value ($) - American Indian and Alaska Native
Median house or condo value ($) - Multirace
Median house or condo value ($) - Other Race
Median price asked for mobile homes ($)
Household density (households per square mile)
Mean house or condo value by units in structure - 1, detached ($)
Mean house or condo value by units in structure - 1, attached ($)
Mean house or condo value by units in structure - 2 ($)
Mean house or condo value by units in structure by units in structure - 3 or 4 ($)
Mean house or condo value by units in structure - 5 or more ($)
Mean house or condo value by units in structure - Boat, RV, van, etc. ($)
Mean house or condo value by units in structure - Mobile home ($)
Median contract rent ($)
Median contract rent - Lower quartile ($)
Median contract rent - Upper quartile ($)
Median gross rent ($)
Urban houses (%)
Rural houses (%)
Houses occupied (%)
Houses occupied (% change since 2000)
Houses owner occupied (%)
Houses owner occupied (% change since 2000)
Houses renter occupied (%)
Houses renter occupied (% change since 2000)
Vacant housing units - For rent (%)
Vacant housing units - For rent (% change since 2000)
Vacant housing units - For sale only (%)
Vacant housing units - For sale only (% change since 2000)
Vacant housing units - Rented or sold, not occupied (%)
Vacant housing units - Rented or sold, not occupied (% change since 2000)
Vacant housing units - For seasonal, recreational, or occasional use (%)
Vacant housing units - For seasonal, recreational, or occasional use (% change since 2000)
Vacant housing units - For migrant workers (%)
Vacant housing units - For migrant workers (% change since 2000)
Vacant housing units - Other vacant (%)
Vacant housing units - Other vacant (% change since 2000)
Median monthly housing costs ($)
Median household income for houses/condos with a mortgage ($)
Median household income for houses/condos without a mortgage ($)
Median household income ($)
Median household income ($) - White
Median household income ($) - Black or African American
Median household income ($) - Asian
Median household income ($) - Hispanic or Latino
Median household income ($) - American Indian and Alaska Native
Median household income ($) - Multirace
Median household income ($) - Other Race
Mortgage status - with mortgage (%)
Mortgage status - with second mortgage (%)
Mortgage status - with home equity loan (%)
Mortgage status - with both second mortgage and home equity loan (%)
Mortgage status - without a mortgage (%)
Median year house/condo built
Median year apartment built
Household type by relationship - Male householder living alone (%)
Household type by relationship - Male householder not living alone (%)
Household type by relationship - Female householder living alone (%)
Household type by relationship - Female householder not living alone (%)
Household type by relationship - Opposite-Sex spouse (%)
Household type by relationship - Same-Sex spouse (%)
Household type by relationship - Opposite-Sex unmarried partner (%)
Household type by relationship - Same-Sex unmarried partner (%)
Household type by relationship - In group quarters (%)
Size of family households - 2-person household (%)
Size of family households - 3-person household (%)
Size of family households - 4-person household (%)
Size of family households - 5-person household (%)
Size of family households - 6-person household (%)
Size of family households - 7-or-more-person household (%)
Size of nonfamily households - 1-person household (%)
Size of nonfamily households - 2-person household (%)
Size of nonfamily households - 3-person household (%)
Size of nonfamily households - 4-person household (%)
Size of nonfamily households - 5-person household (%)
Size of nonfamily households - 6-person household (%)
Size of nonfamily households - 7-or-moreperson household (%)
Year house built - Built 2010 or later (%)
Year house built - Built 2000 to 2009 (%)
Year house built - Built 1990 to 1999 (%)
Year house built - Built 1980 to 1989 (%)
Year house built - Built 1970 to 1979 (%)
Year house built - Built 1960 to 1969 (%)
Year house built - Built 1950 to 1959 (%)
Year house built - Built 1940 to 1949 (%)
Year house built - Built 1939 or earlier (%)
Median number of rooms in houses and condos
Median number of rooms in apartments
Median number of bedrooms in owner occupied houses
Mean number of bedrooms in owner occupied houses
Median number of bedrooms in renter occupied houses
Mean number of bedrooms in renter occupied houses
Median number of vehichles in owner occupied houses
Mean number of vehichles in owner occupied houses
Median number of vehichles in renter occupied houses
Mean number of vehichles in renter occupied houses
Rooms in owner-occupied houses - 1 room (%)
Rooms in owner-occupied houses - 2 rooms (%)
Rooms in owner-occupied houses - 3 rooms (%)
Rooms in owner-occupied houses - 4 rooms (%)
Rooms in owner-occupied houses - 5 rooms (%)
Rooms in owner-occupied houses - 6 rooms (%)
Rooms in owner-occupied houses - 7 rooms (%)
Rooms in owner-occupied houses - 8 rooms (%)
Rooms in owner-occupied houses - 9+ rooms (%)
Rooms in renter-occupied houses - 1 room (%)
Rooms in renter-occupied houses - 2 rooms (%)
Rooms in renter-occupied houses - 3 rooms (%)
Rooms in renter-occupied houses - 4 rooms (%)
Rooms in renter-occupied houses - 5 rooms (%)
Rooms in renter-occupied houses - 6 rooms (%)
Rooms in renter-occupied houses - 7 rooms (%)
Rooms in renter-occupied houses - 8 rooms (%)
Rooms in renter-occupied houses - 9+ rooms (%)
Bedrooms in owner-occupied houses - no bedrooms (%)
Bedrooms in owner-occupied houses - 1 bedroom (%)
Bedrooms in owner-occupied houses - 2 bedrooms (%)
Bedrooms in owner-occupied houses - 3 bedrooms (%)
Bedrooms in owner-occupied houses - 4 bedrooms (%)
Bedrooms in owner-occupied houses - 5+ bedrooms (%)
Bedrooms in renter-occupied houses - no bedrooms (%)
Bedrooms in renter-occupied houses - 1 bedroom (%)
Bedrooms in renter-occupied houses - 2 bedrooms (%)
Bedrooms in renter-occupied houses - 3 bedrooms (%)
Bedrooms in renter-occupied houses - 4 bedrooms (%)
Bedrooms in renter-occupied houses - 5+ bedrooms (%)
Vehicles available in owner-occupied houses - no vehicle available (%)
Vehicles available in owner-occupied houses - 1 vehicle available(%)
Vehicles available in owner-occupied houses - 2 Vehicles available (%)
Vehicles available in owner-occupied houses - 3 Vehicles available (%)
Vehicles available in owner-occupied houses - 4 Vehicles available (%)
Vehicles available in owner-occupied houses - 5+ Vehicles available (%)
Vehicles available in renter-occupied houses - no vehicle available (%)
Vehicles available in renter-occupied houses - 1 vehicle available (%)
Vehicles available in renter-occupied houses - 2 Vehicles available (%)
Vehicles available in renter-occupied houses - 3 Vehicles available (%)
Vehicles available in renter-occupied houses - 4 Vehicles available (%)
Vehicles available in renter-occupied houses - 5+ Vehicles available (%)
Housing units in structures - 1, detached (%)
Housing units in structures - 1, attached (%)
Housing units in structures - 2 (%)
Housing units in structures - 3 or 4 (%)
Housing units in structures - 5 to 9 (%)
Housing units in structures - 10 to 19 (%)
Housing units in structures - 20 to 49 (%)
Housing units in structures - 50 or more (%)
Housing units in structures - Mobile home (%)
Housing units in structures - Boat, RV, van, etc. (%)
Housing units in structures - Owners - 1, detached (%)
Housing units in structures - Owners - 1, attached (%)
Housing units in structures - Owners - 2 (%)
Housing units in structures - Owners - 3 or 4 (%)
Housing units in structures - Owners - 5 to 9 (%)
Housing units in structures - Owners - 10 to 19 (%)
Housing units in structures - Owners - 20 to 49 (%)
Housing units in structures - Owners - 50 or more (%)
Housing units in structures - Owners - Mobile home (%)
Housing units in structures - Owners - Boat, RV, van, etc. (%)
Housing units in structures - Renters - 1, detached (%)
Housing units in structures - Renters - 1, attached (%)
Housing units in structures - Renters - 2 (%)
Housing units in structures - Renters - 3 or 4 (%)
Housing units in structures - Renters - 5 to 9 (%)
Housing units in structures - Renters - 10 to 19 (%)
Housing units in structures - Renters - 20 to 49 (%)
Housing units in structures - Renters - 50 or more (%)
Housing units in structures - Renters - Mobile home (%)
Housing units in structures - Renters - Boat, RV, van, etc. (%)
House/condo owner moved in on average (years ago)
Renter moved in on average (years ago)
Year householder moved into unit - Moved in 1999 to March 2000 (%)
Year householder moved into unit - Moved in 1999 to March 2000 (%) - White
Year householder moved into unit - Moved in 1999 to March 2000 (%) - Black or African American
Year householder moved into unit - Moved in 1999 to March 2000 (%) - Asian
Year householder moved into unit - Moved in 1999 to March 2000 (%) - Hispanic or Latino
Year householder moved into unit - Moved in 1999 to March 2000 (%) - American Indian and Alaska Native
Year householder moved into unit - Moved in 1999 to March 2000 (%) - Multirace
Year householder moved into unit - Moved in 1999 to March 2000 (%) - Other Race
Year householder moved into unit - Moved in 1995 to 1998 (%)
Year householder moved into unit - Moved in 1995 to 1998 (%) - White
Year householder moved into unit - Moved in 1995 to 1998 (%) - Black or African American
Year householder moved into unit - Moved in 1995 to 1998 (%) - Asian
Year householder moved into unit - Moved in 1995 to 1998 (%) - Hispanic or Latino
Year householder moved into unit - Moved in 1995 to 1998 (%) - American Indian and Alaska Native
Year householder moved into unit - Moved in 1995 to 1998 (%) - Multirace
Year householder moved into unit - Moved in 1995 to 1998 (%) - Other Race
Year householder moved into unit - Moved in 1990 to 1994 (%)
Year householder moved into unit - Moved in 1990 to 1994 (%) - White
Year householder moved into unit - Moved in 1990 to 1994 (%) - Black or African American
Year householder moved into unit - Moved in 1990 to 1994 (%) - Asian
Year householder moved into unit - Moved in 1990 to 1994 (%) - Hispanic or Latino
Year householder moved into unit - Moved in 1990 to 1994 (%) - American Indian and Alaska Native
Year householder moved into unit - Moved in 1990 to 1994 (%) - Multirace
Year householder moved into unit - Moved in 1990 to 1994 (%) - Other Race
Year householder moved into unit - Moved in 1980 to 1989 (%)
Year householder moved into unit - Moved in 1980 to 1989 (%) - White
Year householder moved into unit - Moved in 1980 to 1989 (%) - Black or African American
Year householder moved into unit - Moved in 1980 to 1989 (%) - Asian
Year householder moved into unit - Moved in 1980 to 1989 (%) - Hispanic or Latino
Year householder moved into unit - Moved in 1980 to 1989 (%) - American Indian and Alaska Native
Year householder moved into unit - Moved in 1980 to 1989 (%) - Multirace
Year householder moved into unit - Moved in 1980 to 1989 (%) - Other Race
Year householder moved into unit - Moved in 1970 to 1979 (%)
Year householder moved into unit - Moved in 1970 to 1979 (%) - White
Year householder moved into unit - Moved in 1970 to 1979 (%) - Black or African American
Year householder moved into unit - Moved in 1970 to 1979 (%) - Asian
Year householder moved into unit - Moved in 1970 to 1979 (%) - Hispanic or Latino
Year householder moved into unit - Moved in 1970 to 1979 (%) - American Indian and Alaska Native
Year householder moved into unit - Moved in 1970 to 1979 (%) - Multirace
Year householder moved into unit - Moved in 1970 to 1979 (%) - Other Race
Year householder moved into unit - Moved in 1969 or earlier (%)
Year householder moved into unit - Moved in 1969 or earlier (%) - White
Year householder moved into unit - Moved in 1969 or earlier (%) - Black or African American
Year householder moved into unit - Moved in 1969 or earlier (%) - Asian
Year householder moved into unit - Moved in 1969 or earlier (%) - Hispanic or Latino
Year householder moved into unit - Moved in 1969 or earlier (%) - American Indian and Alaska Native
Year householder moved into unit - Moved in 1969 or earlier (%) - Multirace
Year householder moved into unit - Moved in 1969 or earlier (%) - Other Race
Housing units lacking complete plumbing facilities (%)
Housing units lacking complete kitchen facilities (%)
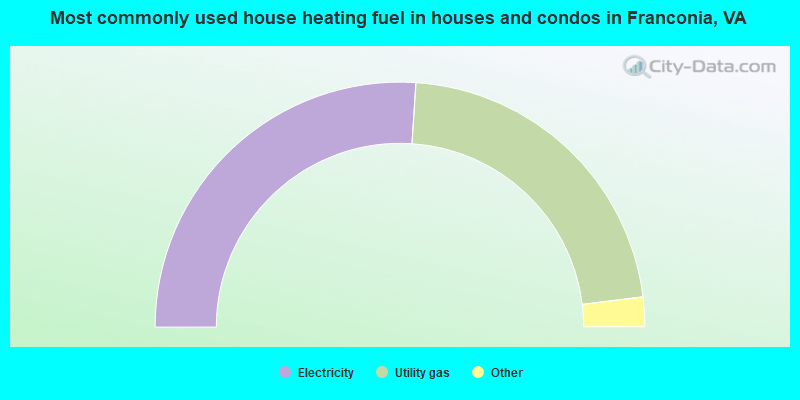
House heating fuel used in houses and condos - Utility gas (%)
House heating fuel used in houses and condos - Bottled, tank, or LP gas (%)
House heating fuel used in houses and condos - Electricity (%)
House heating fuel used in houses and condos - Fuel oil, kerosene, etc. (%)
House heating fuel used in houses and condos - Coal or coke (%)
House heating fuel used in houses and condos - Wood (%)
House heating fuel used in houses and condos - Solar energy (%)
House heating fuel used in houses and condos - Other fuel (%)
House heating fuel used in houses and condos - No fuel used (%)
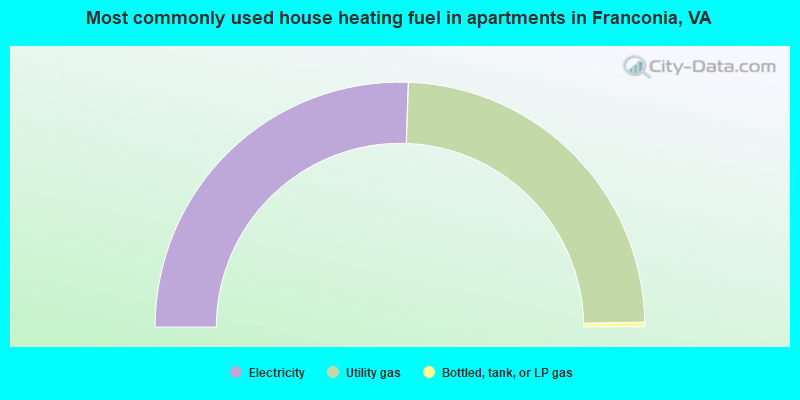
House heating fuel used in apartments - Utility gas (%)
House heating fuel used in apartments - Bottled, tank, or LP gas (%)
House heating fuel used in apartments - Electricity (%)
House heating fuel used in apartments - Fuel oil, kerosene, etc. (%)
House heating fuel used in apartments - Coal or coke (%)
House heating fuel used in apartments - Wood (%)
House heating fuel used in apartments - Solar energy (%)
House heating fuel used in apartments - Other fuel (%)
House heating fuel used in apartments - No fuel used (%)
Latest news about housing in Franconia, VA collected exclusively by city-data.com from local newspapers, TV, and radio stations
Median year house/condo built: 1988Median year apartment built: 1993Household type by relationship:
Households: 17,796
Male householders: 3,713 (891 living alone ), Female householders: 3,697 (1,366 living alone )3,727 spouses (3,672 opposite-sex spouses ), 503 unmarried partners , (494 opposite-sex unmarried partners ), 4,439 children (4,237 natural , 39 adopted , 162 stepchildren ), 304 grandchildren , 143 brothers or sisters , 422 parents , 0 foster children , 185 other relatives , 649 non-relatives In group quarters: 8
Size of family households: 1,853 2-persons , 1,419 3-persons , 867 4-persons , 285 5-persons , 74 6-persons , 7 7-or-more-persons .
Size of nonfamily households: 2,329 1-person , 731 2-persons , 23 3-persons .
2,376 married couples with children. single-parent households (163 men , 365 women ).
65.3% of residents of Franconia speak English at home. of residents speak Spanish at home (64% speak English very well , 19% speak English well , 17% speak English not well ).of residents speak other Indo-European language at home (83% speak English very well , 11% speak English well , 4% speak English not well , 2% don't speak English at all ).of residents speak Asian or Pacific Island language at home (60% speak English very well , 22% speak English well , 18% speak English not well , 1% don't speak English at all ).of residents speak other language at home (84% speak English very well , 16% speak English well ).
Foreign born population: 4,886 (27.5%)of them are naturalized citizens )
Median number of rooms in houses and condos:
Median number of rooms in apartments
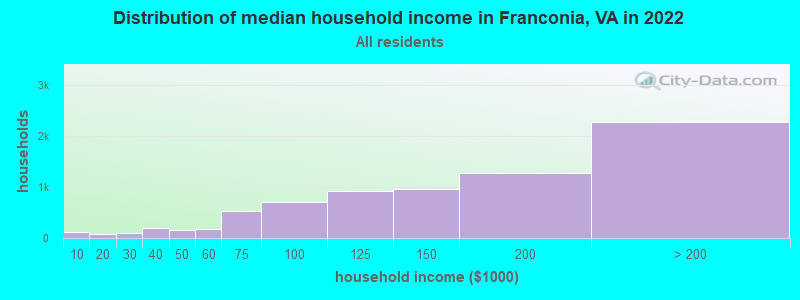
Franconia, VA household income distribution 126 Less than $10,00084 $10,000 to $19,999100 $20,000 to $29,999200 $30,000 to $39,999160 $40,000 to $49,999173 $50,000 to $59,999537 $60,000 to $74,999703 $75,000 to $99,999927 $100,000 to $124,999952 $125,000 to $149,9991,279 $150,000 to $199,9992,268 $200,000 or more
Home value of owner - occupied houses in 2022 in Franconia, VA 14 Less than $10,00021 $30,000 to $34,99914 $175,000 to $199,99940 $200,000 to $249,999153 $250,000 to $299,9991,322 $300,000 to $399,999921 $400,000 to $499,9992,068 $500,000 to $749,999540 $750,000 to $999,999230 $1,000,000 to $1,499,99915 $1,500,000 to $1,999,99965 $2,000,000 or moreRent paid by renters in 2022 in Franconia, VA 2 $650 to $69916 $800 to $899156 $1,000 to $1,24960 $1,250 to $1,499526 $1,500 to $1,999548 $2,000 to $2,499386 $2,500 to $2,999103 $3,000 to $3,49930 $3,500 or more46 No cash rent
Percentage of workers working in this county: 64.7%Number of people working at home: 4,539 (39.4% of all workers )
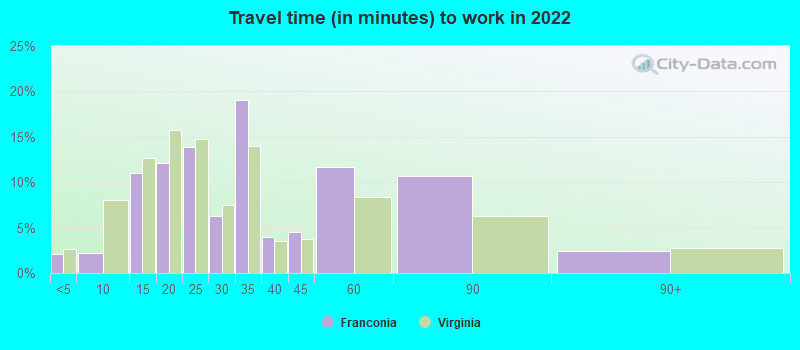
Travel time to work (commute)
Less than 5 minutes: 1105 to 9 minutes: 10810 to 14 minutes: 68315 to 19 minutes: 63520 to 24 minutes: 1,03425 to 29 minutes: 45430 to 34 minutes: 1,46735 to 39 minutes: 49440 to 44 minutes: 59945 to 59 minutes: 87160 to 89 minutes: 56090 or more minutes: 101
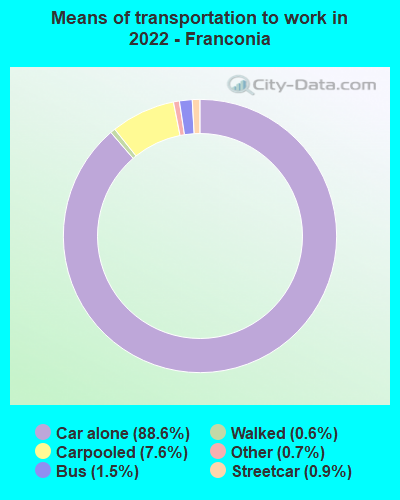
Means of transportation to work:
Drove a car alone: 5,775 (54.7%)Carpooled: 511 (4.8%)Bus : 67 (0.6%)Subway or elevated rail : 48 (0.5%)Taxi: 65 (0.6%)Walked: 47 (0.4%)Worked at home: 4,539 (43.0%)
Unemployment by race in 2022
Unemployment rate for White non-Hispanic residents 5.0% Males1.2% FemalesUnemployment rate for Black residents 3.3% MalesUnemployment rate for Asian residents 0.4% MalesUnemployment rate for other race residents 8.5% MalesUnemployment rate for Hispanic or Latino residents 3.0% Males
Year of entry for the foreign-born population in Franconia, Virginia
749 2010 or later 1,281 2000 to 2009 1,039 1990 to 1999 2,068 1980 to 1989 994 1970 to 1979 649 Before 1970
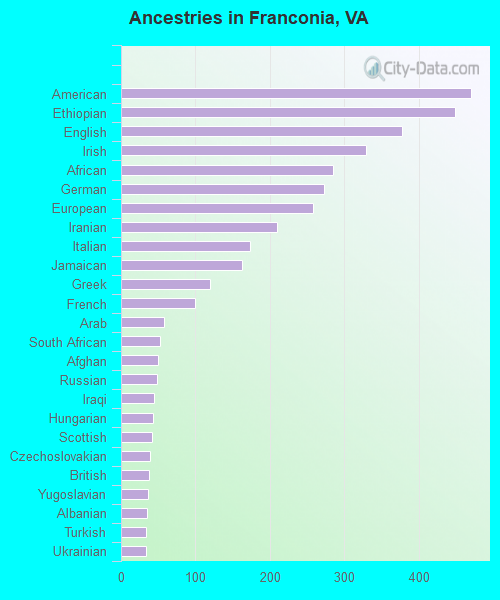
First ancestries reported:
American: 471 (4.8%)
Ethiopian: 449 (4.6%)
English: 377 (3.9%)
Irish: 329 (3.4%)
African: 285 (2.9%)
German: 273 (2.8%)
European: 258 (2.7%)
Iranian: 210 (2.2%)
Italian: 174 (1.8%)
Jamaican: 162 (1.7%)
Greek: 119 (1.2%)
French: 100 (1.0%)
Arab: 58 (0.6%)
South African: 53 (0.5%)
Afghan: 50 (0.5%)
Russian: 49 (0.5%)
Iraqi: 45 (0.5%)
Hungarian: 43 (0.4%)
Scottish: 41 (0.4%)
Czechoslovakian: 39 (0.4%)
British: 38 (0.4%)
Yugoslavian: 36 (0.4%)
Albanian: 35 (0.4%)
Turkish: 34 (0.3%)
Ukrainian: 33 (0.3%)
Sudanese: 30 (0.3%)
Barbadian: 29 (0.3%)
Lebanese: 28 (0.3%)
Polish: 27 (0.3%)
Romanian: 23 (0.2%)
Scotch-Irish: 18 (0.2%)
Portuguese: 18 (0.2%)
Norwegian: 18 (0.2%)
Swedish: 17 (0.2%)
Lithuanian: 16 (0.2%)
Eastern European: 14 (0.1%)
Serbian: 14 (0.1%)
Austrian: 13 (0.1%)
Armenian: 12 (0.1%)
Dutch: 11 (0.1%)
Slovak: 11 (0.1%)
Danish: 9 (0.09%)
Nigerian: 7 (0.07%)
Zimbabwean: 7 (0.07%)
Slovene: 6 (0.06%)
Ghanaian: 4 (0.04%)
Brazilian: 2 (0.02%)
Swiss: 2 (0.02%)
Northern European: 1 (0.01%)
Most common places of birth for foreign-born residents (%): Vietnam Franconia:
12.5% (611)Virginia:
4.2% (45,750)
Ethiopia Franconia:
10.8% (526)Virginia:
2.9% (32,082)
Philippines Franconia:
5.8% (282)Virginia:
4.8% (52,629)
India Franconia:
5.7% (277)Virginia:
9.0% (97,830)
Korea Franconia:
4.7% (228)Virginia:
4.9% (52,857)
Thailand Franconia:
4.1% (200)Virginia:
0.7% (7,672)
Peru Franconia:
4.1% (200)Virginia:
2.4% (26,366)
Guatemala Franconia:
3.4% (167)Virginia:
3.3% (35,938)
Other Northern Africa Franconia:
3.1% (151)Virginia:
0.1% (950)
China, excluding Hong Kong and Taiwan Franconia:
2.9% (144)Virginia:
3.9% (42,989)
Iran Franconia:
2.4% (117)Virginia:
1.3% (14,417)
Jamaica Franconia:
2.4% (115)Virginia:
1.0% (10,734)
Nicaragua Franconia:
2.1% (103)Virginia:
0.6% (6,916)
Pakistan Franconia:
2.0% (98)Virginia:
2.3% (24,582)
El Salvador Franconia:
1.9% (93)Virginia:
9.9% (107,534)
Argentina Franconia:
1.8% (87)Virginia:
0.5% (4,997)
Afghanistan Franconia:
1.8% (87)Virginia:
1.8% (19,426)
Other South America Franconia:
1.7% (81)Virginia:
0.1% (1,443)
Ecuador Franconia:
1.6% (76)Virginia:
0.4% (4,715)
Place of birth for U.S.-born residents:
This state: 4,809Other state: 7,613Northeast: 2,162Midwest: 1,294South: 3,454West: 676 85.2% of Franconia residents lived in the same house 1 years ago.
Out of people who lived in different houses, 32.9% lived in this county.
Out of people who lived in different counties, 44.2% lived in Virginia.
Franconia:
85.2%State average:
86.6%
Education attainment for males 25 years and older:
No schooling: 28Nursery to 4th grade: 05th and 6th grade: 167th and 8th grade: 239th grade: 3310th grade: 4011th grade: 5012th grade, no diploma: 156High school graduate (or equivalency): 772Less than 1 year of college: 242Some college more than 1 year, no degree: 472Associate degree: 485Bachelor's degree: 2,389Master's degree: 1,466Professional school degree: 355Doctorate degree: 210
Education attainment for females 25 years and older:
No schooling: 84Nursery to 4th grade: 05th and 6th grade: 547th and 8th grade: 139th grade: 4010th grade: 5911th grade: 5812th grade, no diploma: 72High school graduate (or equivalency): 681Less than 1 year of college: 271Some college more than 1 year, no degree: 560Associate degree: 314Bachelor's degree: 2,178Master's degree: 1,999Professional school degree: 353Doctorate degree: 163
Housing units in structures:
One, detached: 1,737One, attached: 3,929Two: 1013 or 4: 1275 to 9: 47110 to 19: 99920 to 49: 27650 or more: 82Housing units lacking complete kitchen facilities in 2022: 0.6%House/condo owner moved in on average 11 years ago
Renter moved in on average 3 years ago
Private vs. public school enrollment:
Students in private schools in grades 1 to 8 (elementary and middle school): 126 Students in private schools in grades 9 to 12 (high school): 93 Students in private undergraduate colleges: 278