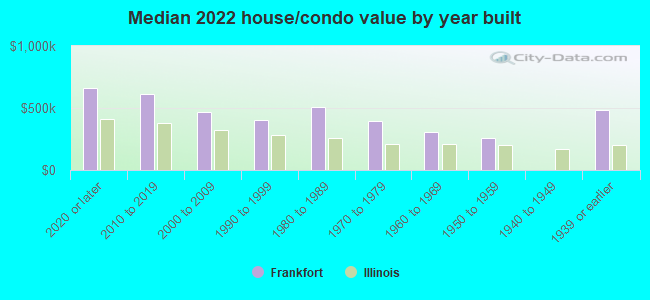
Frankfort, IL (Illinois) Houses and Residents
| Frankfort: | $465,461 |
| Illinois: | $251,600 |
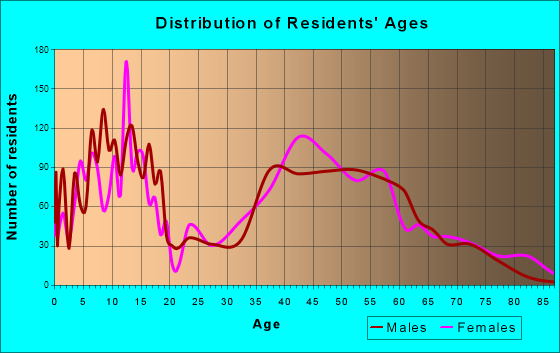
Total population: 18,446 (Urban population: 10,012, Rural population: 235 (26 farm, 209 nonfarm))
Houses: 6,990 (6,672 occupied: 6,321 owner occupied, 398 renter occupied)
| % of renters here: | 6% |
| State: | 33% |
Housing density: 641 houses/condos per square mile
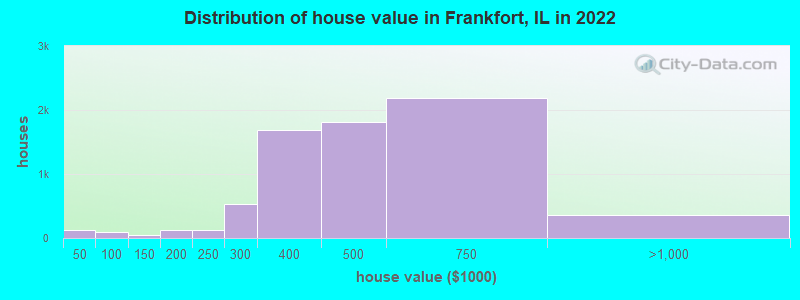
Median price asked for vacant for-sale houses and condos in 2022: $386,112.
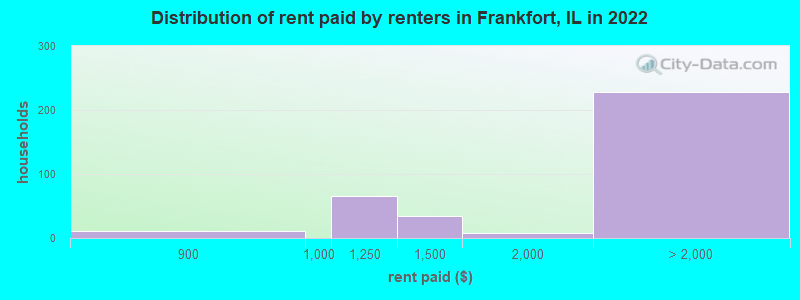
Median contract rent in 2022: over $2,000 (lower quartile is $1,226, upper quartile is over $2,000)
Median gross rent in Frankfort, IL in 2022: over $2,000
Housing units in Frankfort with a mortgage: 3,994 (431 second mortgage, 35 home equity loan, 356 both second mortgage and home equity loan)
Houses without a mortgage: 65
Median household income for houses/condos with a mortgage: $166,300
Median household income for apartments without a mortgage: $116,335
Median monthly housing costs: $2,341
Compare current foreclosures in Frankfort, IL:
| Photo | Address | Area | Beds / Baths | Price | Details |
|---|---|---|---|---|---|

|
#1
Stone Creek Blvd
Frankfort, IL 60423
|
- sq. feet
|
3 baths 4 beds |
show details | |

|
#2
S Butternut Cir
Frankfort, IL 60423
|
- sq. feet
|
- baths - beds |
show details | |

|
#3
S Foxfire Dr
Frankfort, IL 60423
|
- sq. feet
|
- baths - beds |
show details | |

|
#4
Oakfield Dr
Frankfort, IL 60423
|
- sq. feet
|
- baths - beds |
show details | |

|
#5
W Lincoln Hwy
Frankfort, IL 60423
|
- sq. feet
|
- baths - beds |
show details | |

|
#6
S Cobble Stone Ct
Frankfort, IL 60423
|
- sq. feet
|
- baths - beds |
show details | |

|
#7
S Glen Eagle Dr
Frankfort, IL 60423
|
- sq. feet
|
- baths - beds |
show details | |

|
#8
Delivery
Frankfort, IL 60423
|
- sq. feet
|
- baths - beds |
show details | |

|
#9
Nature Creek Cir
Frankfort, IL 60423
|
- sq. feet
|
- baths - beds |
show details | |

|
#10
La Costa Ln
Frankfort, IL 60423
|
- sq. feet
|
- baths - beds |
show details |
| Photo | Address | Area | Beds / Baths | Price | Details |
|---|---|---|---|---|---|

|
#11
Vail Dr
Frankfort, IL 60423
|
- sq. feet
|
- baths - beds |
show details | |

|
#12
W Evergreen Dr
Frankfort, IL 60423
|
- sq. feet
|
- baths - beds |
show details | |

|
#13
Woodland Ln
Frankfort, IL 60423
|
- sq. feet
|
- baths - beds |
show details | |

|
#14
W Juniper Ct
Frankfort, IL 60423
|
- sq. feet
|
- baths - beds |
show details | |

|
#15
Yorktown Rd
Frankfort, IL 60423
|
- sq. feet
|
- baths - beds |
show details | |

|
#16
W Chestnut Ct
Frankfort, IL 60423
|
- sq. feet
|
- baths - beds |
show details | |

|
#17
W Chestnut Ct
Frankfort, IL 60423
|
- sq. feet
|
- baths - beds |
show details | |

|
#18
Nebraska St
Frankfort, IL 60423
|
- sq. feet
|
- baths - beds |
show details | |

|
#19
S Fairwood Ct
Frankfort, IL 60423
|
- sq. feet
|
- baths - beds |
show details | |

|
#20
Old Frankfort Way Apt 206
Frankfort, IL 60423
|
- sq. feet
|
- baths - beds |
show details |
| Photo | Address | Area | Beds / Baths | Price | Details |
|---|---|---|---|---|---|

|
#21
W Norwood Dr
Frankfort, IL 60423
|
- sq. feet
|
- baths - beds |
show details | |

|
#22
S Oak Ln
Frankfort, IL 60423
|
- sq. feet
|
- baths - beds |
show details | |

|
#23
W Laurel Dr
Frankfort, IL 60423
|
- sq. feet
|
- baths - beds |
show details | |

|
#24
Wheatfield Dr
Frankfort, IL 60423
|
- sq. feet
|
- baths - beds |
show details | |

|
#25
Plank Trail Dr
Frankfort, IL 60423
|
- sq. feet
|
- baths - beds |
show details | |

|
#26
Franklin Ave
Frankfort, IL 60423
|
- sq. feet
|
- baths - beds |
show details | |

|
#27
S 79th Ave
Frankfort, IL 60423
|
- sq. feet
|
- baths - beds |
show details | |

|
#28
S 80th Ave
Frankfort, IL 60423
|
- sq. feet
|
- baths - beds |
show details | |

|
#29
Settlers Pond Dr
Frankfort, IL 60423
|
- sq. feet
|
- baths - beds |
show details | |

|
#30
S Spruce Dr
Frankfort, IL 60423
|
- sq. feet
|
- baths - beds |
show details |
| Photo | Address | Area | Beds / Baths | Price | Details |
|---|---|---|---|---|---|

|
#31
Chadwick Ct
Frankfort, IL 60423
|
- sq. feet
|
- baths - beds |
show details | |

|
#32
W Roeland Ct
Frankfort, IL 60423
|
- sq. feet
|
- baths - beds |
show details | |

|
#33
Rosemary Rd
Frankfort, IL 60423
|
- sq. feet
|
- baths - beds |
show details | |

|
#34
Oak St
Frankfort, IL 60423
|
- sq. feet
|
- baths - beds |
show details | |

|
#35
Lakeview Estates Blvd
Frankfort, IL 60423
|
- sq. feet
|
- baths - beds |
show details | |

|
#36
S 84th Ave
Frankfort, IL 60423
|
- sq. feet
|
- baths - beds |
show details | |

|
#37
Sara Springs Dr
Frankfort, IL 60423
|
- sq. feet
|
- baths - beds |
show details | |

|
#38
W Mathews Dr
Frankfort, IL 60423
|
- sq. feet
|
- baths - beds |
show details | |

|
Check over 1 million property listings on Foreclosure.com!
|
browse all offers | |||

Latest news about housing in Frankfort, IL collected exclusively by city-data.com from local newspapers, TV, and radio stations

 | Custom Build realistic option? (Frankfort, Manhattan, Mokena, New Lenox) (1 reply) |
| Moving to SW Chicago (5 replies) |
| Manhattan: 98% White? (39 replies) |
| Frankfort Square Question (6 replies) |
| New Lenox and Hartz Homes......thoughts (0 replies) |
| Medical professional working at Loyola hosp. needs advice regarding loctation and purchase vs. renting (155 replies) |
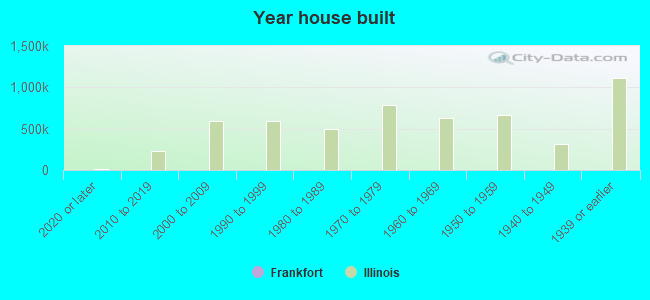
Median year apartment built: 1989
Household type by relationship:
Households: 20,259- Male householders: 3,500 (418 living alone), Female householders: 3,077 (541 living alone)
5,018 spouses (5,007 opposite-sex spouses), 185 unmarried partners, (165 opposite-sex unmarried partners), 7,628 children (7,218 natural, 195 adopted, 213 stepchildren), 218 grandchildren, 48 brothers or sisters, 287 parents, 0 foster children, 62 other relatives, 89 non-relatives
- In group quarters: 137
Size of family households: 2,278 2-persons, 916 3-persons, 1,516 4-persons, 750 5-persons, 104 6-persons, 42 7-or-more-persons.
Size of nonfamily households: 987 1-person, 48 2-persons, 18 3-persons.
4,791 married couples with children.
495 single-parent households (130 men, 365 women).
87.6% of residents of Frankfort speak English at home.
3.8% of residents speak Spanish at home (83% speak English very well, 15% speak English well, 2% speak English not well).
4.8% of residents speak other Indo-European language at home (83% speak English very well, 3% speak English well, 14% speak English not well).
1.2% of residents speak Asian or Pacific Island language at home (89% speak English very well, 11% speak English well).
2.5% of residents speak other language at home (93% speak English very well, 2% speak English well, 5% speak English not well).
Foreign born population: 1,574 (7.8%)
(79.9% of them are naturalized citizens)
| Here: | 8.2 |
| State: | 6.4 |
| Here: | 6.7 |
| State: | 4.1 |
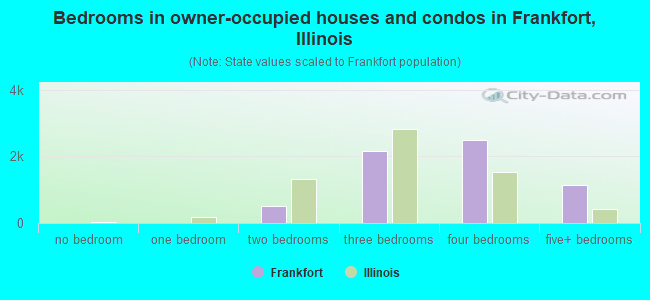
- Bedrooms in owner-occupied houses and condos in Frankfort, Illinois
- 0no bedroom
- 01 bedroom
- 5252 bedrooms
- 2,1523 bedrooms
- 2,4934 bedrooms
- 1,1515+ bedrooms
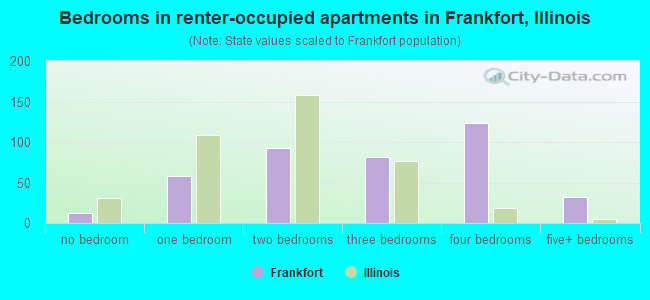
- Bedrooms in renter-occupied apartments in Frankfort, Illinois
- 12no bedroom
- 581 bedroom
- 932 bedrooms
- 813 bedrooms
- 1234 bedrooms
- 325+ bedrooms
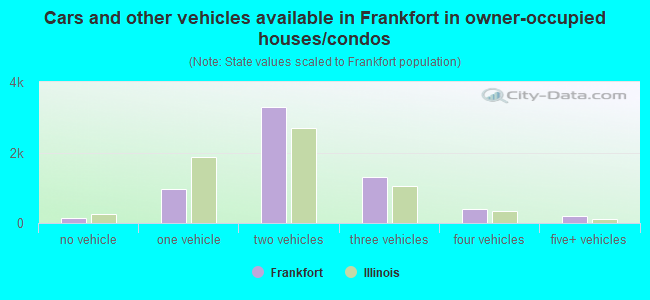
- Cars and other vehicles available in Frankfort in owner-occupied houses/condos
- 154no vehicle
- 9761 vehicle
- 3,2902 vehicles
- 1,3023 vehicles
- 4004 vehicles
- 1985+ vehicles
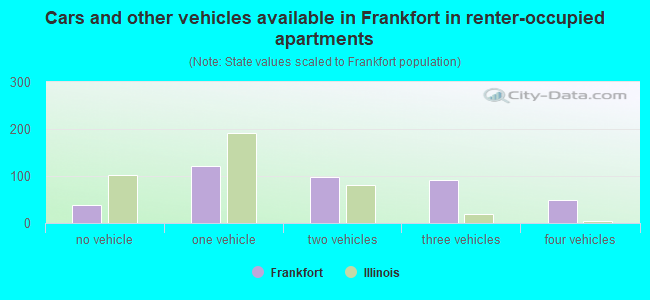
- Cars and other vehicles available in Frankfort in renter-occupied apartments
- 38no vehicle
- 1221 vehicle
- 982 vehicles
- 923 vehicles
- 494 vehicles
- 05+ vehicles
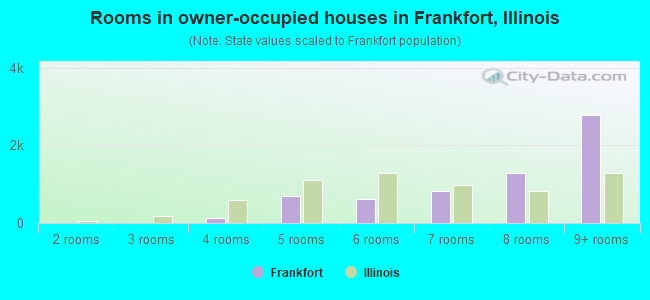
- Rooms in owner-occupied houses in Frankfort, Illinois
- 01 room
- 02 rooms
- 03 rooms
- 1224 rooms
- 6925 rooms
- 6206 rooms
- 8277 rooms
- 1,2808 rooms
- 2,7819+ rooms
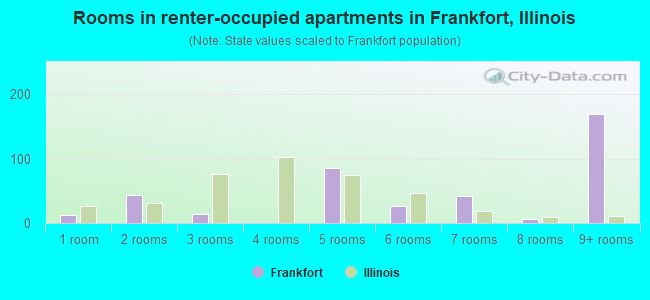
- Rooms in renter-occupied apartments in Frankfort, Illinois
- 121 room
- 442 rooms
- 143 rooms
- 04 rooms
- 865 rooms
- 266 rooms
- 427 rooms
- 68 rooms
- 1699+ rooms
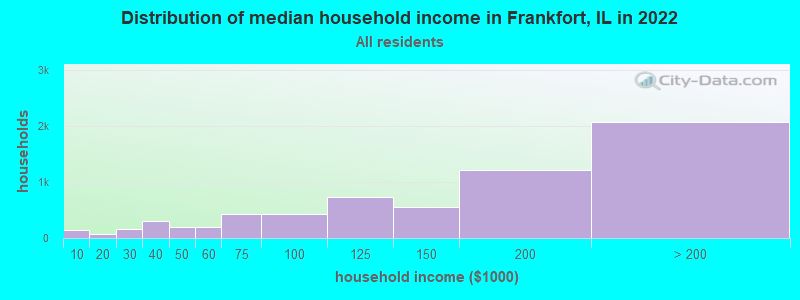
Frankfort, IL household income distribution

- 136Less than $10,000
- 67$10,000 to $19,999
- 164$20,000 to $29,999
- 300$30,000 to $39,999
- 205$40,000 to $49,999
- 199$50,000 to $59,999
- 427$60,000 to $74,999
- 429$75,000 to $99,999
- 730$100,000 to $124,999
- 560$125,000 to $149,999
- 1,210$150,000 to $199,999
- 2,071$200,000 or more
Home value of owner - occupied houses in 2022 in Frankfort, IL
-
- 64Less than $10,000
- 10$25,000 to $29,999
- 55$40,000 to $49,999
- 14$50,000 to $59,999
- 8$60,000 to $69,999
- 17$80,000 to $89,999
- 52$125,000 to $149,999
- 11$150,000 to $174,999
- 112$175,000 to $199,999
- 126$200,000 to $249,999
- 525$250,000 to $299,999
- 1,679$300,000 to $399,999
- 1,806$400,000 to $499,999
- 2,192$500,000 to $749,999
- 330$750,000 to $999,999
- 7$1,000,000 to $1,499,999
- 20$2,000,000 or more
Rent paid by renters in 2022 in Frankfort, IL
-
- 10$800 to $899
- 65$1,000 to $1,249
- 35$1,250 to $1,499
- 7$1,500 to $1,999
- 72$2,000 to $2,499
- 9$2,500 to $2,999
- 34$3,500 or more
- 111No cash rent
Percentage of workers working in this county: 53.5%
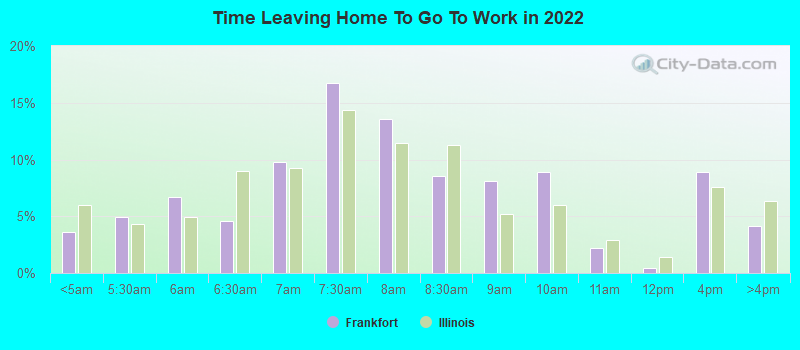
Number of people working at home: 2,410 (24.1% of all workers)
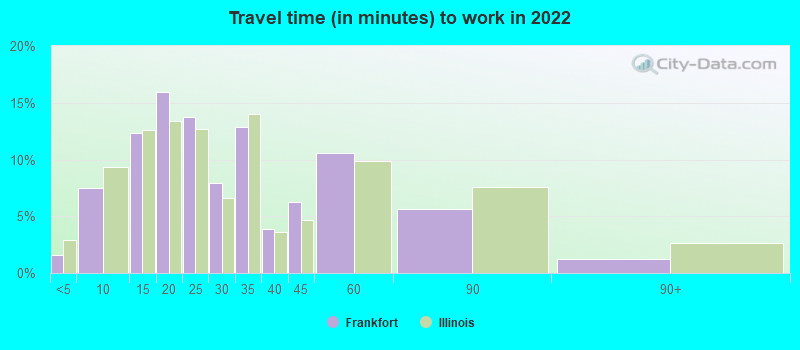
Travel time to work (commute)
- Less than 5 minutes: 116
- 5 to 9 minutes: 543
- 10 to 14 minutes: 548
- 15 to 19 minutes: 1,039
- 20 to 24 minutes: 695
- 25 to 29 minutes: 329
- 30 to 34 minutes: 1,322
- 35 to 39 minutes: 134
- 40 to 44 minutes: 605
- 45 to 59 minutes: 1,198
- 60 to 89 minutes: 1,046
- 90 or more minutes: 247
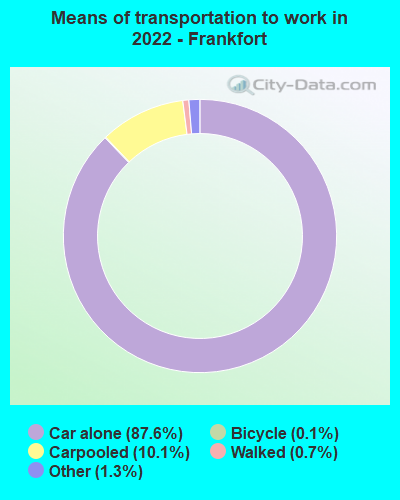
Means of transportation to work:
- Drove a car alone: 7,639 (69.5%)
- Carpooled: 890 (8.1%)
- Long-distance train or commuter rail: 2 (0.0%)
- Taxi: 120 (1.1%)
- Bicycle: 12 (0.1%)
- Walked: 51 (0.5%)
- Worked at home: 2,410 (21.9%)
- Unemployment by race in 2022
- Unemployment rate for White non-Hispanic residents
- 1.9%Males
- 2.7%Females
- Unemployment rate for Black residents
- 11.1%Males
- 1.7%Females
- Unemployment rate for two or more race residents
- 2.4%Males
- Unemployment rate for Hispanic or Latino residents
- 1.9%Males
- 3.3%Females
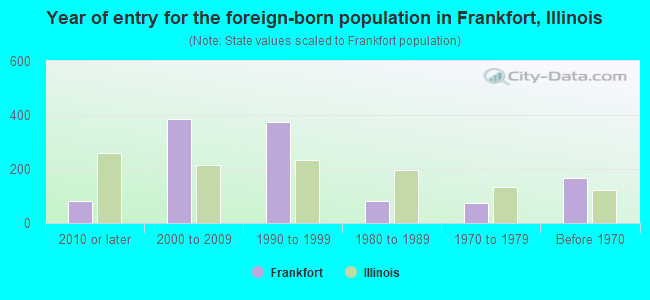
- Year of entry for the foreign-born population in Frankfort, Illinois
- 822010 or later
- 3842000 to 2009
- 3741990 to 1999
- 811980 to 1989
- 731970 to 1979
- 166Before 1970
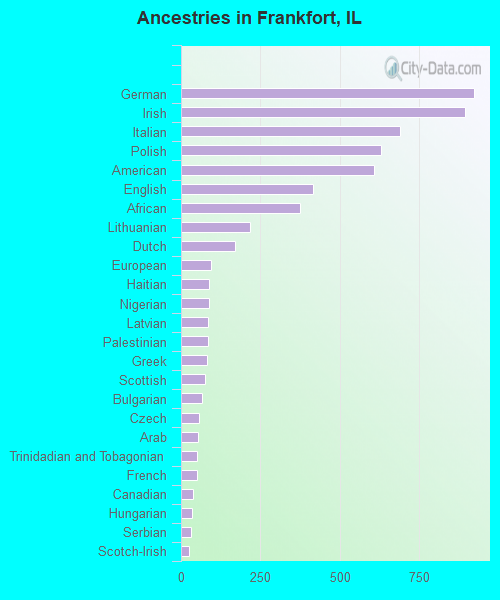
First ancestries reported:
- German: 923 (10.6%)
- Irish: 894 (10.3%)
- Italian: 690 (7.9%)
- Polish: 629 (7.2%)
- American: 606 (7.0%)
- English: 416 (4.8%)
- African: 373 (4.3%)
- Lithuanian: 216 (2.5%)
- Dutch: 171 (2.0%)
- European: 93 (1.1%)
- Haitian: 89 (1.0%)
- Nigerian: 87 (1.0%)
- Latvian: 86 (1.0%)
- Palestinian: 85 (1.0%)
- Greek: 81 (0.9%)
- Scottish: 74 (0.8%)
- Bulgarian: 67 (0.8%)
- Czech: 56 (0.6%)
- Arab: 53 (0.6%)
- Trinidadian and Tobagonian: 51 (0.6%)
- French: 50 (0.6%)
- Canadian: 39 (0.4%)
- Hungarian: 35 (0.4%)
- Serbian: 33 (0.4%)
- Scotch-Irish: 25 (0.3%)
- Swiss: 22 (0.3%)
- Northern European: 20 (0.2%)
- Russian: 20 (0.2%)
- Australian: 19 (0.2%)
- Swedish: 19 (0.2%)
- Danish: 17 (0.2%)
- Slovene: 17 (0.2%)
- Croatian: 15 (0.2%)
- Romanian: 13 (0.1%)
- Scandinavian: 10 (0.1%)
- Czechoslovakian: 8 (0.09%)
- Slovak: 4 (0.05%)
Most common places of birth for foreign-born residents (%):
| Frankfort: | 17.8% (255) |
| Illinois: | 34.7% (626,958) |
| Frankfort: | 12.3% (176) |
| Illinois: | 1.2% (21,186) |
| Frankfort: | 9.1% (130) |
| Illinois: | 5.2% (93,003) |
| Frankfort: | 8.6% (123) |
| Illinois: | 9.2% (166,409) |
| Frankfort: | 6.5% (93) |
| Illinois: | 1.1% (19,306) |
| Frankfort: | 5.3% (76) |
| Illinois: | 6.9% (124,474) |
| Frankfort: | 5.0% (72) |
| Illinois: | 0.3% (4,533) |
| Frankfort: | 4.5% (65) |
| Illinois: | 0.4% (6,611) |
| Frankfort: | 4.5% (65) |
| Illinois: | 0.9% (15,679) |
| Frankfort: | 4.3% (62) |
| Illinois: | 0.8% (14,165) |
| Frankfort: | 4.0% (58) |
| Illinois: | 0.1% (1,224) |
| Frankfort: | 3.6% (52) |
| Illinois: | 2.2% (40,393) |
| Frankfort: | 2.2% (32) |
| Illinois: | 0.1% (1,432) |
| Frankfort: | 2.0% (29) |
| Illinois: | 4.1% (74,364) |
| Frankfort: | 1.9% (27) |
| Illinois: | 1.0% (18,753) |
| Frankfort: | 1.9% (27) |
| Illinois: | 0.9% (16,553) |
| Frankfort: | 1.7% (25) |
| Illinois: | 0.6% (10,720) |
| Frankfort: | 1.6% (23) |
| Illinois: | 0.4% (7,117) |
| Frankfort: | 1.5% (22) |
| Illinois: | 0.6% (10,249) |
Place of birth for U.S.-born residents:
- This state: 14,963
- Other state: 3,396
- Northeast: 322
- Midwest: 1,854
- South: 853
- West: 248
91.7% of Frankfort residents lived in the same house 1 years ago.
Out of people who lived in different houses, 39.5% lived in this county.
Out of people who lived in different counties, 36.9% lived in Illinois.
| Frankfort: | 91.7% |
| State average: | 88.3% |
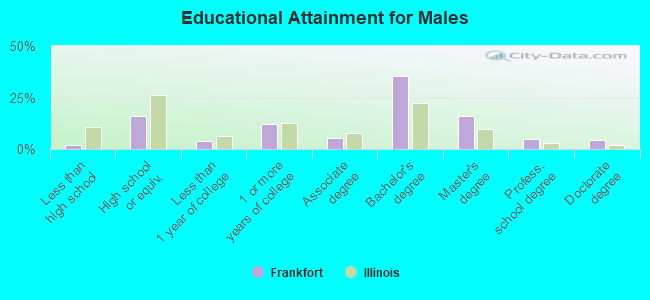
Education attainment for males 25 years and older:
- No schooling: 11
- Nursery to 4th grade: 0
- 5th and 6th grade: 45
- 7th and 8th grade: 22
- 9th grade: 14
- 10th grade: 0
- 11th grade: 13
- 12th grade, no diploma: 33
- High school graduate (or equivalency): 1,070
- Less than 1 year of college: 264
- Some college more than 1 year, no degree: 822
- Associate degree: 348
- Bachelor's degree: 2,350
- Master's degree: 1,050
- Professional school degree: 323
- Doctorate degree: 287
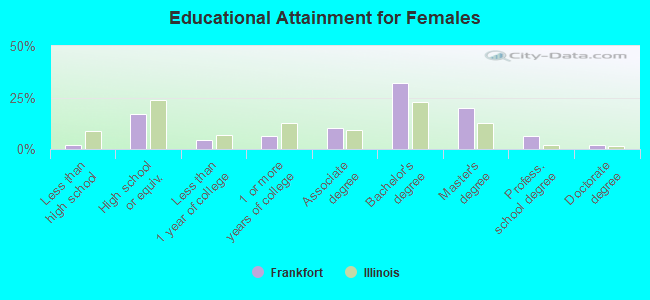
Education attainment for females 25 years and older:
- No schooling: 0
- Nursery to 4th grade: 70
- 5th and 6th grade: 0
- 7th and 8th grade: 0
- 9th grade: 0
- 10th grade: 5
- 11th grade: 26
- 12th grade, no diploma: 23
- High school graduate (or equivalency): 1,138
- Less than 1 year of college: 306
- Some college more than 1 year, no degree: 431
- Associate degree: 684
- Bachelor's degree: 2,186
- Master's degree: 1,349
- Professional school degree: 443
- Doctorate degree: 116
Housing units in structures:
- One, detached: 5,637
- One, attached: 1,087
- Two: 34
- 3 or 4: 96
- 5 to 9: 61
- 10 to 19: 28
- 20 to 49: 11
- Mobile homes: 33
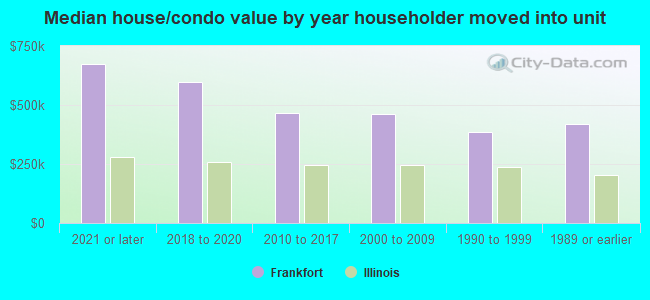
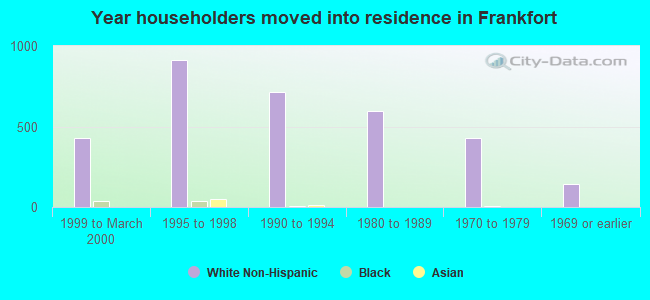
House/condo owner moved in on average 10 years ago
Renter moved in on average 5 years ago
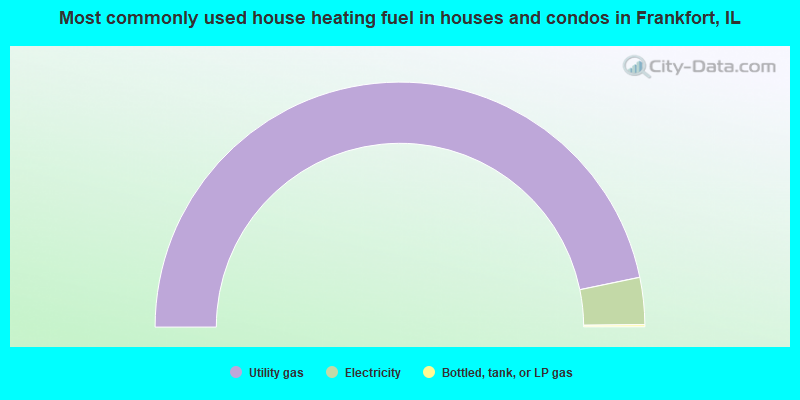
- 93.6%Utility gas
- 6.2%Electricity
- 0.3%Bottled, tank, or LP gas
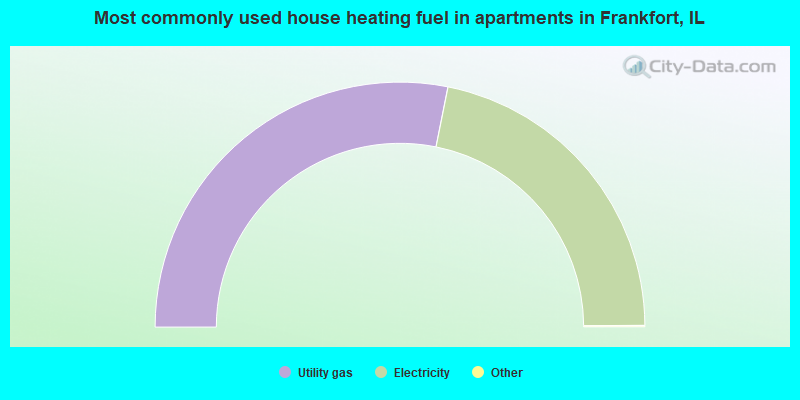
- 56.4%Utility gas
- 43.6%Electricity
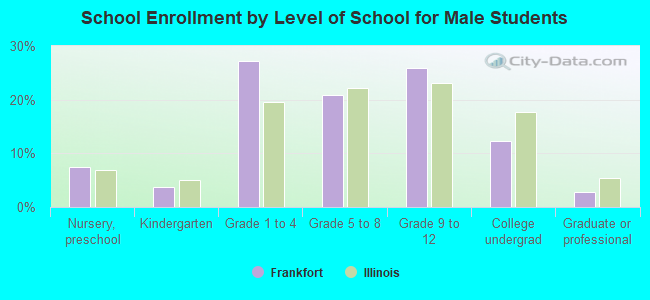
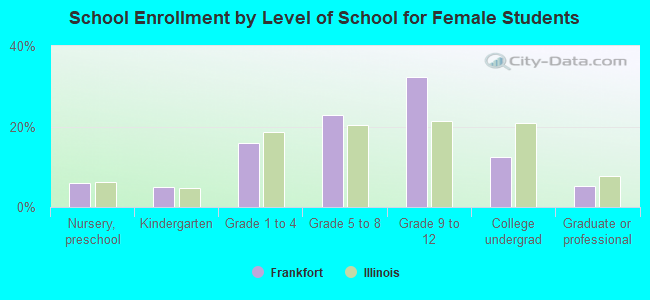
Private vs. public school enrollment:
| Here: | 7.5% |
| Illinois: | 13.3% |
| Here: | 9.0% |
| Illinois: | 9.9% |
| Here: | 22.0% |
| Illinois: | 27.4% |