Franklin, PA (Pennsylvania) Houses and Residents
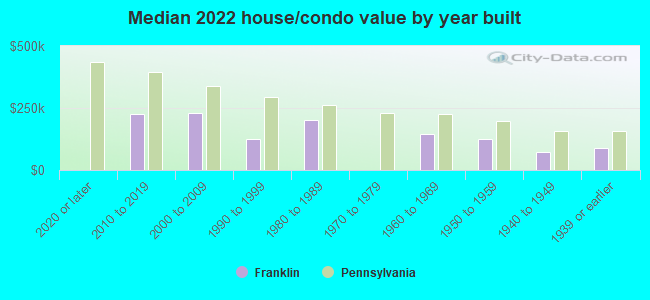
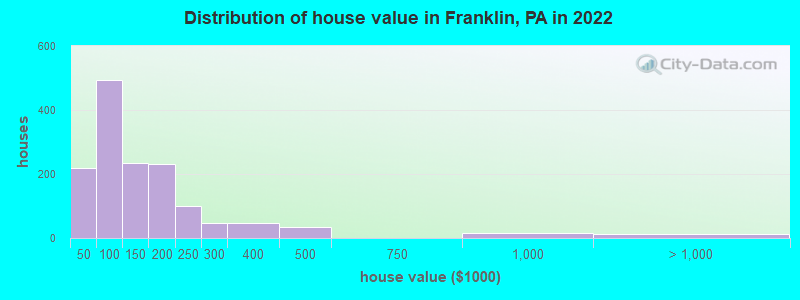
Estimated median house or condo value in 2022: $113,959 (it was $48,000 in 2000 )
Franklin:
$113,959Pennsylvania:
$245,500
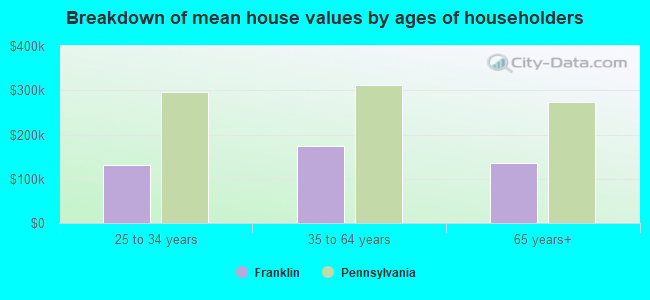
Lower value quartile - upper value quartile: $64,643 - $185,803Mean price in 2022: Detached houses: $113,777 Here:
$113,777State:
$317,202
Townhouses or other attached units: $148,176 Here:
$148,176State:
$254,369
In 2-unit structures: $41,423 Here:
$41,423State:
$249,182
Mobile homes: $21,361 Here:
$21,361State:
$92,414
Total population: 6,350 (All urban)
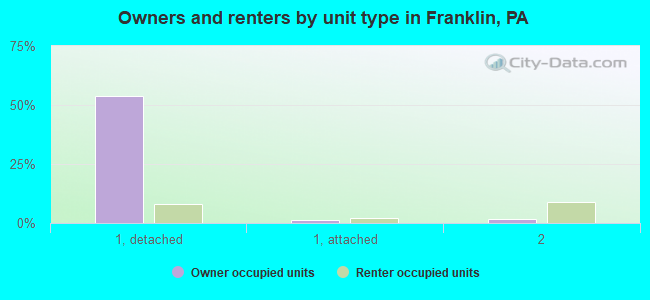
Houses: 3,054 (2,704 occupied: 1,507 owner occupied, 1,220 renter occupied )
% of renters here:
45%State:
31%
Housing density: 661 houses/condos per square mile
Median price asked for vacant for-sale houses and condos in 2022: $191,261.
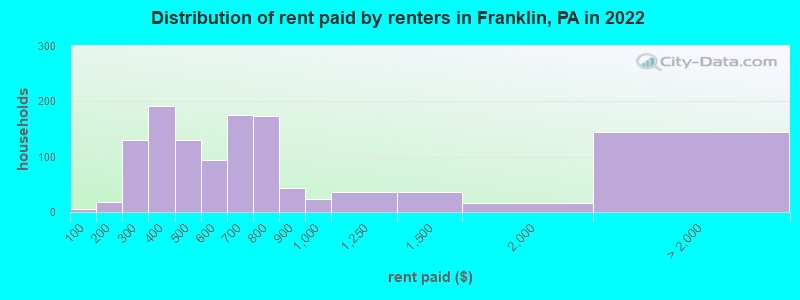
Median contract rent in 2022: $580 (lower quartile is $362, upper quartile is $755)
Median rent asked for vacant for-rent units in 2022: $544
Median gross rent in Franklin, PA in 2022: $695
Housing units in Franklin with a mortgage: 824 (53 second mortgage, 8 home equity loan, 32 both second mortgage and home equity loan )Houses without a mortgage: 48
Median household income for houses/condos with a mortgage: $87,581
Median household income for apartments without a mortgage: $59,307
Median monthly housing costs: $747
Data:
Median house or condo value ($)
Median house or condo value ($ change since 2000)
Median house or condo value ($) - White
Median house or condo value ($) - Black or African American
Median house or condo value ($) - Asian
Median house or condo value ($) - Hispanic or Latino
Median house or condo value ($) - American Indian and Alaska Native
Median house or condo value ($) - Multirace
Median house or condo value ($) - Other Race
Median price asked for mobile homes ($)
Household density (households per square mile)
Mean house or condo value by units in structure - 1, detached ($)
Mean house or condo value by units in structure - 1, attached ($)
Mean house or condo value by units in structure - 2 ($)
Mean house or condo value by units in structure by units in structure - 3 or 4 ($)
Mean house or condo value by units in structure - 5 or more ($)
Mean house or condo value by units in structure - Boat, RV, van, etc. ($)
Mean house or condo value by units in structure - Mobile home ($)
Median contract rent ($)
Median contract rent - Lower quartile ($)
Median contract rent - Upper quartile ($)
Median gross rent ($)
Urban houses (%)
Rural houses (%)
Houses occupied (%)
Houses occupied (% change since 2000)
Houses owner occupied (%)
Houses owner occupied (% change since 2000)
Houses renter occupied (%)
Houses renter occupied (% change since 2000)
Vacant housing units - For rent (%)
Vacant housing units - For rent (% change since 2000)
Vacant housing units - For sale only (%)
Vacant housing units - For sale only (% change since 2000)
Vacant housing units - Rented or sold, not occupied (%)
Vacant housing units - Rented or sold, not occupied (% change since 2000)
Vacant housing units - For seasonal, recreational, or occasional use (%)
Vacant housing units - For seasonal, recreational, or occasional use (% change since 2000)
Vacant housing units - For migrant workers (%)
Vacant housing units - For migrant workers (% change since 2000)
Vacant housing units - Other vacant (%)
Vacant housing units - Other vacant (% change since 2000)
Median monthly housing costs ($)
Median household income for houses/condos with a mortgage ($)
Median household income for houses/condos without a mortgage ($)
Median household income ($)
Median household income ($) - White
Median household income ($) - Black or African American
Median household income ($) - Asian
Median household income ($) - Hispanic or Latino
Median household income ($) - American Indian and Alaska Native
Median household income ($) - Multirace
Median household income ($) - Other Race
Mortgage status - with mortgage (%)
Mortgage status - with second mortgage (%)
Mortgage status - with home equity loan (%)
Mortgage status - with both second mortgage and home equity loan (%)
Mortgage status - without a mortgage (%)
Median year house/condo built
Median year apartment built
Household type by relationship - Male householder living alone (%)
Household type by relationship - Male householder not living alone (%)
Household type by relationship - Female householder living alone (%)
Household type by relationship - Female householder not living alone (%)
Household type by relationship - Opposite-Sex spouse (%)
Household type by relationship - Same-Sex spouse (%)
Household type by relationship - Opposite-Sex unmarried partner (%)
Household type by relationship - Same-Sex unmarried partner (%)
Household type by relationship - In group quarters (%)
Size of family households - 2-person household (%)
Size of family households - 3-person household (%)
Size of family households - 4-person household (%)
Size of family households - 5-person household (%)
Size of family households - 6-person household (%)
Size of family households - 7-or-more-person household (%)
Size of nonfamily households - 1-person household (%)
Size of nonfamily households - 2-person household (%)
Size of nonfamily households - 3-person household (%)
Size of nonfamily households - 4-person household (%)
Size of nonfamily households - 5-person household (%)
Size of nonfamily households - 6-person household (%)
Size of nonfamily households - 7-or-moreperson household (%)
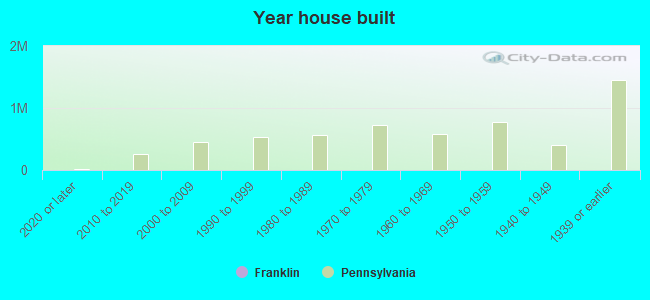
Year house built - Built 2010 or later (%)
Year house built - Built 2000 to 2009 (%)
Year house built - Built 1990 to 1999 (%)
Year house built - Built 1980 to 1989 (%)
Year house built - Built 1970 to 1979 (%)
Year house built - Built 1960 to 1969 (%)
Year house built - Built 1950 to 1959 (%)
Year house built - Built 1940 to 1949 (%)
Year house built - Built 1939 or earlier (%)
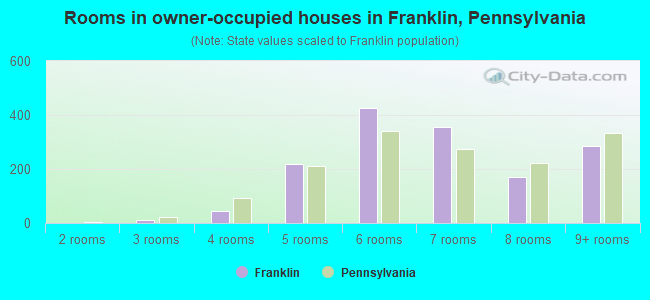
Median number of rooms in houses and condos
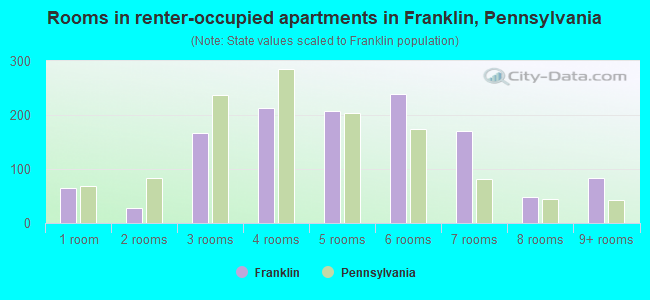
Median number of rooms in apartments
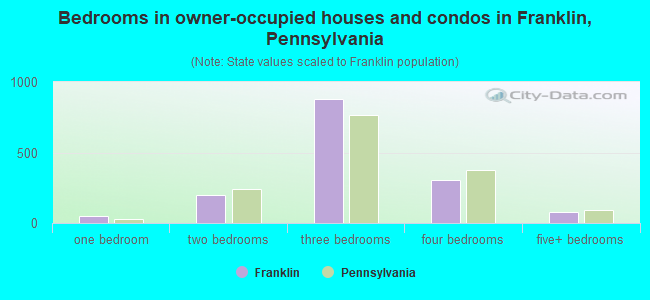
Median number of bedrooms in owner occupied houses
Mean number of bedrooms in owner occupied houses
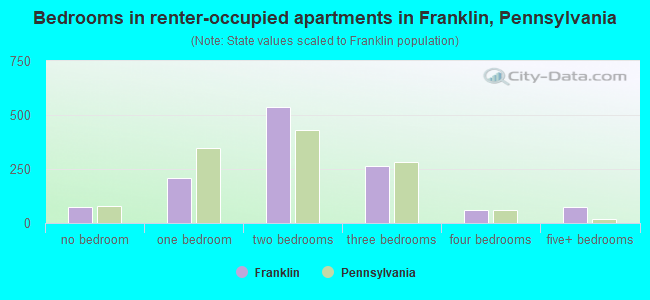
Median number of bedrooms in renter occupied houses
Mean number of bedrooms in renter occupied houses
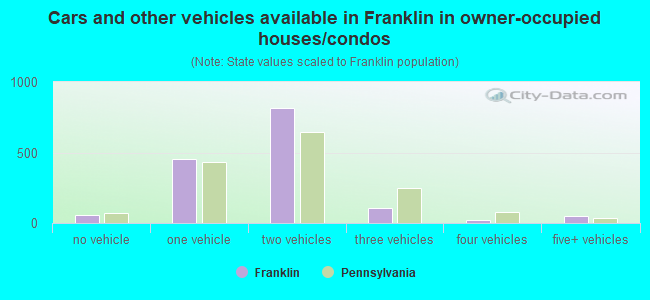
Median number of vehichles in owner occupied houses
Mean number of vehichles in owner occupied houses
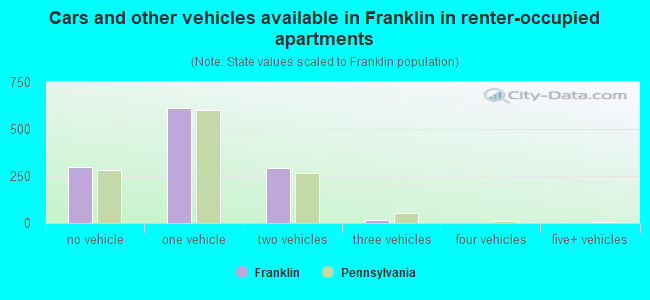
Median number of vehichles in renter occupied houses
Mean number of vehichles in renter occupied houses
Rooms in owner-occupied houses - 1 room (%)
Rooms in owner-occupied houses - 2 rooms (%)
Rooms in owner-occupied houses - 3 rooms (%)
Rooms in owner-occupied houses - 4 rooms (%)
Rooms in owner-occupied houses - 5 rooms (%)
Rooms in owner-occupied houses - 6 rooms (%)
Rooms in owner-occupied houses - 7 rooms (%)
Rooms in owner-occupied houses - 8 rooms (%)
Rooms in owner-occupied houses - 9+ rooms (%)
Rooms in renter-occupied houses - 1 room (%)
Rooms in renter-occupied houses - 2 rooms (%)
Rooms in renter-occupied houses - 3 rooms (%)
Rooms in renter-occupied houses - 4 rooms (%)
Rooms in renter-occupied houses - 5 rooms (%)
Rooms in renter-occupied houses - 6 rooms (%)
Rooms in renter-occupied houses - 7 rooms (%)
Rooms in renter-occupied houses - 8 rooms (%)
Rooms in renter-occupied houses - 9+ rooms (%)
Bedrooms in owner-occupied houses - no bedrooms (%)
Bedrooms in owner-occupied houses - 1 bedroom (%)
Bedrooms in owner-occupied houses - 2 bedrooms (%)
Bedrooms in owner-occupied houses - 3 bedrooms (%)
Bedrooms in owner-occupied houses - 4 bedrooms (%)
Bedrooms in owner-occupied houses - 5+ bedrooms (%)
Bedrooms in renter-occupied houses - no bedrooms (%)
Bedrooms in renter-occupied houses - 1 bedroom (%)
Bedrooms in renter-occupied houses - 2 bedrooms (%)
Bedrooms in renter-occupied houses - 3 bedrooms (%)
Bedrooms in renter-occupied houses - 4 bedrooms (%)
Bedrooms in renter-occupied houses - 5+ bedrooms (%)
Vehicles available in owner-occupied houses - no vehicle available (%)
Vehicles available in owner-occupied houses - 1 vehicle available(%)
Vehicles available in owner-occupied houses - 2 Vehicles available (%)
Vehicles available in owner-occupied houses - 3 Vehicles available (%)
Vehicles available in owner-occupied houses - 4 Vehicles available (%)
Vehicles available in owner-occupied houses - 5+ Vehicles available (%)
Vehicles available in renter-occupied houses - no vehicle available (%)
Vehicles available in renter-occupied houses - 1 vehicle available (%)
Vehicles available in renter-occupied houses - 2 Vehicles available (%)
Vehicles available in renter-occupied houses - 3 Vehicles available (%)
Vehicles available in renter-occupied houses - 4 Vehicles available (%)
Vehicles available in renter-occupied houses - 5+ Vehicles available (%)
Housing units in structures - 1, detached (%)
Housing units in structures - 1, attached (%)
Housing units in structures - 2 (%)
Housing units in structures - 3 or 4 (%)
Housing units in structures - 5 to 9 (%)
Housing units in structures - 10 to 19 (%)
Housing units in structures - 20 to 49 (%)
Housing units in structures - 50 or more (%)
Housing units in structures - Mobile home (%)
Housing units in structures - Boat, RV, van, etc. (%)
Housing units in structures - Owners - 1, detached (%)
Housing units in structures - Owners - 1, attached (%)
Housing units in structures - Owners - 2 (%)
Housing units in structures - Owners - 3 or 4 (%)
Housing units in structures - Owners - 5 to 9 (%)
Housing units in structures - Owners - 10 to 19 (%)
Housing units in structures - Owners - 20 to 49 (%)
Housing units in structures - Owners - 50 or more (%)
Housing units in structures - Owners - Mobile home (%)
Housing units in structures - Owners - Boat, RV, van, etc. (%)
Housing units in structures - Renters - 1, detached (%)
Housing units in structures - Renters - 1, attached (%)
Housing units in structures - Renters - 2 (%)
Housing units in structures - Renters - 3 or 4 (%)
Housing units in structures - Renters - 5 to 9 (%)
Housing units in structures - Renters - 10 to 19 (%)
Housing units in structures - Renters - 20 to 49 (%)
Housing units in structures - Renters - 50 or more (%)
Housing units in structures - Renters - Mobile home (%)
Housing units in structures - Renters - Boat, RV, van, etc. (%)
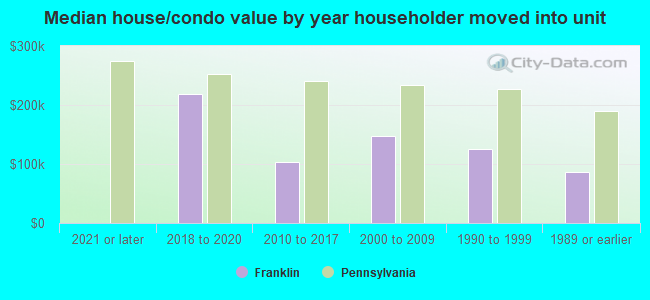
House/condo owner moved in on average (years ago)
Renter moved in on average (years ago)
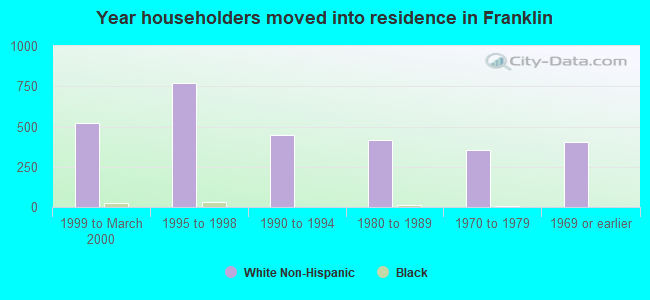
Year householder moved into unit - Moved in 1999 to March 2000 (%)
Year householder moved into unit - Moved in 1999 to March 2000 (%) - White
Year householder moved into unit - Moved in 1999 to March 2000 (%) - Black or African American
Year householder moved into unit - Moved in 1999 to March 2000 (%) - Asian
Year householder moved into unit - Moved in 1999 to March 2000 (%) - Hispanic or Latino
Year householder moved into unit - Moved in 1999 to March 2000 (%) - American Indian and Alaska Native
Year householder moved into unit - Moved in 1999 to March 2000 (%) - Multirace
Year householder moved into unit - Moved in 1999 to March 2000 (%) - Other Race
Year householder moved into unit - Moved in 1995 to 1998 (%)
Year householder moved into unit - Moved in 1995 to 1998 (%) - White
Year householder moved into unit - Moved in 1995 to 1998 (%) - Black or African American
Year householder moved into unit - Moved in 1995 to 1998 (%) - Asian
Year householder moved into unit - Moved in 1995 to 1998 (%) - Hispanic or Latino
Year householder moved into unit - Moved in 1995 to 1998 (%) - American Indian and Alaska Native
Year householder moved into unit - Moved in 1995 to 1998 (%) - Multirace
Year householder moved into unit - Moved in 1995 to 1998 (%) - Other Race
Year householder moved into unit - Moved in 1990 to 1994 (%)
Year householder moved into unit - Moved in 1990 to 1994 (%) - White
Year householder moved into unit - Moved in 1990 to 1994 (%) - Black or African American
Year householder moved into unit - Moved in 1990 to 1994 (%) - Asian
Year householder moved into unit - Moved in 1990 to 1994 (%) - Hispanic or Latino
Year householder moved into unit - Moved in 1990 to 1994 (%) - American Indian and Alaska Native
Year householder moved into unit - Moved in 1990 to 1994 (%) - Multirace
Year householder moved into unit - Moved in 1990 to 1994 (%) - Other Race
Year householder moved into unit - Moved in 1980 to 1989 (%)
Year householder moved into unit - Moved in 1980 to 1989 (%) - White
Year householder moved into unit - Moved in 1980 to 1989 (%) - Black or African American
Year householder moved into unit - Moved in 1980 to 1989 (%) - Asian
Year householder moved into unit - Moved in 1980 to 1989 (%) - Hispanic or Latino
Year householder moved into unit - Moved in 1980 to 1989 (%) - American Indian and Alaska Native
Year householder moved into unit - Moved in 1980 to 1989 (%) - Multirace
Year householder moved into unit - Moved in 1980 to 1989 (%) - Other Race
Year householder moved into unit - Moved in 1970 to 1979 (%)
Year householder moved into unit - Moved in 1970 to 1979 (%) - White
Year householder moved into unit - Moved in 1970 to 1979 (%) - Black or African American
Year householder moved into unit - Moved in 1970 to 1979 (%) - Asian
Year householder moved into unit - Moved in 1970 to 1979 (%) - Hispanic or Latino
Year householder moved into unit - Moved in 1970 to 1979 (%) - American Indian and Alaska Native
Year householder moved into unit - Moved in 1970 to 1979 (%) - Multirace
Year householder moved into unit - Moved in 1970 to 1979 (%) - Other Race
Year householder moved into unit - Moved in 1969 or earlier (%)
Year householder moved into unit - Moved in 1969 or earlier (%) - White
Year householder moved into unit - Moved in 1969 or earlier (%) - Black or African American
Year householder moved into unit - Moved in 1969 or earlier (%) - Asian
Year householder moved into unit - Moved in 1969 or earlier (%) - Hispanic or Latino
Year householder moved into unit - Moved in 1969 or earlier (%) - American Indian and Alaska Native
Year householder moved into unit - Moved in 1969 or earlier (%) - Multirace
Year householder moved into unit - Moved in 1969 or earlier (%) - Other Race
Housing units lacking complete plumbing facilities (%)
Housing units lacking complete kitchen facilities (%)
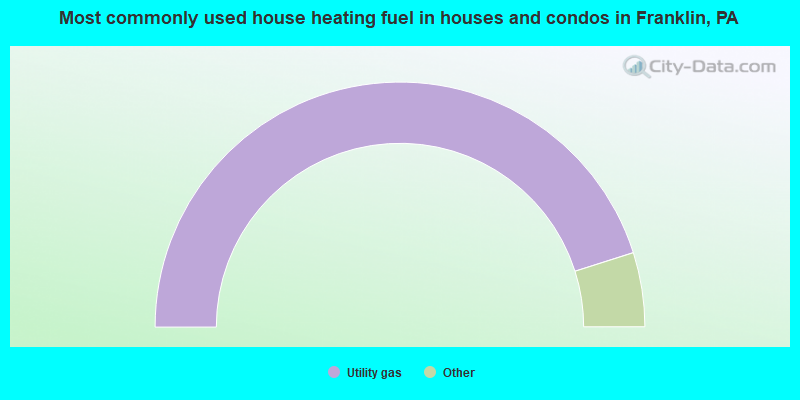
House heating fuel used in houses and condos - Utility gas (%)
House heating fuel used in houses and condos - Bottled, tank, or LP gas (%)
House heating fuel used in houses and condos - Electricity (%)
House heating fuel used in houses and condos - Fuel oil, kerosene, etc. (%)
House heating fuel used in houses and condos - Coal or coke (%)
House heating fuel used in houses and condos - Wood (%)
House heating fuel used in houses and condos - Solar energy (%)
House heating fuel used in houses and condos - Other fuel (%)
House heating fuel used in houses and condos - No fuel used (%)
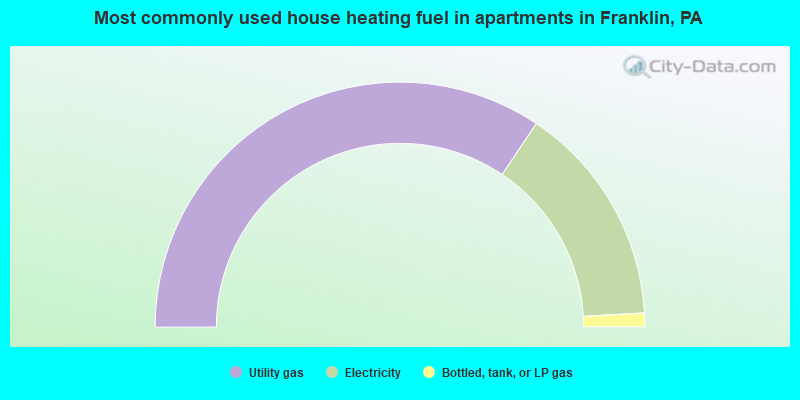
House heating fuel used in apartments - Utility gas (%)
House heating fuel used in apartments - Bottled, tank, or LP gas (%)
House heating fuel used in apartments - Electricity (%)
House heating fuel used in apartments - Fuel oil, kerosene, etc. (%)
House heating fuel used in apartments - Coal or coke (%)
House heating fuel used in apartments - Wood (%)
House heating fuel used in apartments - Solar energy (%)
House heating fuel used in apartments - Other fuel (%)
House heating fuel used in apartments - No fuel used (%)
Latest news about housing in Franklin, PA collected exclusively by city-data.com from local newspapers, TV, and radio stations
Median year house/condo built: 1938Median year apartment built: 1947Household type by relationship:
Households: 6,057
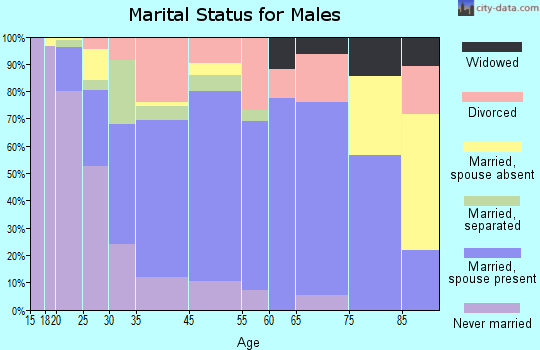
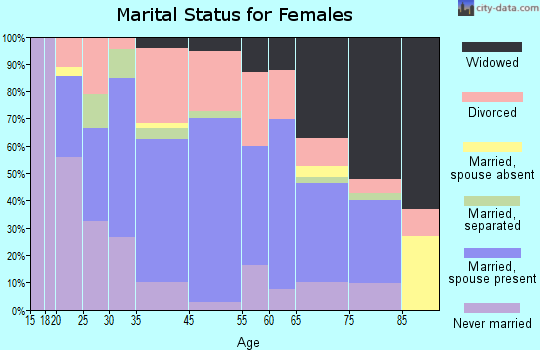
Male householders: 1,183 (258 living alone ), Female householders: 1,489 (584 living alone )1,061 spouses (1,032 opposite-sex spouses ), 163 unmarried partners , (123 opposite-sex unmarried partners ), 1,596 children (1,537 natural , 6 adopted , 51 stepchildren ), 36 grandchildren , 11 brothers or sisters , 28 parents , 0 foster children , 93 other relatives , 157 non-relatives In group quarters: 233
Size of family households: 896 2-persons , 426 3-persons , 216 4-persons , 68 5-persons , 14 6-persons , 43 7-or-more-persons .
Size of nonfamily households: 870 1-person , 198 2-persons .
571 married couples with children. single-parent households (187 men , 310 women ).
98.0% of residents of Franklin speak English at home. of residents speak Spanish at home (73% speak English very well , 15% speak English well , 6% speak English not well , 6% don't speak English at all ).of residents speak other Indo-European language at home (93% speak English very well , 7% speak English well ).
Foreign born population: 18 (0.3%)of them are naturalized citizens )
Median number of rooms in houses and condos:
Median number of rooms in apartments
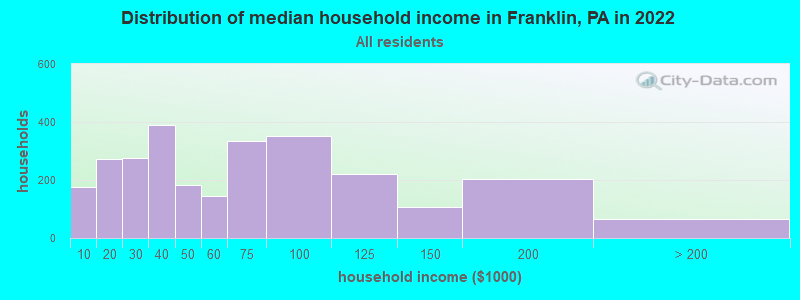
Franklin, PA household income distribution 177 Less than $10,000274 $10,000 to $19,999277 $20,000 to $29,999391 $30,000 to $39,999183 $40,000 to $49,999144 $50,000 to $59,999336 $60,000 to $74,999352 $75,000 to $99,999221 $100,000 to $124,999106 $125,000 to $149,999204 $150,000 to $199,99965 $200,000 or more
Home value of owner - occupied houses in 2022 in Franklin, PA 33 Less than $10,00023 $10,000 to $14,99919 $20,000 to $24,99916 $25,000 to $29,99919 $30,000 to $34,99942 $35,000 to $39,99963 $40,000 to $49,999137 $50,000 to $59,99968 $60,000 to $69,99993 $70,000 to $79,99952 $80,000 to $89,99977 $90,000 to $99,999123 $100,000 to $124,999108 $125,000 to $149,999127 $150,000 to $174,999103 $175,000 to $199,999101 $200,000 to $249,99945 $250,000 to $299,99945 $300,000 to $399,99933 $400,000 to $499,99917 $750,000 to $999,9997 $1,000,000 to $1,499,9996 $2,000,000 or moreRent paid by renters in 2022 in Franklin, PA 4 Less than $1001 $100 to $14916 $150 to $19960 $200 to $24969 $250 to $29988 $300 to $349103 $350 to $399105 $400 to $44924 $450 to $49943 $500 to $54950 $550 to $59933 $600 to $649142 $650 to $699111 $700 to $74961 $750 to $79944 $800 to $89923 $900 to $99936 $1,000 to $1,24937 $1,250 to $1,49916 $1,500 to $1,9994 $3,500 or more141 No cash rent
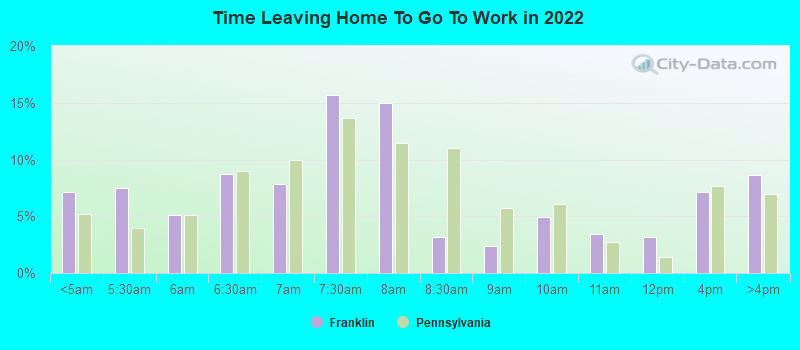
Percentage of workers working in this county: 85.6%Number of people working at home: 485 (18.0% of all workers )
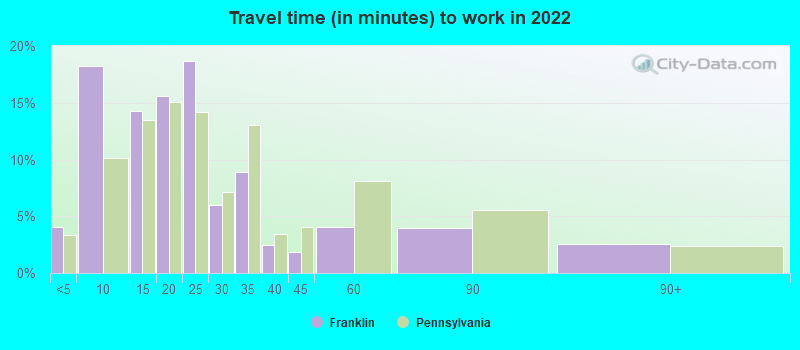
Travel time to work (commute)
Less than 5 minutes: 1265 to 9 minutes: 57910 to 14 minutes: 45715 to 19 minutes: 35120 to 24 minutes: 18225 to 29 minutes: 8730 to 34 minutes: 8035 to 39 minutes: 4640 to 44 minutes: 8245 to 59 minutes: 3860 to 89 minutes: 17990 or more minutes: 27
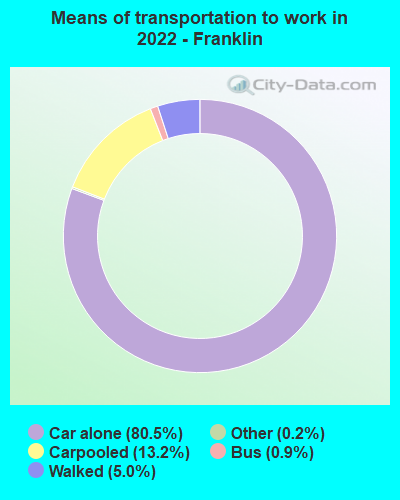
Means of transportation to work:
Drove a car alone: 3,159 (71.3%)Carpooled: 517 (11.7%)Bus : 29 (0.7%)Taxi: 11 (0.2%)Walked: 199 (4.5%)Worked at home: 485 (10.9%)
Unemployment by race in 2022
Unemployment rate for White non-Hispanic residents 4.9% Males3.8% FemalesUnemployment rate for Black residents 34.9% Males23.5% FemalesUnemployment rate for two or more race residents 16.6% Males
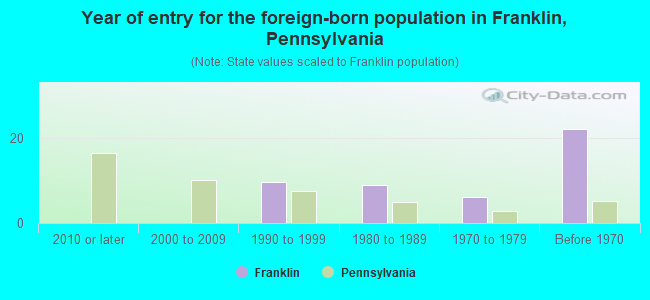
Year of entry for the foreign-born population in Franklin, Pennsylvania
0 2010 or later 0 2000 to 2009 10 1990 to 1999 9 1980 to 1989 6 1970 to 1979 22 Before 1970
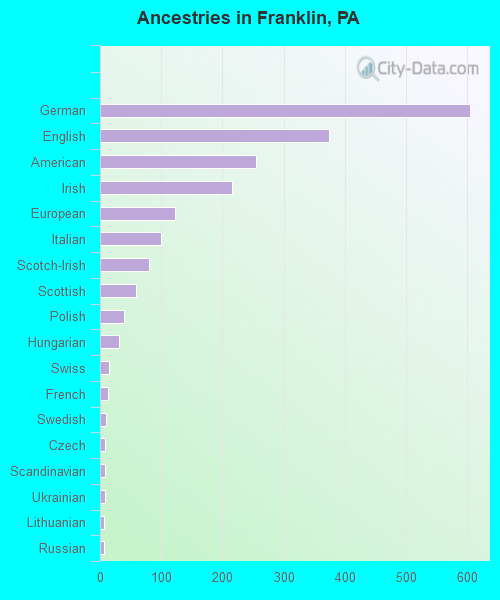
First ancestries reported:
German: 605 (26.9%)
English: 374 (16.6%)
American: 254 (11.3%)
Irish: 216 (9.6%)
European: 122 (5.4%)
Italian: 99 (4.4%)
Scotch-Irish: 80 (3.6%)
Scottish: 59 (2.6%)
Polish: 39 (1.7%)
Hungarian: 31 (1.4%)
Swiss: 15 (0.7%)
French: 13 (0.6%)
Swedish: 9 (0.4%)
Czech: 8 (0.4%)
Scandinavian: 8 (0.4%)
Ukrainian: 8 (0.4%)
Lithuanian: 7 (0.3%)
Russian: 6 (0.3%)
Serbian: 5 (0.2%)
African: 4 (0.2%) Most common places of birth for foreign-born residents (%): India Franklin:
50.0% (9)Pennsylvania:
10.7% (100,596)
Italy Franklin:
33.3% (6)Pennsylvania:
1.8% (16,884)
Place of birth for U.S.-born residents:
This state: 5,024Other state: 969Northeast: 273Midwest: 283South: 287West: 127 88.6% of Franklin residents lived in the same house 1 years ago.
Out of people who lived in different houses, 37.1% lived in this county.
Out of people who lived in different counties, 50.0% lived in Pennsylvania.
Franklin:
88.6%State average:
89.3%
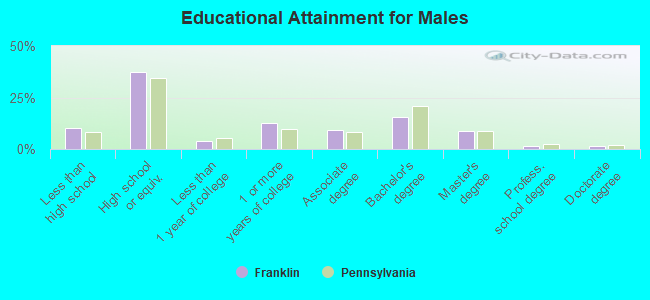
Education attainment for males 25 years and older:
No schooling: 19Nursery to 4th grade: 05th and 6th grade: 07th and 8th grade: 129th grade: 1410th grade: 6211th grade: 5112th grade, no diploma: 53High school graduate (or equivalency): 775Less than 1 year of college: 83Some college more than 1 year, no degree: 259Associate degree: 191Bachelor's degree: 327Master's degree: 179Professional school degree: 27Doctorate degree: 29
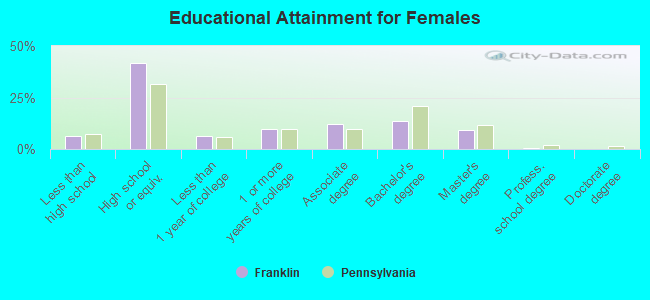
Education attainment for females 25 years and older:
No schooling: 24Nursery to 4th grade: 05th and 6th grade: 07th and 8th grade: 139th grade: 3510th grade: 2311th grade: 812th grade, no diploma: 49High school graduate (or equivalency): 973Less than 1 year of college: 148Some college more than 1 year, no degree: 221Associate degree: 278Bachelor's degree: 322Master's degree: 218Professional school degree: 11Doctorate degree: 5
Housing units in structures:
One, detached: 2,040One, attached: 128Two: 2013 or 4: 905 to 9: 20710 to 19: 11520 to 49: 2950 or more: 149Mobile homes: 91Median worth of mobile homes: $35,745
Housing units lacking complete plumbing facilities in 2022: 4.8%Housing units lacking complete kitchen facilities in 2022: 3.8%House/condo owner moved in on average 18 years ago
Renter moved in on average 5 years ago
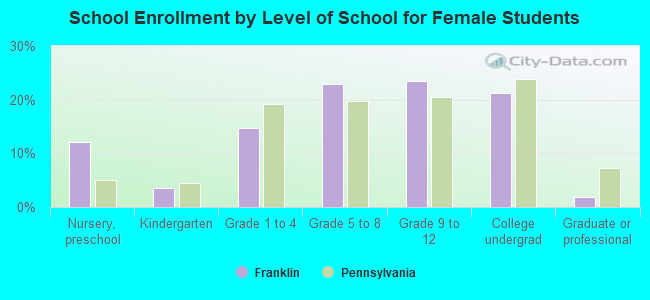
Private vs. public school enrollment:
Students in private schools in grades 1 to 8 (elementary and middle school): 76 Here:
15.2%Pennsylvania:
15.7%
Students in private schools in grades 9 to 12 (high school): 11 Here:
5.8%Pennsylvania:
13.4%
Students in private undergraduate colleges: 18 Here:
14.1%Pennsylvania:
39.8%