Frazier Park, CA (California) Houses and Residents
| Frazier Park: | $266,287 |
| California: | $715,900 |
Mean price in 2022:
Detached houses: $263,645
Here: $263,645 State: $988,808 Mobile homes: $149,454
Here: $149,454 State: $184,506
Total population: 2,691 (Urban population: 2,258 (all inside urban clusters), Rural population: 96 (all nonfarm))
Houses: 1,344 (1,185 occupied: 804 owner occupied, 389 renter occupied)
| % of renters here: | 33% |
| State: | 44% |
Housing density: 276 houses/condos per square mile
Median price asked for vacant for-sale houses and condos in 2022: $735,442.
Median contract rent in 2022: $930 (lower quartile is $656, upper quartile is $1,025)
Median rent asked for vacant for-rent units in 2022: $641
Median gross rent in Frazier Park, CA in 2022: $1,127
Housing units in Frazier Park with a mortgage: 721 (40 second mortgage, 0 home equity loan, 9 both second mortgage and home equity loan)
Houses without a mortgage: 0
Median household income for houses/condos with a mortgage: $53,112
Median household income for apartments without a mortgage: $16,497
Median monthly housing costs: $1,264
Compare current foreclosures in Frazier Park, CA:
| Photo | Address | Area | Beds / Baths | Price | Details |
|---|---|---|---|---|---|

|
#1
E End Dr
Frazier Park, CA 93225
|
816 sq. feet
|
1 baths 2 beds |
show details | |

|
#2
Pioneer Way
Frazier Park, CA 93222
|
960 sq. feet
|
1 baths 2 beds |
show details | |

|
#3
Zion Way
Frazier Park, CA 93222
|
2,962 sq. feet
|
2 baths 4 beds |
show details | |

|
#4
Tulip Pl
Frazier Park, CA 93225
|
2,048 sq. feet
|
3 baths 3 beds |
show details | |

|
#5
Cedarwood Dr
Frazier Park, CA 93222
|
2,396 sq. feet
|
3 baths 4 beds |
show details | |

|
#6
Symonds Dr
Frazier Park, CA 93222
|
2,055 sq. feet
|
3 baths 3 beds |
show details | |

|
#7
Matterhorn Dr
Frazier Park, CA 93222
|
1,831 sq. feet
|
2 baths 3 beds |
show details | |

|
#8
Sandalwood Dr
Frazier Park, CA 93222
|
1,713 sq. feet
|
2 baths 3 beds |
show details | |

|
#9
Edgewood Way
Frazier Park, CA 93222
|
3,578 sq. feet
|
3 baths 5 beds |
show details | |

|
#10
Zermatt Ct
Frazier Park, CA 93222
|
1,270 sq. feet
|
2 baths 3 beds |
show details |
| Photo | Address | Area | Beds / Baths | Price | Details |
|---|---|---|---|---|---|

|
#11
Voltaire Dr
Frazier Park, CA 93225
|
987 sq. feet
|
2 baths 2 beds |
show details | |

|
#12
Freeman Dr
Frazier Park, CA 93222
|
3,440 sq. feet
|
1 baths 2 beds |
show details | |

|
#13
Shasta Way
Frazier Park, CA 93222
|
1,366 sq. feet
|
2 baths 3 beds |
show details | |

|
#14
Sequoia Way
Frazier Park, CA 93222
|
1,868 sq. feet
|
2 baths 4 beds |
show details | |

|
#15
Klondike Way
Frazier Park, CA 93222
|
576 sq. feet
|
1 baths 1 beds |
show details | |

|
#16
Zermatt Dr
Frazier Park, CA 93222
|
952 sq. feet
|
2 baths 2 beds |
show details | |

|
#17
Freeman Dr
Frazier Park, CA 93222
|
2,529 sq. feet
|
2 baths 3 beds |
show details | |

|
#18
Wildwood Dr
Frazier Park, CA 93222
|
2,309 sq. feet
|
2 baths 3 beds |
show details | |

|
#19
Zermatt Dr
Frazier Park, CA 93222
|
2,093 sq. feet
|
3 baths 3 beds |
show details | |

|
#20
Maple Trl
Frazier Park, CA 93225
|
1,020 sq. feet
|
1 baths 3 beds |
show details |
| Photo | Address | Area | Beds / Baths | Price | Details |
|---|---|---|---|---|---|

|
#21
Mil Potrero Hwy
Frazier Park, CA 93222
|
1,440 sq. feet
|
2 baths 3 beds |
show details | |

|
#22
Race Trl
Frazier Park, CA 93225
|
896 sq. feet
|
1 baths 2 beds |
show details | |

|
#23
Illinois Trl
Frazier Park, CA 93225
|
2,115 sq. feet
|
2 baths 2 beds |
show details | |

|
#24
Arctic Dr
Frazier Park, CA 93222
|
1,920 sq. feet
|
2 baths 4 beds |
show details | |

|
#25
St Bernard Dr
Frazier Park, CA 93222
|
3,462 sq. feet
|
2 baths 4 beds |
show details | |

|
#26
Dawn Ct
Frazier Park, CA 93222
|
1,728 sq. feet
|
3 baths 2 beds |
show details | |

|
#27
Cypress Way
Frazier Park, CA 93222
|
1,728 sq. feet
|
3 baths 3 beds |
show details | |

|
#28
Ashwood Ct
Frazier Park, CA 93222
|
1,248 sq. feet
|
2 baths 2 beds |
show details | |

|
#29
Cedarwood Dr
Frazier Park, CA 93222
|
1,788 sq. feet
|
2 baths 4 beds |
show details | |

|
#30
Los Padres
Frazier Park, CA 93225
|
- sq. feet
|
2 baths 3 beds |
show details |
| Photo | Address | Area | Beds / Baths | Price | Details |
|---|---|---|---|---|---|

|
#31
Mil Potrero Hwy
Frazier Park, CA 93222
|
1,827 sq. feet
|
3 baths 3 beds |
show details | |

|
#32
Mil Potrero Hwy
Frazier Park, CA 93222
|
- sq. feet
|
- baths - beds |
$9,100
|
show details |

|
#33
Askin Dr
Frazier Park, CA 93222
|
- sq. feet
|
- baths - beds |
show details | |

|
#34
Zion Way
Frazier Park, CA 93222
|
- sq. feet
|
- baths - beds |
show details | |

|
#35
Triol Drive
Frazier Park, CA 93222
|
- sq. feet
|
- baths - beds |
show details | |

|
#36
Pioneer Way
Frazier Park, CA 93222
|
- sq. feet
|
- baths - beds |
show details | |

|
#37
Freeman Ct
Frazier Park, CA 93222
|
- sq. feet
|
- baths - beds |
show details | |

|
#38
Chestnut Dr
Frazier Park, CA 93222
|
- sq. feet
|
- baths - beds |
show details | |

|
#39
Chestnut Dr
Frazier Park, CA 93222
|
- sq. feet
|
- baths - beds |
show details | |

|
#40
Mil Potrero Hwy
Frazier Park, CA 93222
|
- sq. feet
|
- baths - beds |
show details |
| Photo | Address | Area | Beds / Baths | Price | Details |
|---|---|---|---|---|---|

|
#41
Cedarwood Dr
Frazier Park, CA 93222
|
- sq. feet
|
- baths - beds |
show details | |

|
#42
Texas Trl
Frazier Park, CA 93225
|
- sq. feet
|
- baths - beds |
show details | |

|
#43
Deer Trl
Frazier Park, CA 93225
|
- sq. feet
|
- baths - beds |
show details | |

|
#44
Shasta Way
Frazier Park, CA 93222
|
- sq. feet
|
- baths - beds |
show details | |

|
#45
Linden Dr
Frazier Park, CA 93222
|
- sq. feet
|
- baths - beds |
show details | |

|
#46
Linden Dr
Frazier Park, CA 93222
|
- sq. feet
|
- baths - beds |
show details | |

|
#47
Zermatt Dr
Frazier Park, CA 93222
|
- sq. feet
|
- baths - beds |
show details | |

|
#48
Nadelhorn Ct
Frazier Park, CA 93222
|
- sq. feet
|
- baths - beds |
show details | |

|
#49
Pioneer Way
Frazier Park, CA 93222
|
- sq. feet
|
- baths - beds |
show details | |

|
Check over 1 million property listings on Foreclosure.com!
|
browse all offers | |||


Median year apartment built: 1973
Household type by relationship:
Households: 2,746- Male householders: 553 (216 living alone), Female householders: 626 (204 living alone)
420 spouses (420 opposite-sex spouses), 75 unmarried partners, (75 opposite-sex unmarried partners), 762 children (762 natural, 0 adopted, 0 stepchildren), 0 grandchildren, 0 brothers or sisters, 0 parents, 0 foster children, 48 other relatives, 259 non-relatives
Size of family households: 362 2-persons, 52 3-persons, 92 4-persons, 171 5-persons.
Size of nonfamily households: 420 1-person, 86 2-persons.
110 married couples with children.
256 single-parent households (55 men, 201 women).
79.9% of residents of Frazier Park speak English at home.
16.3% of residents speak Spanish at home (78% speak English very well, 7% speak English well, 7% speak English not well, 8% don't speak English at all).
0.6% of residents speak other Indo-European language at home (100% speak English very well).
2.3% of residents speak other language at home (100% speak English very well).
Foreign born population: 227 (8.3%)
(61.2% of them are naturalized citizens)
| Here: | 5.7 |
| State: | 6.0 |
| Here: | 3.9 |
| State: | 3.9 |

- Bedrooms in owner-occupied houses and condos in Frazier Park, California
- 0no bedroom
- 1491 bedroom
- 1002 bedrooms
- 2983 bedrooms
- 2564 bedrooms
- 05+ bedrooms

- Bedrooms in renter-occupied apartments in Frazier Park, California
- 35no bedroom
- 1071 bedroom
- 1402 bedrooms
- 583 bedrooms
- 494 bedrooms
- 05+ bedrooms

- Cars and other vehicles available in Frazier Park in owner-occupied houses/condos
- 39no vehicle
- 3091 vehicle
- 1622 vehicles
- 1483 vehicles
- 1384 vehicles
- 85+ vehicles

- Cars and other vehicles available in Frazier Park in renter-occupied apartments
- 0no vehicle
- 1691 vehicle
- 2212 vehicles
- 03 vehicles
- 04 vehicles
- 05+ vehicles

- Rooms in owner-occupied houses in Frazier Park, California
- 01 room
- 402 rooms
- 1383 rooms
- 294 rooms
- 1785 rooms
- 1856 rooms
- 2217 rooms
- 148 rooms
- 09+ rooms

- Rooms in renter-occupied apartments in Frazier Park, California
- 351 room
- 332 rooms
- 693 rooms
- 1454 rooms
- 95 rooms
- 986 rooms
- 07 rooms
- 08 rooms
- 09+ rooms


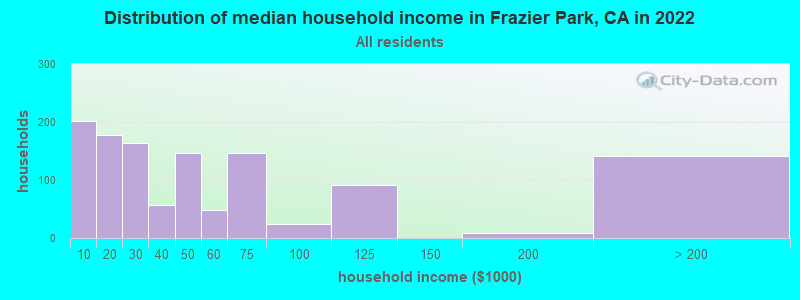
Frazier Park, CA household income distribution

- 202Less than $10,000
- 177$10,000 to $19,999
- 164$20,000 to $29,999
- 57$30,000 to $39,999
- 146$40,000 to $49,999
- 48$50,000 to $59,999
- 147$60,000 to $74,999
- 24$75,000 to $99,999
- 92$100,000 to $124,999
- 8$150,000 to $199,999
- 141$200,000 or more
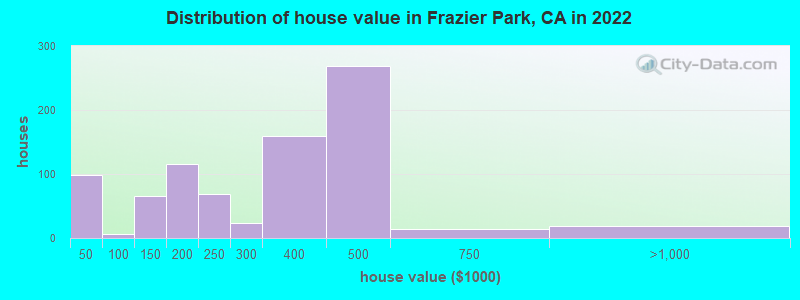
Home value of owner - occupied houses in 2022 in Frazier Park, CA
-
- 11Less than $10,000
- 23$10,000 to $14,999
- 63$20,000 to $24,999
- 5$50,000 to $59,999
- 38$100,000 to $124,999
- 26$125,000 to $149,999
- 45$150,000 to $174,999
- 70$175,000 to $199,999
- 68$200,000 to $249,999
- 23$250,000 to $299,999
- 160$300,000 to $399,999
- 269$400,000 to $499,999
- 13$500,000 to $749,999
- 17$750,000 to $999,999
Rent paid by renters in 2022 in Frazier Park, CA
-
- 9$450 to $499
- 35$550 to $599
- 30$600 to $649
- 72$800 to $899
- 95$900 to $999
- 36$1,000 to $1,249
- 54$1,500 to $1,999
- 28No cash rent

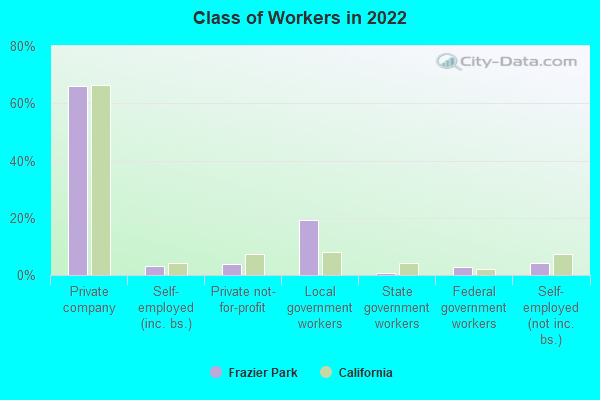
Percentage of workers working in this county: 70.7%
Number of people working at home: 301 (23.3% of all workers)
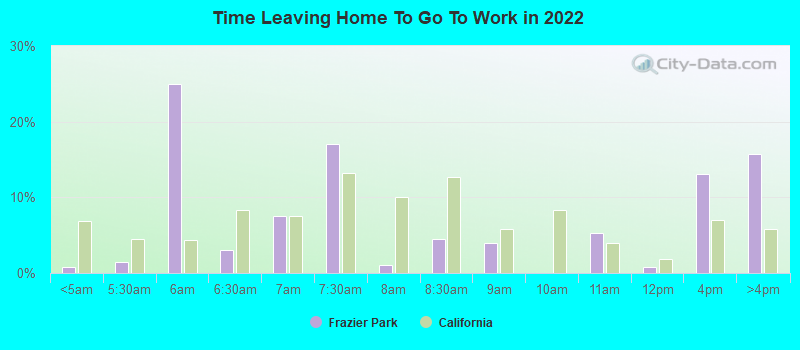
Travel time to work (commute)
- Less than 5 minutes: 0
- 5 to 9 minutes: 304
- 10 to 14 minutes: 74
- 15 to 19 minutes: 45
- 20 to 24 minutes: 136
- 25 to 29 minutes: 43
- 30 to 34 minutes: 16
- 35 to 39 minutes: 0
- 40 to 44 minutes: 42
- 45 to 59 minutes: 148
- 60 to 89 minutes: 104
- 90 or more minutes: 69
Means of transportation to work:
- Drove a car alone: 419 (59.3%)
- Carpooled: 184 (26.1%)
- Motorcycle: 9 (1.3%)
- Bicycle: 11 (1.6%)
- Walked: 10 (1.4%)
- Other means: 56 (7.9%)
- Worked at home: 17 (2.4%)
- Unemployment by race in 2022
- Unemployment rate for White non-Hispanic residents
- 9.8%Females
- Unemployment rate for two or more race residents
- 84.5%Males
- Unemployment rate for Hispanic or Latino residents
- 17.8%Males
- 16.7%Females

- Year of entry for the foreign-born population in Frazier Park, California
- 02010 or later
- 122000 to 2009
- 471990 to 1999
- 281980 to 1989
- 01970 to 1979
- 53Before 1970

First ancestries reported:
- American: 100 (11.2%)
- Scotch-Irish: 93 (10.4%)
- Syrian: 39 (4.4%)
- German: 38 (4.3%)
- Welsh: 33 (3.7%)
- Lebanese: 22 (2.5%)
- Czechoslovakian: 21 (2.4%)
- Scandinavian: 10 (1.1%)
- Northern European: 8 (0.9%)
- Ukrainian: 8 (0.9%)
Most common places of birth for foreign-born residents (%):
| Frazier Park: | 56.0% (130) |
| California: | 37.2% (3,881,193) |
| Frazier Park: | 25.0% (58) |
| California: | 4.2% (440,287) |
| Frazier Park: | 9.5% (22) |
| California: | 0.3% (31,757) |
| Frazier Park: | 6.0% (14) |
| California: | 0.7% (74,025) |
Place of birth for U.S.-born residents:
- This state: 1,968
- Other state: 503
- Northeast: 78
- Midwest: 260
- South: 15
- West: 155
98.9% of Frazier Park residents lived in the same house 1 years ago.
Out of people who lived in different houses, 14.0% lived in this county.
Out of people who lived in different counties, 100.0% lived in California.
| Frazier Park: | 98.9% |
| State average: | 88.9% |
Education attainment for males 25 years and older:
- No schooling: 0
- Nursery to 4th grade: 31
- 5th and 6th grade: 0
- 7th and 8th grade: 0
- 9th grade: 30
- 10th grade: 66
- 11th grade: 7
- 12th grade, no diploma: 16
- High school graduate (or equivalency): 392
- Less than 1 year of college: 73
- Some college more than 1 year, no degree: 58
- Associate degree: 50
- Bachelor's degree: 110
- Master's degree: 124
- Professional school degree: 0
- Doctorate degree: 0

Education attainment for females 25 years and older:
- No schooling: 0
- Nursery to 4th grade: 0
- 5th and 6th grade: 43
- 7th and 8th grade: 0
- 9th grade: 0
- 10th grade: 0
- 11th grade: 0
- 12th grade, no diploma: 0
- High school graduate (or equivalency): 340
- Less than 1 year of college: 73
- Some college more than 1 year, no degree: 251
- Associate degree: 78
- Bachelor's degree: 80
- Master's degree: 142
- Professional school degree: 0
- Doctorate degree: 0


Housing units in structures:
- One, detached: 1,145
- Mobile homes: 198
House/condo owner moved in on average 14 years ago
Renter moved in on average 5 years ago

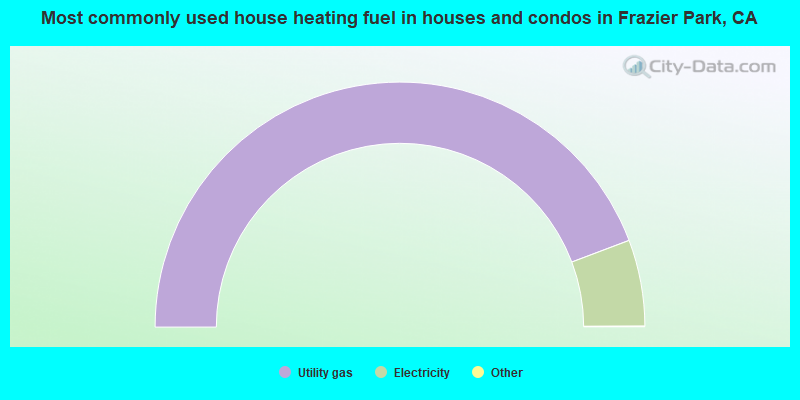
- 88.6%Utility gas
- 11.4%Electricity
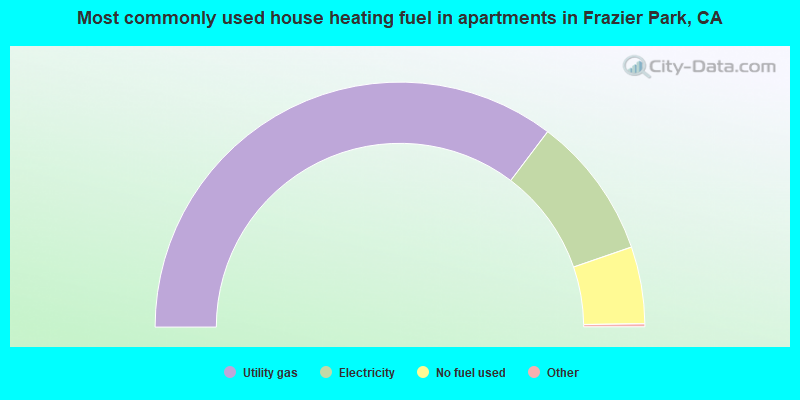
- 70.9%Utility gas
- 18.9%Electricity
- 10.2%No fuel used
Private vs. public school enrollment:
| Here: | 0.0% |
| California: | 10.5% |
| Here: | 0.0% |
| California: | 8.5% |
| Here: | 0.0% |
| California: | 15.9% |


