Freetown, MA (Massachusetts) Houses and Residents
| Freetown: | $481,044 |
| Massachusetts: | $534,700 |
Total population: 8,870 (Urban population: 4,699, Rural population: 3,773 (19 farm, 3,754 nonfarm))
Houses: 3,029 (2,932 occupied: 2,614 owner occupied, 318 renter occupied)
| % of renters here: | 11% |
| State: | 38% |
Housing density: 83 houses/condos per square mile
Median price asked for vacant for-sale houses and condos in 2022 in this county: $509,684.
Median contract rent in 2022: $1,195 (lower quartile is $1,112, upper quartile is $1,564)
Median rent asked for vacant for-rent units in 2022: $1,172
Median gross rent in Freetown, MA in 2022: $1,379
Housing units in Freetown with a mortgage: 1,825 (168 second mortgage, 383 home equity loan, 0 both second mortgage and home equity loan)
Houses without a mortgage: 607
Compare current foreclosures near Freetown, MA:
| Photo | Address | Area | Beds / Baths | Price | Details |
|---|---|---|---|---|---|

|
#1
Somerset Ave
Taunton, MA 02780
|
3,196 sq. feet
|
3 baths 4 beds |
$754,900
|
show details |

|
#2
County St
East Taunton, MA 02718
|
1,157 sq. feet
|
1 baths 1 beds |
$219,900
|
show details |

|
#3
Peckham St
New Bedford, MA 02746
|
3,089 sq. feet
|
3 baths 9 beds |
show details | |

|
#4
Melville St
Fall River, MA 02724
|
2,733 sq. feet
|
3 baths 6 beds |
show details | |

|
#5
Willis St
New Bedford, MA 02740
|
1,973 sq. feet
|
2 baths 4 beds |
show details | |

|
#6
Woodland Ave
Seekonk, MA 02771
|
4,611 sq. feet
|
4 baths 4 beds |
show details | |

|
#7
Belleville Rd
New Bedford, MA 02745
|
- sq. feet
|
2 baths 5 beds |
show details | |

|
#8
Terry Ln E
Wareham, MA 02571
|
1,412 sq. feet
|
1 baths 4 beds |
show details | |

|
#9
Boyds Ln
Portsmouth, RI 02871
|
1,144 sq. feet
|
1 baths 3 beds |
show details | |

|
#10
Powhattan Dr
East Taunton, MA 02718
|
1,632 sq. feet
|
1 baths 3 beds |
show details |
| Photo | Address | Area | Beds / Baths | Price | Details |
|---|---|---|---|---|---|

|
#11
Swifts Beach Road A/k/a 84 Swift S Beach Road
Wareham, MA 02571
|
- sq. feet
|
1 baths 3 beds |
show details | |

|
#12
Bay St
Fall River, MA 02724
|
1,848 sq. feet
|
1 baths 3 beds |
show details | |

|
#13
Dwinell Rd
Taunton, MA 02780
|
1,632 sq. feet
|
2 baths 4 beds |
show details | |

|
#14
Detroit Ave
Warren, RI 02885
|
1,518 sq. feet
|
1 baths 3 beds |
show details | |

|
#15
N Main St
Middleboro, MA 02346
|
1,898 sq. feet
|
2 baths 4 beds |
show details | |

|
#16
Oak St
New Bedford, MA 02740
|
1,460 sq. feet
|
2 baths 3 beds |
show details | |

|
#17
Ashland St
Taunton, MA 02780
|
1,680 sq. feet
|
2 baths 4 beds |
show details | |

|
#18
Homestead Ave
Acushnet, MA 02743
|
936 sq. feet
|
1 baths 3 beds |
show details | |

|
#19
Point Rd
Marion, MA 02738
|
660 sq. feet
|
1 baths 2 beds |
show details | |

|
#20
Gifford Ave
North Dartmouth, MA 02747
|
1,518 sq. feet
|
1 baths 4 beds |
show details |
| Photo | Address | Area | Beds / Baths | Price | Details |
|---|---|---|---|---|---|

|
#21
Mill St
New Bedford, MA 02740
|
1,542 sq. feet
|
1 baths 3 beds |
show details | |

|
#22
Chace Ave
Warren, RI 02885
|
1,224 sq. feet
|
1 baths 2 beds |
show details | |

|
#23
Mayo Dr
Warren, RI 02885
|
1,739 sq. feet
|
1 baths 3 beds |
show details | |

|
#24
Everett St
Middleboro, MA 02346
|
1,188 sq. feet
|
1 baths 3 beds |
show details | |

|
#25
Spruce St
Middleboro, MA 02346
|
1,846 sq. feet
|
3 baths 4 beds |
show details | |

|
#26
County St
New Bedford, MA 02740
|
2,624 sq. feet
|
4 baths 4 beds |
show details | |

|
#27
Cedar St
Rehoboth, MA 02769
|
3,606 sq. feet
|
3 baths 4 beds |
show details | |

|
#28
Whittier St
Fall River, MA 02724
|
972 sq. feet
|
1 baths 2 beds |
show details | |

|
#29
Dellawanda Rd
Swansea, MA 02777
|
1,052 sq. feet
|
1 baths 2 beds |
show details | |

|
#30
Oak St
Middleboro, MA 02346
|
1,589 sq. feet
|
2 baths 3 beds |
show details |
| Photo | Address | Area | Beds / Baths | Price | Details |
|---|---|---|---|---|---|

|
#31
Hedge St
Fairhaven, MA 02719
|
878 sq. feet
|
1 baths 2 beds |
show details | |

|
#32
Reed St
New Bedford, MA 02740
|
1,742 sq. feet
|
1 baths 4 beds |
show details | |

|
#33
Chancery St
New Bedford, MA 02740
|
1,327 sq. feet
|
1 baths 3 beds |
show details | |

|
#34
Benson St
Middleboro, MA 02346
|
1,456 sq. feet
|
1 baths 3 beds |
show details | |

|
#35
Main St
Fairhaven, MA 02719
|
2,412 sq. feet
|
2 baths 4 beds |
show details | |

|
#36
Townsend St
Fall River, MA 02724
|
1,040 sq. feet
|
1 baths 3 beds |
show details | |

|
#37
Wareham St
Middleboro, MA 02346
|
1,114 sq. feet
|
1 baths 1 beds |
show details | |

|
#38
Chestnut St
New Bedford, MA 02740
|
2,860 sq. feet
|
2 baths 4 beds |
show details | |

|
#39
Forest St
Middleboro, MA 02346
|
1,343 sq. feet
|
2 baths 3 beds |
show details | |

|
#40
Rounds St
New Bedford, MA 02740
|
1,450 sq. feet
|
1 baths 4 beds |
show details |
| Photo | Address | Area | Beds / Baths | Price | Details |
|---|---|---|---|---|---|

|
#41
Appleton St
Fall River, MA 02724
|
662 sq. feet
|
1 baths 3 beds |
show details | |

|
#42
Mariano Bishop Blvd
Fall River, MA 02721
|
1,085 sq. feet
|
1 baths 3 beds |
show details | |

|
#43
Sproat St
Middleboro, MA 02346
|
1,574 sq. feet
|
1 baths 3 beds |
show details | |

|
#44
Ridgecrest Ave
Fairhaven, MA 02719
|
2,524 sq. feet
|
4 baths 4 beds |
show details | |

|
#45
Marchand Way
Norton, MA 02766
|
1,296 sq. feet
|
2 baths 2 beds |
show details | |

|
#46
Monroe St
Taunton, MA 02780
|
900 sq. feet
|
1 baths 2 beds |
show details | |

|
#47
Vinnicum Rd
Swansea, MA 02777
|
1,867 sq. feet
|
1 baths 2 beds |
show details | |

|
#48
Bolton St
New Bedford, MA 02740
|
1,072 sq. feet
|
1 baths 2 beds |
show details | |

|
#49
Winterville Rd
New Bedford, MA 02740
|
993 sq. feet
|
1 baths 3 beds |
show details | |

|
Check over 1 million property listings on Foreclosure.com!
|
browse all offers | |||

Household type by relationship:
Households: 532,417- In family households: 444,740 (93,440 male householders, 47,898 female householders)
101,208 spouses, 160,791 children (151,812 natural, 3,293 adopted, 5,686 stepchildren), 9,612 grandchildren, 4,550 brothers or sisters, 5,590 parents, foster children, 4,929 other relatives, 12,847 non-relatives
- In nonfamily households: 87,677 (32,955 male householders (25,495 living alone)), 38,717 female householders (32,941 living alone)), 16,005 nonrelatives
- In group quarters: 15,868 (6,219 institutionalized population)
88,038 married couples with children.
33,142 single-parent households (5,908 men, 27,234 women).
90.3% of residents of Freetown speak English at home.
0.4% of residents speak Spanish at home (71% speak English very well, 29% speak English well).
9.1% of residents speak other Indo-European language at home (73% speak English very well, 22% speak English well, 3% speak English not well, 1% don't speak English at all).
0.2% of residents speak Asian or Pacific Island language at home (100% speak English very well).
Foreign born population: 696 (7.6%)
(78.0% of them are naturalized citizens)
| Here: | 6.4 |
| State: | 6.5 |
| Here: | 4.4 |
| State: | 4.0 |

- Bedrooms in owner-occupied houses and condos in Freetown, Massachusetts
- 14no bedroom
- 91 bedroom
- 4952 bedrooms
- 1,4693 bedrooms
- 5254 bedrooms
- 1025+ bedrooms

- Bedrooms in renter-occupied apartments in Freetown, Massachusetts
- 18no bedroom
- 691 bedroom
- 1122 bedrooms
- 1053 bedrooms
- 64 bedrooms
- 85+ bedrooms

- Cars and other vehicles available in Freetown in owner-occupied houses/condos
- 59no vehicle
- 3661 vehicle
- 1,4142 vehicles
- 5963 vehicles
- 1174 vehicles
- 625+ vehicles

- Cars and other vehicles available in Freetown in renter-occupied apartments
- 26no vehicle
- 1321 vehicle
- 1202 vehicles
- 313 vehicles
- 04 vehicles
- 95+ vehicles

- Rooms in owner-occupied houses in Freetown, Massachusetts
- 01 room
- 142 rooms
- 243 rooms
- 1854 rooms
- 5355 rooms
- 6356 rooms
- 5257 rooms
- 3778 rooms
- 3199+ rooms

- Rooms in renter-occupied apartments in Freetown, Massachusetts
- 181 room
- 02 rooms
- 523 rooms
- 1144 rooms
- 575 rooms
- 336 rooms
- 177 rooms
- 198 rooms
- 89+ rooms


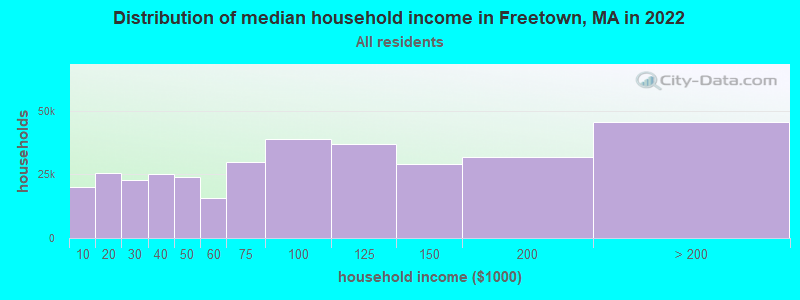
Freetown, MA household income distribution

- 20,196Less than $10,000
- 25,380$10,000 to $19,999
- 22,838$20,000 to $29,999
- 25,348$30,000 to $39,999
- 23,843$40,000 to $49,999
- 15,819$50,000 to $59,999
- 29,813$60,000 to $74,999
- 39,009$75,000 to $99,999
- 37,021$100,000 to $124,999
- 29,283$125,000 to $149,999
- 32,022$150,000 to $199,999
- 45,636$200,000 or more
Percentage of workers working in this county: 68.0%
Number of people working at home: 644 (11.5% of all workers)
Travel time to work (commute)
- Less than 5 minutes: 179
- 5 to 9 minutes: 320
- 10 to 14 minutes: 480
- 15 to 19 minutes: 866
- 20 to 24 minutes: 808
- 25 to 29 minutes: 494
- 30 to 34 minutes: 500
- 35 to 39 minutes: 163
- 40 to 44 minutes: 130
- 45 to 59 minutes: 170
- 60 to 89 minutes: 418
- 90 or more minutes: 116
Means of transportation to work:
- Drove a car alone: 4,145 (86.4%)
- Carpooled: 348 (7.2%)
- Bus or trolley bus: 10 (0.2%)
- Railroad: 6 (0.1%)
- Walked: 108 (2.2%)
- Other means: 27 (0.6%)
- Worked at home: 156 (3.2%)


- Year of entry for the foreign-born population in Freetown, Massachusetts
- 141995 to March 2000
- 191990 to 1994
- 241985 to 1989
- 321980 to 1984
- 581975 to 1979
- 661970 to 1974
- 1801965 to 1969
- 156Before 1965

First ancestries reported:
- Portuguese: 2,722 (26.0%)
- English: 1,473 (14.0%)
- French: 1,424 (13.6%)
- Irish: 1,133 (10.8%)
- French Canadian: 836 (8.0%)
- Polish: 631 (6.0%)
- Italian: 550 (5.2%)
- Other: 347 (3.3%)
- German: 302 (2.9%)
- United States: 230 (2.2%)
- Subsaharan African: 202 (1.9%)
- Scottish: 148 (1.4%)
- Swedish: 90 (0.9%)
- Arab: 85 (0.8%)
- Scotch-Irish: 64 (0.6%)
- Swiss: 62 (0.6%)
- Lithuanian: 51 (0.5%)
- Welsh: 34 (0.3%)
- Norwegian: 23 (0.2%)
- Danish: 21 (0.2%)
- Dutch: 19 (0.2%)
- Hungarian: 15 (0.1%)
- Greek: 12 (0.1%)
- Ukrainian: 7 (0.07%)
- Russian: 5 (0.05%)
Most common places of birth for foreign-born residents (%):
| Freetown: | 61.0% (335) |
| Massachusetts: | 8.6% (66,627) |
| Freetown: | 3.8% (21) |
| Massachusetts: | 5.2% (40,247) |
| Freetown: | 2.7% (15) |
| Massachusetts: | 3.6% (28,086) |
| Freetown: | 2.7% (15) |
| Massachusetts: | 0.3% (2,426) |
| Freetown: | 2.6% (14) |
| Massachusetts: | 0.2% (1,303) |
| Freetown: | 2.4% (13) |
| Massachusetts: | 1.8% (13,543) |
| Freetown: | 2.4% (13) |
| Massachusetts: | 1.7% (13,456) |
| Freetown: | 2.4% (13) |
| Massachusetts: | 2.6% (20,299) |
| Freetown: | 2.0% (11) |
| Massachusetts: | 1.1% (8,682) |
| Freetown: | 1.8% (10) |
| Massachusetts: | 0.5% (3,810) |
| Freetown: | 1.6% (9) |
| Massachusetts: | 0.3% (2,470) |
| Freetown: | 1.6% (9) |
| Massachusetts: | 0.7% (5,693) |
| Freetown: | 1.6% (9) |
| Massachusetts: | 0.5% (3,868) |
| Freetown: | 1.6% (9) |
| Massachusetts: | 0.2% (1,206) |
Place of birth for U.S.-born residents:
- This state: 6,953
- Other state: 951
- Northeast: 676
- Midwest: 104
- South: 128
- West: 43
73% of Freetown residents lived in the same house 5 years ago.
Out of people who lived in different houses, 81% lived in this county.
Out of people who lived in different counties, 51% lived in Massachusetts.
Education attainment for males 25 years and older:
- No schooling: 67
- Nursery to 4th grade: 0
- 5th and 6th grade: 12
- 7th and 8th grade: 115
- 9th grade: 103
- 10th grade: 136
- 11th grade: 32
- 12th grade, no diploma: 83
- High school graduate (or equivalency): 1,012
- Less than 1 year of college: 107
- Some college more than 1 year, no degree: 328
- Associate degree: 177
- Bachelor's degree: 381
- Master's degree: 167
- Professional school degree: 5
- Doctorate degree: 6

Education attainment for females 25 years and older:
- No schooling: 77
- Nursery to 4th grade: 0
- 5th and 6th grade: 31
- 7th and 8th grade: 105
- 9th grade: 70
- 10th grade: 78
- 11th grade: 26
- 12th grade, no diploma: 68
- High school graduate (or equivalency): 964
- Less than 1 year of college: 183
- Some college more than 1 year, no degree: 293
- Associate degree: 383
- Bachelor's degree: 496
- Master's degree: 148
- Professional school degree: 30
- Doctorate degree: 0


Housing units in structures:
- One, detached: 2,744
- One, attached: 65
- Two: 114
- 3 or 4: 49
- 5 to 9: 7
- Mobile homes: 50
Median worth of mobile homes: $66,866
Housing units lacking complete kitchen facilities: 0.2%

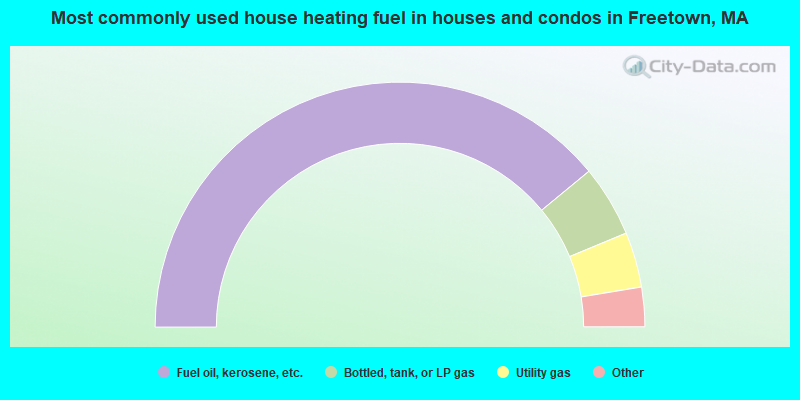
- 78.0%Fuel oil, kerosene, etc.
- 9.4%Bottled, tank, or LP gas
- 7.3%Utility gas
- 2.7%Electricity
- 1.3%Wood
- 1.0%Coal or coke
- 0.3%No fuel used
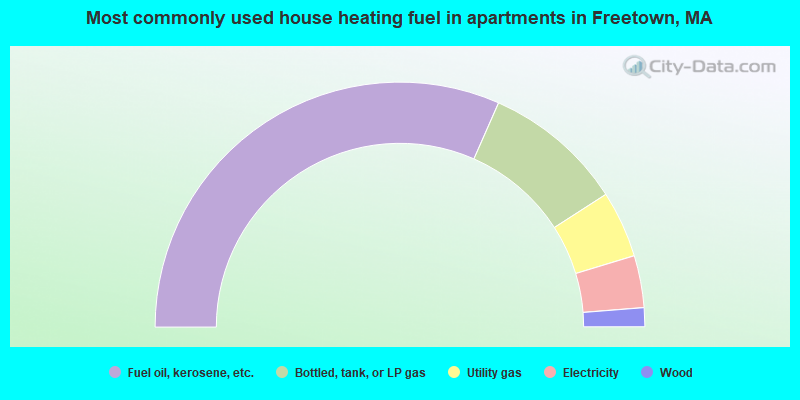
- 63.2%Fuel oil, kerosene, etc.
- 18.6%Bottled, tank, or LP gas
- 8.8%Utility gas
- 6.9%Electricity
- 2.5%Wood
Private vs. public school enrollment:
| Here: | 16.1% |
| Massachusetts: | 10.8% |
| Here: | 5.1% |
| Massachusetts: | 12.2% |
| Here: | 15.4% |
| Massachusetts: | 48.2% |


