Housing density: 1,038 houses/condos per square mile
Median price asked for vacant for-sale houses and condos in 2022: $1,195,203.
Median contract rent in 2022: over $2,000 (lower quartile is over $2,000, upper quartile is over $2,000)
Median rent asked for vacant for-rent units in 2022: $3,159
Median gross rent in Fremont, CA in 2022: over $2,000
Housing units in Fremont with a mortgage: 32,354 (3,155 second mortgage, 0 home equity loan, 2,441 both second mortgage and home equity loan) Houses without a mortgage: 716
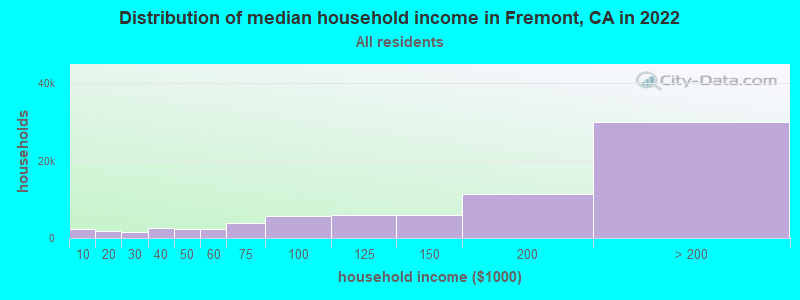
Median household income for houses/condos with a mortgage: $227,568
Median household income for apartments without a mortgage: $150,208
40,831 married couples with children.
5,435 single-parent households (1,569 men, 3,866 women).
37.1% of residents of Fremont speak English at home.
7.5% of residents speak Spanish at home (71% speak English very well, 22% speak English well, 7% speak English not well, 1% don't speak English at all).
20.5% of residents speak other Indo-European language at home (79% speak English very well, 14% speak English well, 7% speak English not well, 1% don't speak English at all).
33.5% of residents speak Asian or Pacific Island language at home (65% speak English very well, 25% speak English well, 8% speak English not well, 2% don't speak English at all).
1.3% of residents speak other language at home (72% speak English very well, 16% speak English well, 12% speak English not well).
Foreign born population: 109,160 (48.8%)
(55.0% of them are naturalized citizens)
Percentage of workers working in this county: 72.9% Number of people working at home: 39,339 (35.2% of all workers)
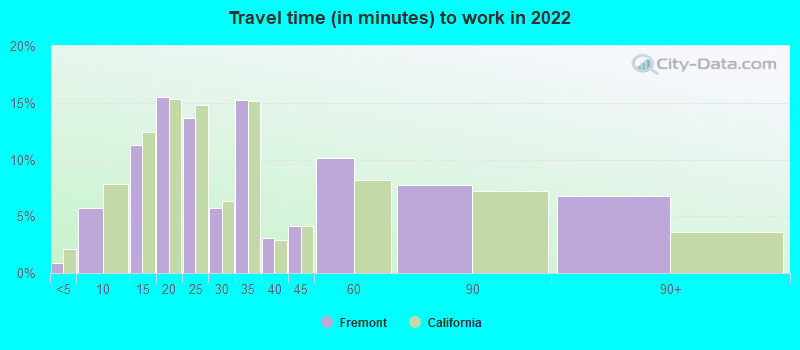
Travel time to work (commute)
Less than 5 minutes: 661
5 to 9 minutes: 4,715
10 to 14 minutes: 7,973
15 to 19 minutes: 14,281
20 to 24 minutes: 10,418
25 to 29 minutes: 4,579
30 to 34 minutes: 10,427
35 to 39 minutes: 2,088
40 to 44 minutes: 4,007
45 to 59 minutes: 8,819
60 to 89 minutes: 3,148
90 or more minutes: 1,433
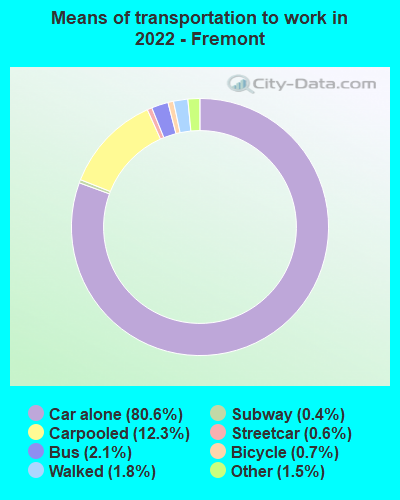
Means of transportation to work:
Drove a car alone: 79,362 (57.6%)
Carpooled: 12,067 (8.8%)
Bus: 2,042 (1.5%)
Subway or elevated rail: 611 (0.4%)
Long-distance train or commuter rail: 394 (0.3%)
Taxi: 1,488 (1.1%)
Bicycle: 728 (0.5%)
Walked: 1,808 (1.3%)
Worked at home: 39,339 (28.5%)
Unemployment by race in 2022
Unemployment rate for White non-Hispanic residents
2.0%Males
7.7%Females
Unemployment rate for Black residents
2.4%Males
0.5%Females
Unemployment rate for American Indian and Alaska Native residents
10.2%Males
1.4%Females
Unemployment rate for Asian residents
3.4%Males
3.5%Females
Unemployment rate for other race residents
3.9%Males
7.4%Females
Unemployment rate for two or more race residents
3.1%Males
2.3%Females
Unemployment rate for Hispanic or Latino residents
5.3%Females
Year of entry for the foreign-born population in Fremont, California
42,0382010 or later
27,3502000 to 2009
23,0541990 to 1999
22,8021980 to 1989
10,9021970 to 1979
6,319Before 1970
First ancestries reported:
Afghan: 2,814 (1.7%)
Irish: 2,122 (1.3%)
English: 1,748 (1.1%)
German: 1,626 (1.0%)
American: 1,572 (1.0%)
European: 967 (0.6%)
Italian: 880 (0.5%)
Portuguese: 821 (0.5%)
Iranian: 751 (0.5%)
Lebanese: 481 (0.3%)
Russian: 440 (0.3%)
British: 426 (0.3%)
Scottish: 338 (0.2%)
Northern European: 282 (0.2%)
Scotch-Irish: 267 (0.2%)
Norwegian: 265 (0.2%)
Ethiopian: 265 (0.2%)
Romanian: 263 (0.2%)
Polish: 244 (0.2%)
French: 244 (0.2%)
Croatian: 237 (0.1%)
Czech: 236 (0.1%)
African: 220 (0.1%)
Ukrainian: 209 (0.1%)
Armenian: 193 (0.1%)
Dutch: 187 (0.1%)
Swedish: 186 (0.1%)
Arab: 175 (0.1%)
Liberian: 167 (0.1%)
Jordanian: 163 (0.1%)
Kenyan: 154 (0.10%)
Eastern European: 149 (0.09%)
Hungarian: 146 (0.09%)
Greek: 138 (0.09%)
Brazilian: 108 (0.07%)
Swiss: 103 (0.06%)
Turkish: 84 (0.05%)
Egyptian: 81 (0.05%)
Trinidadian and Tobagonian: 74 (0.05%)
French Canadian: 68 (0.04%)
Czechoslovakian: 65 (0.04%)
Syrian: 64 (0.04%)
Canadian: 46 (0.03%)
Moroccan: 43 (0.03%)
Assyrian: 41 (0.03%)
South African: 39 (0.02%)
Haitian: 39 (0.02%)
Iraqi: 37 (0.02%)
Nigerian: 36 (0.02%)
Danish: 32 (0.02%)
Jamaican: 29 (0.02%)
Austrian: 22 (0.01%)
Palestinian: 18 (0.01%)
Belgian: 18 (0.01%)
Celtic: 14 (0.01%)
Latvian: 14 (0.01%)
Dutch West Indian: 13 (0.01%)
Lithuanian: 12 (0.01%)
Ugandan: 10 (0.01%)
Slavic: 10 (0.01%)
Australian: 9 (0.01%)
Bulgarian: 9 (0.01%)
Most common places of birth for foreign-born residents (%):
India
Fremont:
43.7% (49,309)
California:
5.2% (539,184)
China, excluding Hong Kong and Taiwan
Fremont:
14.8% (16,699)
California:
6.6% (684,672)
Philippines
Fremont:
6.7% (7,567)
California:
7.8% (818,297)
Taiwan
Fremont:
5.7% (6,449)
California:
1.7% (176,274)
Mexico
Fremont:
4.8% (5,453)
California:
37.2% (3,881,193)
Vietnam
Fremont:
2.9% (3,328)
California:
4.9% (512,335)
Hong Kong
Fremont:
2.8% (3,175)
California:
1.0% (105,215)
Afghanistan
Fremont:
2.2% (2,539)
California:
0.5% (53,260)
Korea
Fremont:
2.1% (2,339)
California:
3.0% (315,248)
Burma (Myanmar)
Fremont:
1.5% (1,728)
California:
0.3% (28,176)
Place of birth for U.S.-born residents:
This state: 92,706
Other state: 19,901
Northeast: 5,544
Midwest: 5,136
South: 4,774
West: 4,447
86.0% of Fremont residents lived in the same house 1 years ago. Out of people who lived in different houses, 36.6% lived in this county. Out of people who lived in different counties, 72.8% lived in California.
Fremont:
86.0%
State average:
88.9%
Education attainment for males 25 years and older:
No schooling: 1,458
Nursery to 4th grade: 88
5th and 6th grade: 34
7th and 8th grade: 300
9th grade: 834
10th grade: 424
11th grade: 44
12th grade, no diploma: 377
High school graduate (or equivalency): 9,952
Less than 1 year of college: 1,929
Some college more than 1 year, no degree: 7,609
Associate degree: 3,952
Bachelor's degree: 26,509
Master's degree: 20,663
Professional school degree: 1,149
Doctorate degree: 4,596
Education attainment for females 25 years and older:
No schooling: 1,767
Nursery to 4th grade: 313
5th and 6th grade: 362
7th and 8th grade: 413
9th grade: 497
10th grade: 992
11th grade: 202
12th grade, no diploma: 607
High school graduate (or equivalency): 12,191
Less than 1 year of college: 2,293
Some college more than 1 year, no degree: 5,911
Associate degree: 5,277
Bachelor's degree: 28,553
Master's degree: 18,580
Professional school degree: 1,843
Doctorate degree: 2,465
Housing units in structures:
One, detached: 45,619
One, attached: 10,828
Two: 411
3 or 4: 1,945
5 to 9: 2,771
10 to 19: 2,155
20 to 49: 2,841
50 or more: 12,336
Mobile homes: 662
Boats, RVs, vans, etc.: 27
Median worth of mobile homes: $200,600
Housing units lacking complete plumbing facilities in 2022: 0.4%
Housing units lacking complete kitchen facilities in 2022: 1.3%
House/condo owner moved in on average 14 years ago