Fremont, NC (North Carolina) Houses and Residents
| Fremont: | $114,065 |
| North Carolina: | $280,600 |
Mean price in 2022:
Detached houses: $140,713
Here: $140,713 State: $375,326 Mobile homes: $59,620
Here: $59,620 State: $124,933
Total population: 1,280 (Urban population: 0, Rural population: 1,448 (21 farm, 1,427 nonfarm))
Houses: 583 (443 occupied: 236 owner occupied, 204 renter occupied)
| % of renters here: | 46% |
| State: | 33% |
Housing density: 428 houses/condos per square mile
Median price asked for vacant for-sale houses and condos in 2022: $123,157.
Median contract rent in 2022: $392
Median rent asked for vacant for-rent units in 2022: $342
Median gross rent in Fremont, NC in 2022: $801
Housing units in Fremont with a mortgage: 138 (23 second mortgage, 0 home equity loan, 15 both second mortgage and home equity loan)
Houses without a mortgage: 2
Median household income for houses/condos with a mortgage: $93,652
Median household income for apartments without a mortgage: $59,296
Median monthly housing costs: $816
Compare current foreclosures near Fremont, NC:
| Photo | Address | Area | Beds / Baths | Price | Details |
|---|---|---|---|---|---|

|
#1
N Wilson St
Fremont, NC 27830
|
2,012 sq. feet
|
1 baths 3 beds |
show details | |

|
#2
Davis Mill Rd
Fremont, NC 27830
|
2,732 sq. feet
|
3 baths 3 beds |
show details | |

|
#3
Turner Swamp Rd
Fremont, NC 27830
|
1,836 sq. feet
|
2 baths 3 beds |
show details | |

|
#4
Aycock Dairy Farm Rd
Fremont, NC 27830
|
- sq. feet
|
- baths - beds |
show details | |

|
#5
Jesse Jackson St
La Grange, NC 28551
|
1,624 sq. feet
|
2 baths 3 beds |
$210,000
|
show details |

|
#6
Croom Dr
Goldsboro, NC 27530
|
1,328 sq. feet
|
1 baths 3 beds |
$27,500
|
show details |

|
#7
Eli Olive Rd
Smithfield, NC 27577
|
1,991 sq. feet
|
2 baths 3 beds |
show details | |

|
#8
Nc Hwy 91 S
Walstonburg, NC 27888
|
1,412 sq. feet
|
2 baths 3 beds |
show details | |

|
#9
Campground Rd
Selma, NC 27576
|
2,108 sq. feet
|
2 baths 3 beds |
show details | |

|
#10
Burnside Dr NW
Wilson, NC 27896
|
1,484 sq. feet
|
3 baths 3 beds |
show details |
| Photo | Address | Area | Beds / Baths | Price | Details |
|---|---|---|---|---|---|

|
#11
Bunche Dr
Goldsboro, NC 27530
|
1,104 sq. feet
|
2 baths 3 beds |
show details | |

|
#12
Sauls St SW
Wilson, NC 27893
|
1,236 sq. feet
|
1 baths 2 beds |
show details | |

|
#13
Autumn Winds Dr
Goldsboro, NC 27530
|
- sq. feet
|
2 baths 3 beds |
show details | |

|
#14
Briggs St S
Wilson, NC 27893
|
1,234 sq. feet
|
1 baths 3 beds |
show details | |

|
#15
Little Rock Church Rd
Lucama, NC 27851
|
1,025 sq. feet
|
1 baths 3 beds |
show details | |

|
#16
Glenhaven Ln
Goldsboro, NC 27530
|
2,026 sq. feet
|
2 baths 3 beds |
show details | |

|
#17
Ricks Ct E
Wilson, NC 27893
|
1,508 sq. feet
|
2 baths 3 beds |
show details | |

|
#18
Forrest Rd W
Wilson, NC 27893
|
1,053 sq. feet
|
1 baths 3 beds |
show details | |

|
#19
Carolina St E
Wilson, NC 27893
|
850 sq. feet
|
1 baths 2 beds |
show details | |

|
#20
Lauren Ln
Princeton, NC 27569
|
2,016 sq. feet
|
2 baths 3 beds |
show details |
| Photo | Address | Area | Beds / Baths | Price | Details |
|---|---|---|---|---|---|

|
#21
Boykin Rd
Sims, NC 27880
|
1,192 sq. feet
|
1 baths 3 beds |
show details | |

|
#22
Village Dr W
Wilson, NC 27893
|
1,297 sq. feet
|
2 baths 3 beds |
show details | |

|
#23
Woodside Dr W
Wilson, NC 27893
|
1,488 sq. feet
|
2 baths 3 beds |
show details | |

|
#24
Tammy Ln
Wilson, NC 27893
|
1,890 sq. feet
|
2 baths 4 beds |
show details | |

|
#25
Fitch Dr E
Wilson, NC 27893
|
1,500 sq. feet
|
2 baths 3 beds |
show details | |

|
#26
Trinity Dr W
Wilson, NC 27893
|
1,605 sq. feet
|
3 baths 4 beds |
show details | |

|
#27
Merck Rd W
Wilson, NC 27893
|
1,470 sq. feet
|
2 baths 3 beds |
show details | |

|
#28
Kensington Ave NW
Wilson, NC 27896
|
2,417 sq. feet
|
2 baths 3 beds |
show details | |

|
#29
Vance St N
Wilson, NC 27893
|
2,043 sq. feet
|
2 baths 4 beds |
show details | |

|
#30
Greenbriar Ct NW
Wilson, NC 27896
|
2,660 sq. feet
|
2 baths 4 beds |
show details |
| Photo | Address | Area | Beds / Baths | Price | Details |
|---|---|---|---|---|---|

|
#31
Lisa Dr
Princeton, NC 27569
|
1,308 sq. feet
|
2 baths 3 beds |
show details | |

|
#32
Gold St N
Wilson, NC 27893
|
1,969 sq. feet
|
2 baths 3 beds |
show details | |

|
#33
Oakdale Dr W
Wilson, NC 27893
|
1,774 sq. feet
|
2 baths 3 beds |
show details | |

|
#34
Thurston Dr W
Wilson, NC 27893
|
1,016 sq. feet
|
1 baths 2 beds |
show details | |

|
#35
Lafayette Dr NW
Wilson, NC 27893
|
3,185 sq. feet
|
2 baths 3 beds |
show details | |

|
#36
Holly Trl
Wilson, NC 27893
|
1,436 sq. feet
|
1 baths 3 beds |
show details | |

|
#37
Eagles Crest Ln
Princeton, NC 27569
|
1,769 sq. feet
|
2 baths 3 beds |
show details | |

|
#38
S Marion Dr
Goldsboro, NC 27534
|
1,691 sq. feet
|
2 baths 3 beds |
show details | |

|
#39
Bear Creek Rd
Goldsboro, NC 27534
|
1,877 sq. feet
|
2 baths 3 beds |
show details | |

|
#40
Randall Ln
Goldsboro, NC 27534
|
1,255 sq. feet
|
1 baths 3 beds |
show details |
| Photo | Address | Area | Beds / Baths | Price | Details |
|---|---|---|---|---|---|

|
#41
Randall Ln
Goldsboro, NC 27534
|
1,512 sq. feet
|
2 baths 3 beds |
show details | |

|
#42
E Elm St
Goldsboro, NC 27530
|
1,155 sq. feet
|
1 baths 3 beds |
show details | |

|
#43
Meadow St S
Wilson, NC 27893
|
1,536 sq. feet
|
2 baths 3 beds |
show details | |

|
#44
Maddux Dr
Pikeville, NC 27863
|
2,017 sq. feet
|
2 baths 3 beds |
show details | |

|
#45
S Best St
Goldsboro, NC 27530
|
2,145 sq. feet
|
2 baths 3 beds |
show details | |

|
#46
Sedgefield Dr
Goldsboro, NC 27534
|
1,352 sq. feet
|
2 baths 3 beds |
show details | |

|
#47
Boswell Rd
Kenly, NC 27542
|
1,728 sq. feet
|
2 baths 3 beds |
show details | |

|
#48
Joe Morris Rd
Kenly, NC 27542
|
1,600 sq. feet
|
1 baths 3 beds |
show details | |

|
#49
Sauls St SW
Wilson, NC 27893
|
1,263 sq. feet
|
1 baths 3 beds |
show details | |

|
Check over 1 million property listings on Foreclosure.com!
|
browse all offers | |||

Latest news about housing in Fremont, NC collected exclusively by city-data.com from local newspapers, TV, and radio stations

 | Lots of BMWs, Teslas, Mercedes now (223 replies) |
| Bay Area to Raleigh...but where? (88 replies) |
| Cary, Raleigh and Durham among the top 40 real estate markets nationally... Charlotte ranked 60th :shocked: (18 replies) |
| Goldsboro is growing again! (1077 replies) |
| Moving out of NC..where have you moved? (54 replies) |
| Brightleaf - New Homes in Durham on 70 (163 replies) |

Median year apartment built: 1974
Household type by relationship:
Households: 933- Male householders: 115 (57 living alone), Female householders: 321 (101 living alone)
134 spouses (134 opposite-sex spouses), 38 unmarried partners, (29 opposite-sex unmarried partners), 168 children (168 natural, 0 adopted, 0 stepchildren), 36 grandchildren, 26 brothers or sisters, 2 parents, 0 foster children, 15 other relatives, 37 non-relatives
- In group quarters: 32
Size of family households: 122 2-persons, 81 3-persons, 19 4-persons, 8 5-persons, 8 6-persons.
Size of nonfamily households: 151 1-person, 33 2-persons, 4 7-or-more-persons.
22 married couples with children.
148 single-parent households (6 men, 142 women).
93.0% of residents of Fremont speak English at home.
6.4% of residents speak Spanish at home (34% speak English very well, 5% speak English well, 60% speak English not well).
Foreign born population: 74 (7.9%)
(5.4% of them are naturalized citizens)
| Here: | 5.2 |
| State: | 6.4 |
| Here: | 4.9 |
| State: | 4.4 |

- Bedrooms in owner-occupied houses and condos in Fremont, North Carolina
- 0no bedroom
- 01 bedroom
- 862 bedrooms
- 1283 bedrooms
- 174 bedrooms
- 65+ bedrooms

- Bedrooms in renter-occupied apartments in Fremont, North Carolina
- 17no bedroom
- 121 bedroom
- 862 bedrooms
- 803 bedrooms
- 104 bedrooms
- 05+ bedrooms

- Cars and other vehicles available in Fremont in owner-occupied houses/condos
- 14no vehicle
- 851 vehicle
- 642 vehicles
- 633 vehicles
- 104 vehicles
- 05+ vehicles

- Cars and other vehicles available in Fremont in renter-occupied apartments
- 35no vehicle
- 1241 vehicle
- 202 vehicles
- 253 vehicles
- 04 vehicles
- 05+ vehicles

- Rooms in owner-occupied houses in Fremont, North Carolina
- 01 room
- 02 rooms
- 03 rooms
- 664 rooms
- 685 rooms
- 206 rooms
- 477 rooms
- 158 rooms
- 199+ rooms

- Rooms in renter-occupied apartments in Fremont, North Carolina
- 171 room
- 02 rooms
- 213 rooms
- 464 rooms
- 615 rooms
- 406 rooms
- 167 rooms
- 28 rooms
- 09+ rooms


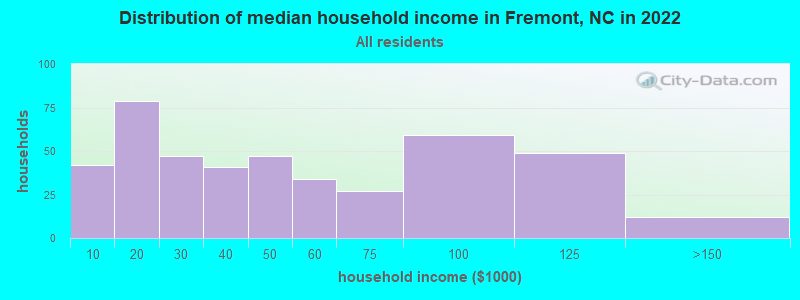
Fremont, NC household income distribution

- 42Less than $10,000
- 79$10,000 to $19,999
- 47$20,000 to $29,999
- 41$30,000 to $39,999
- 47$40,000 to $49,999
- 34$50,000 to $59,999
- 27$60,000 to $74,999
- 59$75,000 to $99,999
- 49$100,000 to $124,999
- 12$125,000 to $149,999
Home value of owner - occupied houses in 2022 in Fremont, NC
-
- 10Less than $10,000
- 15$25,000 to $29,999
- 19$40,000 to $49,999
- 3$50,000 to $59,999
- 25$60,000 to $69,999
- 13$70,000 to $79,999
- 16$80,000 to $89,999
- 13$90,000 to $99,999
- 20$100,000 to $124,999
- 24$125,000 to $149,999
- 46$150,000 to $174,999
- 9$175,000 to $199,999
- 1$200,000 to $249,999
- 11$250,000 to $299,999
- 5$300,000 to $399,999
Rent paid by renters in 2022 in Fremont, NC
-
- 50Less than $100
- 7$200 to $249
- 9$250 to $299
- 26$300 to $349
- 18$350 to $399
- 12$400 to $449
- 6$450 to $499
- 4$550 to $599
- 10$600 to $649
- 1$750 to $799
- 10$900 to $999
- 9$1,250 to $1,499
- 16No cash rent


Percentage of workers working in this county: 64.8%
Number of people working at home: 2 (0.5% of all workers)
Travel time to work (commute)
- Less than 5 minutes: 64
- 5 to 9 minutes: 1
- 10 to 14 minutes: 67
- 15 to 19 minutes: 68
- 20 to 24 minutes: 35
- 25 to 29 minutes: 38
- 30 to 34 minutes: 18
- 35 to 39 minutes: 6
- 40 to 44 minutes: 21
- 45 to 59 minutes: 22
- 60 to 89 minutes: 14
- 90 or more minutes: 29
Means of transportation to work:
- Drove a car alone: 387 (72.3%)
- Carpooled: 103 (19.3%)
- Walked: 27 (5.0%)
- Other means: 6 (1.1%)
- Worked at home: 12 (2.2%)


- Year of entry for the foreign-born population in Fremont, North Carolina
- 02010 or later
- 302000 to 2009
- 141990 to 1999
- 01980 to 1989
- 31970 to 1979
- 0Before 1970

First ancestries reported:
- English: 66 (18.6%)
- Irish: 22 (6.2%)
- American: 16 (4.5%)
- Polish: 12 (3.4%)
- Turkish: 6 (1.7%)
- Jordanian: 4 (1.1%)
- German: 4 (1.1%)
- Scotch-Irish: 4 (1.1%)
- Scottish: 3 (0.8%)
- European: 1 (0.3%)
Most common places of birth for foreign-born residents (%):
| Fremont: | 52.5% (32) |
| North Carolina: | 24.7% (214,776) |
| Fremont: | 13.1% (8) |
| North Carolina: | 0.3% (2,997) |
| Fremont: | 4.9% (3) |
| North Carolina: | 0.5% (4,315) |
| Fremont: | 4.9% (3) |
| North Carolina: | 0.2% (2,167) |
| Fremont: | 4.9% (3) |
| North Carolina: | 2.6% (22,964) |
Place of birth for U.S.-born residents:
- This state: 653
- Other state: 192
- Northeast: 60
- Midwest: 29
- South: 98
- West: 3
86.4% of Fremont residents lived in the same house 1 years ago.
Out of people who lived in different houses, 43.7% lived in this county.
Out of people who lived in different counties, 100.0% lived in North Carolina.
| Fremont: | 86.4% |
| State average: | 87.3% |
Education attainment for males 25 years and older:
- No schooling: 0
- Nursery to 4th grade: 16
- 5th and 6th grade: 6
- 7th and 8th grade: 8
- 9th grade: 20
- 10th grade: 16
- 11th grade: 2
- 12th grade, no diploma: 7
- High school graduate (or equivalency): 100
- Less than 1 year of college: 22
- Some college more than 1 year, no degree: 40
- Associate degree: 42
- Bachelor's degree: 7
- Master's degree: 20
- Professional school degree: 0
- Doctorate degree: 0

Education attainment for females 25 years and older:
- No schooling: 0
- Nursery to 4th grade: 0
- 5th and 6th grade: 0
- 7th and 8th grade: 0
- 9th grade: 11
- 10th grade: 34
- 11th grade: 16
- 12th grade, no diploma: 20
- High school graduate (or equivalency): 166
- Less than 1 year of college: 32
- Some college more than 1 year, no degree: 37
- Associate degree: 61
- Bachelor's degree: 44
- Master's degree: 7
- Professional school degree: 17
- Doctorate degree: 2


Housing units in structures:
- One, detached: 486
- Two: 10
- 3 or 4: 13
- 5 to 9: 10
- 10 to 19: 3
- 20 to 49: 9
- Mobile homes: 51
Housing units lacking complete kitchen facilities in 2022: 8.7%
House/condo owner moved in on average 6 years ago
Renter moved in on average 6 years ago

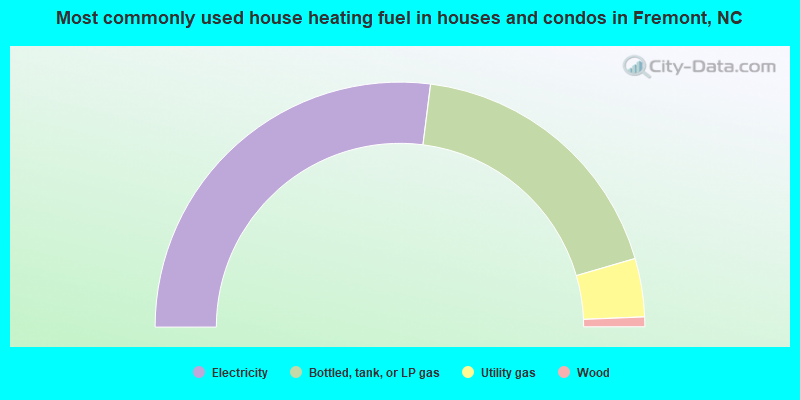
- 54.0%Electricity
- 37.0%Bottled, tank, or LP gas
- 7.7%Utility gas
- 1.3%Wood
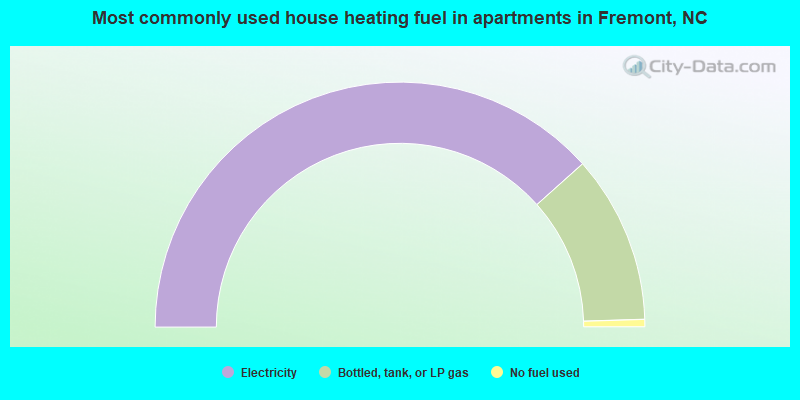
- 76.8%Electricity
- 22.2%Bottled, tank, or LP gas
- 1.0%No fuel used
Private vs. public school enrollment:
| Here: | 0.0% |
| North Carolina: | 13.8% |
| Here: | 11.1% |
| North Carolina: | 11.9% |
| Here: | 63.6% |
| North Carolina: | 19.3% |


