Friendship Village, MD (Maryland) Houses and Residents
| Friendship Village: | $511,375 |
| Maryland: | $398,100 |
Total population: 4,841 (Urban population: 4,429, Rural population: 0)
Houses: 3,182 (2,991 occupied: 938 owner occupied, 2,053 renter occupied)
| % of renters here: | 69% |
| State: | 32% |
Housing density: 57,823 houses/condos per square mile
Median price asked for vacant for-sale houses and condos in 2022 in this county: $868,821.
Median contract rent in 2022: over $2,000 (lower quartile is over $2,000, upper quartile is over $2,000)
Median rent asked for vacant for-rent units in 2022: $2,636
Median gross rent in Friendship Village, MD in 2022: over $2,000
Housing units in Friendship Village with a mortgage: 25 (0 second mortgage, 0 home equity loan, 0 both second mortgage and home equity loan)
Houses without a mortgage: 8
Compare current foreclosures near Friendship Village, MD:
| Photo | Address | Area | Beds / Baths | Price | Details |
|---|---|---|---|---|---|

|
#1
Eastern Ave NE
Washington, DC 20011
|
1,024 sq. feet
|
1 baths 3 beds |
$395,000
|
show details |

|
#2
Henson Ln
Temple Hills, MD 20748
|
1,566 sq. feet
|
2 baths 3 beds |
$300,000
|
show details |

|
#3
Buchanan St NE
Washington, DC 20017
|
1,240 sq. feet
|
2 baths 3 beds |
$325,000
|
show details |

|
#4
Crafford Pl
Fort Washington, MD 20744
|
1,890 sq. feet
|
1 baths 3 beds |
$265,900
|
show details |

|
#5
Fitzgibbon Ct
Bowie, MD 20721
|
1,300 sq. feet
|
2 baths 3 beds |
$369,200
|
show details |

|
#6
Interlachen Dr Apt 111
Silver Spring, MD 20906
|
965 sq. feet
|
1 baths 2 beds |
$148,000
|
show details |

|
#7
Hammersmith Cir
Silver Spring, MD 20906
|
1,152 sq. feet
|
1 baths 3 beds |
$328,600
|
show details |

|
#8
17th St NW Apt 504
Washington, DC 20009
|
800 sq. feet
|
1 baths 1 beds |
$405,000
|
show details |

|
#9
3rd St
Lanham, MD 20706
|
1,104 sq. feet
|
2 baths 3 beds |
$369,200
|
show details |

|
#10
Addison Rd
Capitol Heights, MD 20743
|
1,400 sq. feet
|
1 baths 3 beds |
$260,000
|
show details |
| Photo | Address | Area | Beds / Baths | Price | Details |
|---|---|---|---|---|---|

|
#11
Pooks Hill Rd Apt 1612s
Bethesda, MD 20814
|
1,250 sq. feet
|
1 baths 2 beds |
$289,000
|
show details |

|
#12
Brooke Knolls Rd
Gaithersburg, MD 20882
|
1,704 sq. feet
|
3 baths 4 beds |
$681,500
|
show details |

|
#13
Monroe St NW
Washington, DC 20010
|
- sq. feet
|
2 baths 2 beds |
$665,000
|
show details |

|
#14
Applegarth Pl
Capitol Heights, MD 20743
|
1,200 sq. feet
|
1 baths 3 beds |
$314,900
|
show details |

|
#15
Cathedral Ave NW Apt 108
Washington, DC 20016
|
765 sq. feet
|
1 baths 1 beds |
$269,900
|
show details |

|
#16
19th St NW
Washington, DC 20036
|
2,515 sq. feet
|
6 baths 8 beds |
$1,574,900
|
show details |

|
#17
Pickett Dr
Suitland, MD 20746
|
1,296 sq. feet
|
1 baths 2 beds |
$335,000
|
show details |

|
#18
Wilson Ln Apt 204
Mc Lean, VA 22102
|
925 sq. feet
|
1 baths 2 beds |
$359,900
|
show details |

|
#19
Mandan Rd Apt 103 Unit 621
Greenbelt, MD 20770
|
1,420 sq. feet
|
2 baths 3 beds |
$179,900
|
show details |

|
#20
T St SE Apt 3
Washington, DC 20020
|
- sq. feet
|
2 baths 4 beds |
$307,500
|
show details |
| Photo | Address | Area | Beds / Baths | Price | Details |
|---|---|---|---|---|---|

|
#21
Wilson Bridge Dr Unit #6770 A-2
Oxon Hill, MD 20745
|
- sq. feet
|
1 baths 1 beds |
$99,750
|
show details |

|
#22
Delaware Ave SW Apt N720
Washington, DC 20024
|
- sq. feet
|
1 baths 1 beds |
$149,900
|
show details |

|
#23
Oakwood St SE Apt B5
Washington, DC 20032
|
628 sq. feet
|
1 baths 1 beds |
show details | |

|
#24
Holbrook Ter NE
Washington, DC 20002
|
3,164 sq. feet
|
4 baths 8 beds |
show details | |

|
#25
Edsall Rd Ph 912
Alexandria, VA 22304
|
1,018 sq. feet
|
2 baths 2 beds |
show details | |

|
#26
Foote St NE
Washington, DC 20019
|
1,000 sq. feet
|
1 baths 3 beds |
show details | |

|
#27
Arkansas Ave
Herndon, VA 20170
|
1,025 sq. feet
|
1 baths 3 beds |
show details | |

|
#28
Deanwood Dr
Capitol Heights, MD 20743
|
640 sq. feet
|
1 baths 1 beds |
show details | |

|
#29
Cypress Tree Pl
Herndon, VA 20170
|
1,456 sq. feet
|
2 baths 3 beds |
show details | |

|
#30
Saddlehorn Ct
Burke, VA 22015
|
1,138 sq. feet
|
2 baths 3 beds |
show details |
| Photo | Address | Area | Beds / Baths | Price | Details |
|---|---|---|---|---|---|

|
#31
Windbreak Dr
Alexandria, VA 22306
|
1,360 sq. feet
|
3 baths 3 beds |
show details | |

|
#32
Forest Run Dr # B
District Heights, MD 20747
|
2,267 sq. feet
|
3 baths 3 beds |
show details | |

|
#33
Whitney Ave
District Heights, MD 20747
|
962 sq. feet
|
1 baths 4 beds |
show details | |

|
#34
Tremayne Pl Apt 309
Mc Lean, VA 22102
|
1,180 sq. feet
|
2 baths 2 beds |
show details | |

|
#35
Navahoe St
Hyattsville, MD 20783
|
1,068 sq. feet
|
2 baths 3 beds |
show details | |

|
#36
Counsellor Dr
Vienna, VA 22181
|
1,916 sq. feet
|
2 baths 5 beds |
show details | |

|
#37
Anacostia Rd SE
Washington, DC 20019
|
1,008 sq. feet
|
2 baths 4 beds |
show details | |

|
#38
S Arbory Ln
Laurel, MD 20707
|
1,283 sq. feet
|
3 baths 3 beds |
show details | |

|
#39
Rolling Spring Ct
Springfield, VA 22152
|
3,365 sq. feet
|
4 baths 4 beds |
show details | |

|
#40
28th Pkwy
Temple Hills, MD 20748
|
1,000 sq. feet
|
1 baths 3 beds |
show details |
| Photo | Address | Area | Beds / Baths | Price | Details |
|---|---|---|---|---|---|

|
#41
Blaine St NE
Washington, DC 20019
|
960 sq. feet
|
1 baths 3 beds |
show details | |

|
#42
S George Mason Dr Unit 918n
Falls Church, VA 22041
|
752 sq. feet
|
1 baths 1 beds |
show details | |

|
#43
Grant St NE
Washington, DC 20019
|
1,152 sq. feet
|
1 baths 3 beds |
show details | |

|
#44
Skyview Ln
Fairfax, VA 22031
|
1,400 sq. feet
|
3 baths 5 beds |
show details | |

|
#45
Byers St
Capitol Heights, MD 20743
|
2,238 sq. feet
|
2 baths 2 beds |
show details | |

|
#46
Brassie Pl Apt 201
Montgomery Village, MD 20886
|
1,054 sq. feet
|
2 baths 2 beds |
show details | |

|
#47
New York Ave NW Apt 402
Washington, DC 20001
|
842 sq. feet
|
1 baths 2 beds |
show details | |

|
#48
N Royal St
Alexandria, VA 22314
|
- sq. feet
|
1 baths 1 beds |
show details | |

|
#49
Barnaby St SE
Washington, DC 20032
|
1,664 sq. feet
|
2 baths 3 beds |
show details | |

|
Check over 1 million property listings on Foreclosure.com!
|
browse all offers | |||


Household type by relationship:
Households: 962,877- In family households: 818,609 (170,949 male householders, 73,949 female householders)
190,571 spouses, 287,257 children (273,230 natural, 6,853 adopted, 7,174 stepchildren), 12,668 grandchildren, 13,356 brothers or sisters, 12,424 parents, foster children, 20,293 other relatives, 29,004 non-relatives
- In nonfamily households: 144,268 (45,103 male householders (33,162 living alone)), 67,085 female householders (56,102 living alone)), 32,080 nonrelatives
- In group quarters: 8,900 (5,864 institutionalized population)
167,990 married couples with children.
37,951 single-parent households (7,214 men, 30,737 women).
61.5% of residents of Friendship Village speak English at home.
8.6% of residents speak Spanish at home (79% speak English very well, 14% speak English well, 5% speak English not well, 2% don't speak English at all).
17.0% of residents speak other Indo-European language at home (76% speak English very well, 14% speak English well, 7% speak English not well, 3% don't speak English at all).
7.8% of residents speak Asian or Pacific Island language at home (71% speak English very well, 21% speak English well, 8% speak English not well).
5.1% of residents speak other language at home (79% speak English very well, 21% speak English well).
Foreign born population: 2,535 (47.5%)
(48.4% of them are naturalized citizens)
| Here: | 4.4 |
| State: | 7.3 |
| Here: | 3.9 |
| State: | 4.2 |

- Bedrooms in owner-occupied houses and condos in Friendship Village, Maryland
- 9no bedroom
- 3811 bedroom
- 3622 bedrooms
- 1783 bedrooms
- 84 bedrooms
- 05+ bedrooms

- Bedrooms in renter-occupied apartments in Friendship Village, Maryland
- 411no bedroom
- 1,0501 bedroom
- 4872 bedrooms
- 1053 bedrooms
- 04 bedrooms
- 05+ bedrooms

- Cars and other vehicles available in Friendship Village in owner-occupied houses/condos
- 121no vehicle
- 6631 vehicle
- 1542 vehicles
- 03 vehicles
- 04 vehicles
- 05+ vehicles

- Cars and other vehicles available in Friendship Village in renter-occupied apartments
- 581no vehicle
- 1,2161 vehicle
- 2432 vehicles
- 133 vehicles
- 04 vehicles
- 05+ vehicles

- Rooms in owner-occupied houses in Friendship Village, Maryland
- 91 room
- 582 rooms
- 3043 rooms
- 1584 rooms
- 2505 rooms
- 1336 rooms
- 97 rooms
- 98 rooms
- 89+ rooms

- Rooms in renter-occupied apartments in Friendship Village, Maryland
- 3491 room
- 3522 rooms
- 5873 rooms
- 4094 rooms
- 2285 rooms
- 1116 rooms
- 177 rooms
- 08 rooms
- 09+ rooms


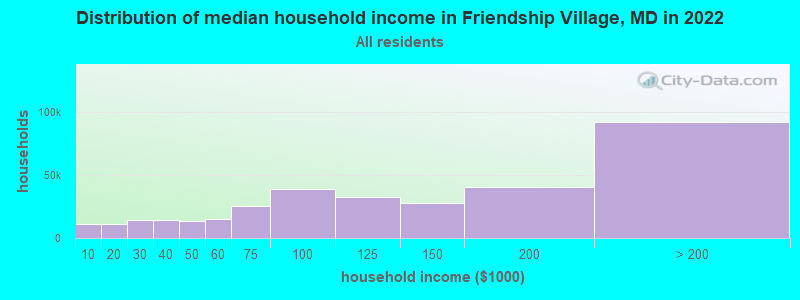
Friendship Village, MD household income distribution

- 11,118Less than $10,000
- 11,523$10,000 to $19,999
- 14,180$20,000 to $29,999
- 14,138$30,000 to $39,999
- 13,762$40,000 to $49,999
- 15,260$50,000 to $59,999
- 25,125$60,000 to $74,999
- 38,848$75,000 to $99,999
- 32,448$100,000 to $124,999
- 27,704$125,000 to $149,999
- 40,161$150,000 to $199,999
- 92,240$200,000 or more
Percentage of workers working in this county: 38.9%
Number of people working at home: 807 (28.1% of all workers)
Travel time to work (commute)
- Less than 5 minutes: 47
- 5 to 9 minutes: 114
- 10 to 14 minutes: 155
- 15 to 19 minutes: 257
- 20 to 24 minutes: 319
- 25 to 29 minutes: 164
- 30 to 34 minutes: 497
- 35 to 39 minutes: 193
- 40 to 44 minutes: 171
- 45 to 59 minutes: 240
- 60 to 89 minutes: 86
- 90 or more minutes: 9
Means of transportation to work:
- Drove a car alone: 915 (38.6%)
- Carpooled: 170 (7.2%)
- Bus or trolley bus: 55 (2.3%)
- Subway or elevated: 952 (40.2%)
- Taxi: 9 (0.4%)
- Bicycle: 8 (0.3%)
- Walked: 143 (6.0%)
- Worked at home: 119 (5.0%)


- Year of entry for the foreign-born population in Friendship Village, Maryland
- 5691995 to March 2000
- 1981990 to 1994
- 2201985 to 1989
- 971980 to 1984
- 1681975 to 1979
- 791970 to 1974
- 741965 to 1969
- 243Before 1965

First ancestries reported:
- Other: 1,673 (33.8%)
- German: 468 (9.5%)
- Irish: 433 (8.8%)
- English: 319 (6.5%)
- Italian: 262 (5.3%)
- Russian: 253 (5.1%)
- Arab: 211 (4.3%)
- French: 194 (3.9%)
- Polish: 176 (3.6%)
- United States: 145 (2.9%)
- Subsaharan African: 118 (2.4%)
- Greek: 111 (2.2%)
- Scottish: 97 (2.0%)
- Ukrainian: 70 (1.4%)
- Hungarian: 66 (1.3%)
- Scotch-Irish: 66 (1.3%)
- Swedish: 58 (1.2%)
- Czech: 55 (1.1%)
- Lithuanian: 35 (0.7%)
- Norwegian: 33 (0.7%)
- Dutch: 20 (0.4%)
- West Indian: 20 (0.4%)
- Danish: 17 (0.3%)
- Welsh: 17 (0.3%)
- Portuguese: 10 (0.2%)
- Slovak: 10 (0.2%)
- French Canadian: 8 (0.2%)
Most common places of birth for foreign-born residents (%):
| Friendship Village: | 6.6% (108) |
| Maryland: | 6.2% (32,276) |
| Friendship Village: | 5.9% (98) |
| Maryland: | 1.9% (9,733) |
| Friendship Village: | 5.6% (93) |
| Maryland: | 0.8% (4,318) |
| Friendship Village: | 5.2% (85) |
| Maryland: | 1.0% (5,354) |
| Friendship Village: | 4.2% (70) |
| Maryland: | 2.8% (14,555) |
| Friendship Village: | 4.1% (68) |
| Maryland: | 0.5% (2,477) |
| Friendship Village: | 3.5% (57) |
| Maryland: | 0.4% (2,147) |
| Friendship Village: | 3.4% (56) |
| Maryland: | 0.9% (4,697) |
| Friendship Village: | 3.2% (52) |
| Maryland: | 0.3% (1,463) |
| Friendship Village: | 3.0% (50) |
| Maryland: | 1.7% (8,678) |
| Friendship Village: | 3.0% (50) |
| Maryland: | 0.5% (2,526) |
| Friendship Village: | 2.9% (48) |
| Maryland: | 0.8% (4,214) |
| Friendship Village: | 2.7% (44) |
| Maryland: | 1.7% (8,723) |
| Friendship Village: | 2.6% (43) |
| Maryland: | 3.7% (19,287) |
| Friendship Village: | 2.4% (40) |
| Maryland: | 0.4% (1,949) |
| Friendship Village: | 2.4% (40) |
| Maryland: | 4.1% (21,007) |
| Friendship Village: | 2.4% (39) |
| Maryland: | 0.3% (1,434) |
| Friendship Village: | 2.4% (39) |
| Maryland: | 0.6% (2,895) |
| Friendship Village: | 2.3% (38) |
| Maryland: | 0.5% (2,771) |
| Friendship Village: | 1.9% (31) |
| Maryland: | 1.6% (8,407) |
| Friendship Village: | 1.8% (30) |
| Maryland: | 0.2% (1,259) |
| Friendship Village: | 1.8% (29) |
| Maryland: | 2.7% (14,206) |
| Friendship Village: | 1.7% (28) |
| Maryland: | 0.3% (1,565) |
| Friendship Village: | 1.7% (28) |
| Maryland: | 0.8% (4,250) |
| Friendship Village: | 1.7% (28) |
| Maryland: | 0.1% (685) |
| Friendship Village: | 1.6% (26) |
| Maryland: | 1.1% (5,594) |
| Friendship Village: | 1.5% (25) |
| Maryland: | 1.2% (6,266) |
Place of birth for U.S.-born residents:
- This state: 201
- Other state: 2,459
- Northeast: 1,230
- Midwest: 408
- South: 598
- West: 223
53% of Friendship Village residents lived in the same house 5 years ago.
Out of people who lived in different houses, 28% lived in this county.
Out of people who lived in different counties, 8% lived in Maryland.
Education attainment for males 25 years and older:
- No schooling: 4
- Nursery to 4th grade: 0
- 5th and 6th grade: 0
- 7th and 8th grade: 9
- 9th grade: 7
- 10th grade: 0
- 11th grade: 6
- 12th grade, no diploma: 0
- High school graduate (or equivalency): 93
- Less than 1 year of college: 8
- Some college more than 1 year, no degree: 101
- Associate degree: 34
- Bachelor's degree: 415
- Master's degree: 364
- Professional school degree: 259
- Doctorate degree: 261

Education attainment for females 25 years and older:
- No schooling: 10
- Nursery to 4th grade: 0
- 5th and 6th grade: 52
- 7th and 8th grade: 10
- 9th grade: 14
- 10th grade: 21
- 11th grade: 19
- 12th grade, no diploma: 18
- High school graduate (or equivalency): 295
- Less than 1 year of college: 63
- Some college more than 1 year, no degree: 201
- Associate degree: 88
- Bachelor's degree: 738
- Master's degree: 525
- Professional school degree: 215
- Doctorate degree: 171


Housing units in structures:
- One, detached: 20
- One, attached: 25
- 10 to 19: 9
- 20 to 49: 9
- 50 or more: 3,119

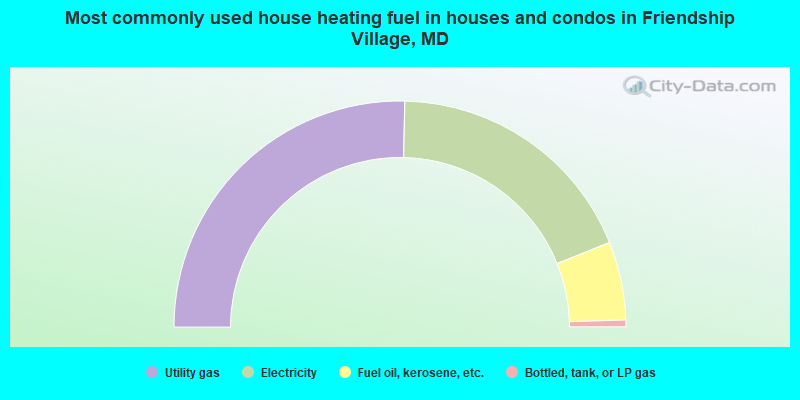
- 50.7%Utility gas
- 37.1%Electricity
- 11.2%Fuel oil, kerosene, etc.
- 1.0%Bottled, tank, or LP gas
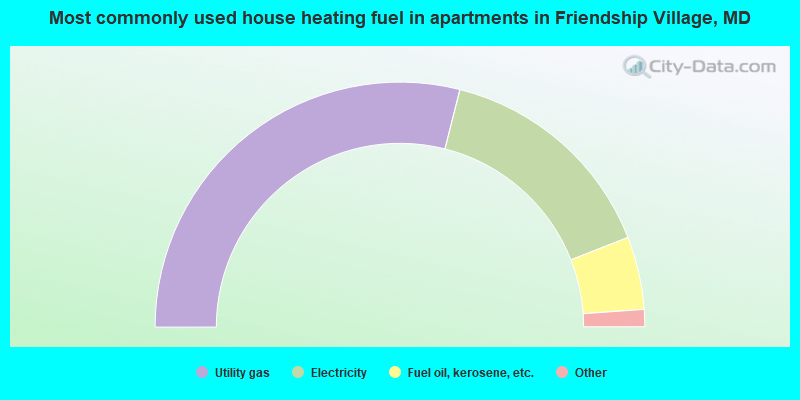
- 57.9%Utility gas
- 30.2%Electricity
- 9.6%Fuel oil, kerosene, etc.
- 1.1%Bottled, tank, or LP gas
- 0.8%No fuel used
- 0.4%Other fuel
Private vs. public school enrollment:
| Here: | 22.0% |
| Maryland: | 14.8% |
| Here: | 41.8% |
| Maryland: | 13.3% |
| Here: | 27.9% |
| Maryland: | 21.7% |


