Front Royal, VA (Virginia) Houses and Residents
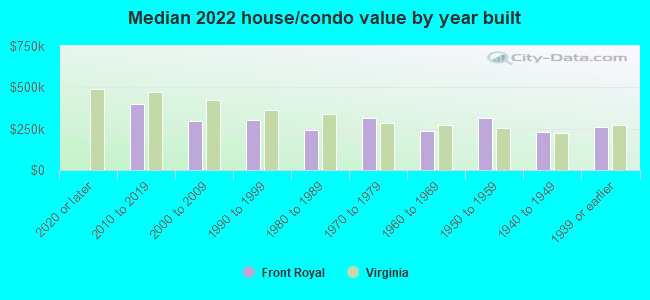
| Front Royal: | $291,010 |
| Virginia: | $365,700 |
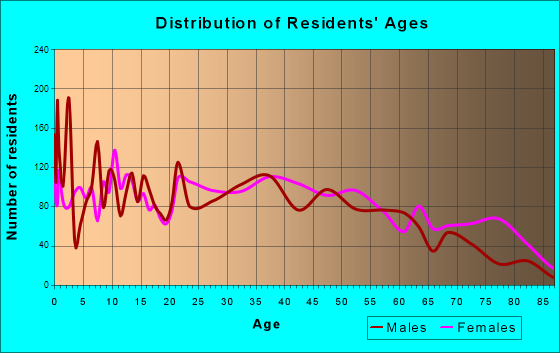
Total population: 15,038 (Urban population: 13,046 (all inside urban clusters), Rural population: 736 (all nonfarm))
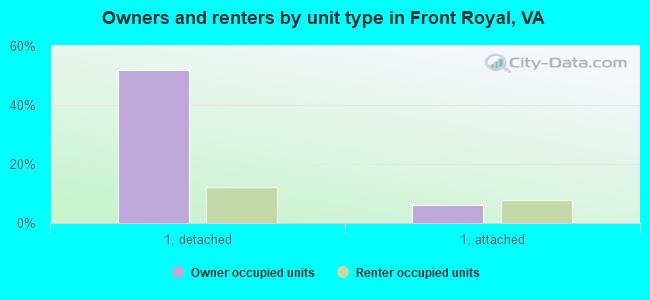
Houses: 6,251 (5,845 occupied: 3,435 owner occupied, 2,473 renter occupied)
| % of renters here: | 42% |
| State: | 33% |
Housing density: 674 houses/condos per square mile
Median price asked for vacant for-sale houses and condos in 2022: $536,164.
Median contract rent in 2022: $930 (lower quartile is $680, upper quartile is $1,137)
Median rent asked for vacant for-rent units in 2022: $1,218
Median gross rent in Front Royal, VA in 2022: $1,096
Housing units in Front Royal with a mortgage: 2,441 (200 second mortgage, 0 home equity loan, 183 both second mortgage and home equity loan)
Houses without a mortgage: 85
Median household income for houses/condos with a mortgage: $92,964
Median household income for apartments without a mortgage: $63,020
Median monthly housing costs: $1,121
Compare current foreclosures in Front Royal, VA:
| Photo | Address | Area | Beds / Baths | Price | Details |
|---|---|---|---|---|---|

|
#1
Old Oak Ln
Front Royal, VA 22630
|
1,622 sq. feet
|
2 baths 2 beds |
$280,800
|
show details |

|
#2
Mallard Pl
Front Royal, VA 22630
|
1,056 sq. feet
|
2 baths 3 beds |
show details | |

|
#3
Howellsville Rd
Front Royal, VA 22630
|
- sq. feet
|
2 baths 3 beds |
show details | |

|
#4
Summit Ave
Front Royal, VA 22630
|
1,766 sq. feet
|
1 baths 4 beds |
show details | |

|
#5
W Commonwealth Dr
Front Royal, VA 22630
|
2,652 sq. feet
|
3 baths 5 beds |
show details | |

|
#6
Scott St
Front Royal, VA 22630
|
1,382 sq. feet
|
1 baths 4 beds |
show details | |

|
#7
Wakeman Mill Rd
Front Royal, VA 22630
|
1,684 sq. feet
|
2 baths 3 beds |
show details | |

|
#8
Cherrydale Ave
Front Royal, VA 22630
|
1,008 sq. feet
|
1 baths 2 beds |
show details | |

|
#9
Strasburg Rd
Front Royal, VA 22630
|
2,595 sq. feet
|
3 baths 3 beds |
show details | |

|
#10
Duncan Ave
Front Royal, VA 22630
|
1,139 sq. feet
|
1 baths 2 beds |
show details |
| Photo | Address | Area | Beds / Baths | Price | Details |
|---|---|---|---|---|---|

|
#11
Westminster Dr
Front Royal, VA 22630
|
1,144 sq. feet
|
2 baths 3 beds |
show details | |

|
#12
S Charles St
Front Royal, VA 22630
|
2,648 sq. feet
|
3 baths 3 beds |
show details | |

|
#13
Fletcher St
Front Royal, VA 22630
|
1,064 sq. feet
|
1 baths 2 beds |
show details | |

|
#14
W 13th St
Front Royal, VA 22630
|
1,080 sq. feet
|
1 baths 3 beds |
show details | |

|
#15
Ashby Station Rd
Front Royal, VA 22630
|
2,568 sq. feet
|
2 baths 4 beds |
show details | |

|
#16
E 14th St
Front Royal, VA 22630
|
1,086 sq. feet
|
1 baths 3 beds |
show details | |

|
#17
Drummer Hill Rd
Front Royal, VA 22630
|
1,680 sq. feet
|
2 baths 3 beds |
show details | |

|
#18
Massanutten Mountain Dr
Front Royal, VA 22630
|
2,016 sq. feet
|
3 baths 3 beds |
show details | |

|
#19
Washington Ave
Front Royal, VA 22630
|
1,527 sq. feet
|
2 baths 2 beds |
show details | |

|
#20
Locust Tree Ln
Front Royal, VA 22630
|
1,672 sq. feet
|
3 baths 3 beds |
show details |
| Photo | Address | Area | Beds / Baths | Price | Details |
|---|---|---|---|---|---|

|
#21
N Royal Ave
Front Royal, VA 22630
|
3,457 sq. feet
|
3 baths - beds |
show details | |

|
#22
Winchester Rd
Front Royal, VA 22630
|
- sq. feet
|
- baths - beds |
show details | |

|
#23
William St
Front Royal, VA 22630
|
- sq. feet
|
- baths - beds |
show details | |

|
#24
Oden St
Front Royal, VA 22630
|
- sq. feet
|
- baths - beds |
show details | |

|
#25
Skyline Pl
Front Royal, VA 22630
|
- sq. feet
|
- baths - beds |
show details | |

|
#26
Oden St
Front Royal, VA 22630
|
- sq. feet
|
- baths - beds |
show details | |

|
#27
Virginia Ave # B
Front Royal, VA 22630
|
- sq. feet
|
- baths - beds |
show details | |

|
#28
Luray Ave
Front Royal, VA 22630
|
- sq. feet
|
- baths - beds |
show details | |

|
#29
James St
Front Royal, VA 22630
|
- sq. feet
|
- baths - beds |
show details | |

|
#30
Oden St
Front Royal, VA 22630
|
- sq. feet
|
- baths - beds |
show details |
| Photo | Address | Area | Beds / Baths | Price | Details |
|---|---|---|---|---|---|

|
#31
Driver Sq
Front Royal, VA 22630
|
- sq. feet
|
- baths - beds |
show details | |

|
#32
W 13th St # B
Front Royal, VA 22630
|
- sq. feet
|
- baths - beds |
show details | |

|
#33
Westminster Dr
Front Royal, VA 22630
|
- sq. feet
|
- baths - beds |
show details | |

|
#34
Larkin Ridge Rd
Front Royal, VA 22630
|
- sq. feet
|
- baths - beds |
show details | |

|
#35
Queens Hwy
Front Royal, VA 22630
|
- sq. feet
|
- baths - beds |
show details | |

|
Check over 1 million property listings on Foreclosure.com!
|
browse all offers | |||


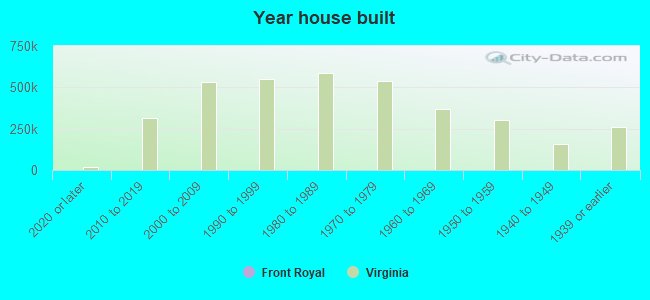
Median year apartment built: 1974
Household type by relationship:
Households: 15,167- Male householders: 2,849 (740 living alone), Female householders: 2,940 (949 living alone)
2,356 spouses (2,352 opposite-sex spouses), 679 unmarried partners, (652 opposite-sex unmarried partners), 4,178 children (4,011 natural, 57 adopted, 109 stepchildren), 577 grandchildren, 271 brothers or sisters, 94 parents, 0 foster children, 439 other relatives, 538 non-relatives
- In group quarters: 240
Size of family households: 1,187 2-persons, 1,209 3-persons, 547 4-persons, 279 5-persons, 289 6-persons, 137 7-or-more-persons.
Size of nonfamily households: 1,738 1-person, 471 2-persons, 40 3-persons, 38 4-persons.
1,624 married couples with children.
1,263 single-parent households (403 men, 860 women).
89.5% of residents of Front Royal speak English at home.
7.5% of residents speak Spanish at home (78% speak English very well, 12% speak English well, 6% speak English not well, 4% don't speak English at all).
2.6% of residents speak other Indo-European language at home (12% speak English very well, 56% speak English well, 17% speak English not well, 15% don't speak English at all).
0.6% of residents speak Asian or Pacific Island language at home (40% speak English very well, 34% speak English well, 26% speak English not well).
Foreign born population: 1,048 (6.9%)
(39.0% of them are naturalized citizens)
| Here: | 6.6 |
| State: | 7.0 |
| Here: | 4.4 |
| State: | 4.3 |
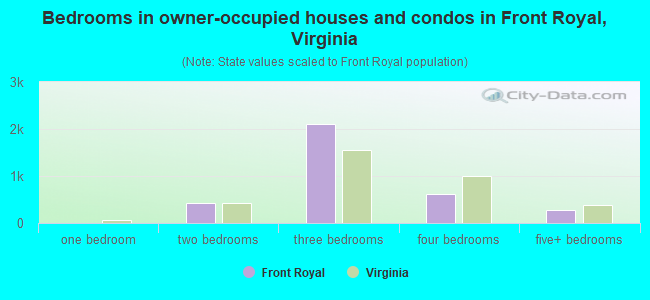
- Bedrooms in owner-occupied houses and condos in Front Royal, Virginia
- 7no bedroom
- 01 bedroom
- 4172 bedrooms
- 2,1113 bedrooms
- 6154 bedrooms
- 2865+ bedrooms
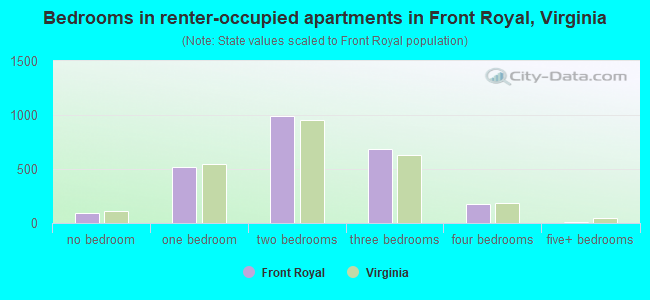
- Bedrooms in renter-occupied apartments in Front Royal, Virginia
- 91no bedroom
- 5161 bedroom
- 9942 bedrooms
- 6863 bedrooms
- 1764 bedrooms
- 105+ bedrooms
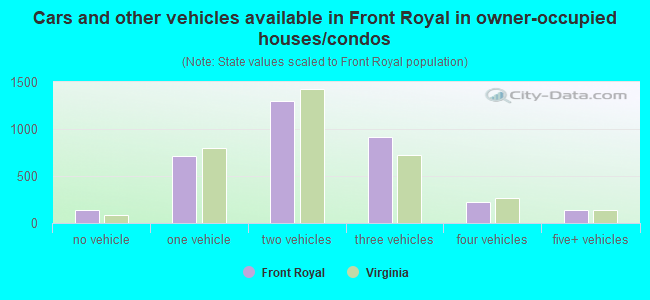
- Cars and other vehicles available in Front Royal in owner-occupied houses/condos
- 140no vehicle
- 7131 vehicle
- 1,2972 vehicles
- 9173 vehicles
- 2274 vehicles
- 1425+ vehicles
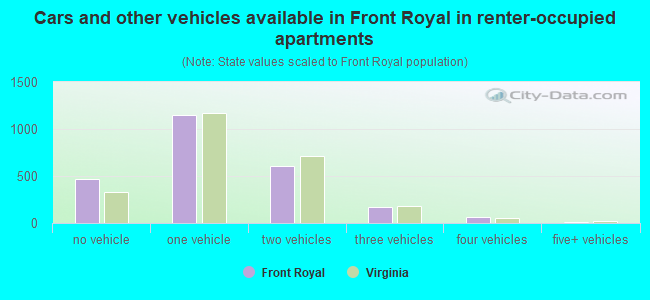
- Cars and other vehicles available in Front Royal in renter-occupied apartments
- 471no vehicle
- 1,1491 vehicle
- 6022 vehicles
- 1733 vehicles
- 674 vehicles
- 125+ vehicles
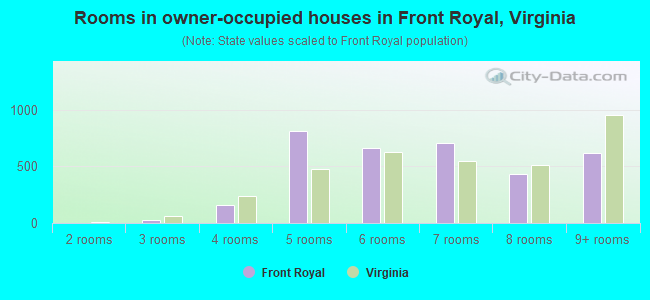
- Rooms in owner-occupied houses in Front Royal, Virginia
- 71 room
- 02 rooms
- 273 rooms
- 1614 rooms
- 8135 rooms
- 6636 rooms
- 7087 rooms
- 4348 rooms
- 6239+ rooms
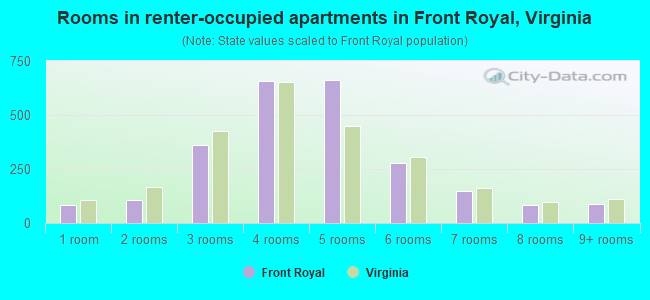
- Rooms in renter-occupied apartments in Front Royal, Virginia
- 821 room
- 1082 rooms
- 3633 rooms
- 6594 rooms
- 6615 rooms
- 2786 rooms
- 1497 rooms
- 848 rooms
- 899+ rooms
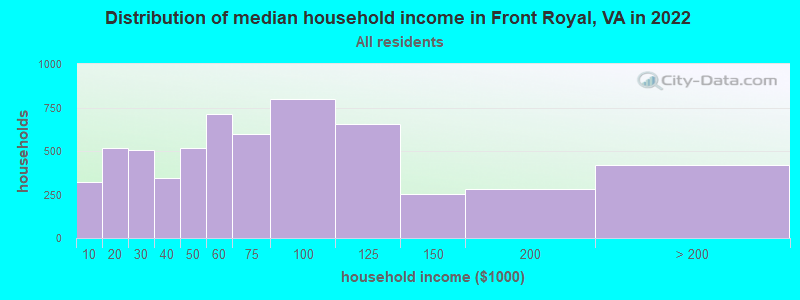
Front Royal, VA household income distribution

- 320Less than $10,000
- 519$10,000 to $19,999
- 508$20,000 to $29,999
- 345$30,000 to $39,999
- 518$40,000 to $49,999
- 713$50,000 to $59,999
- 599$60,000 to $74,999
- 799$75,000 to $99,999
- 653$100,000 to $124,999
- 253$125,000 to $149,999
- 281$150,000 to $199,999
- 422$200,000 or more
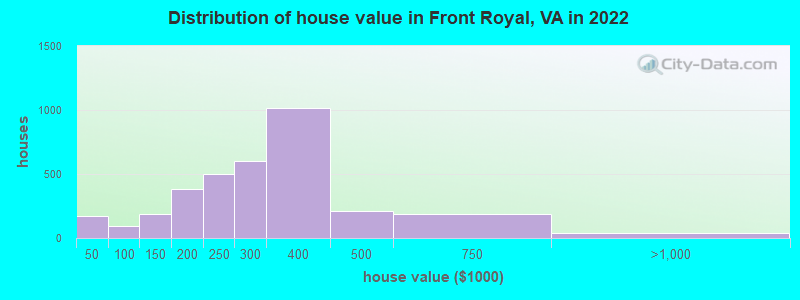
Home value of owner - occupied houses in 2022 in Front Royal, VA
-
- 55Less than $10,000
- 19$15,000 to $19,999
- 14$20,000 to $24,999
- 25$25,000 to $29,999
- 55$40,000 to $49,999
- 20$70,000 to $79,999
- 15$80,000 to $89,999
- 106$100,000 to $124,999
- 77$125,000 to $149,999
- 152$150,000 to $174,999
- 233$175,000 to $199,999
- 496$200,000 to $249,999
- 599$250,000 to $299,999
- 1,016$300,000 to $399,999
- 210$400,000 to $499,999
- 189$500,000 to $749,999
- 25$750,000 to $999,999
- 14$2,000,000 or more
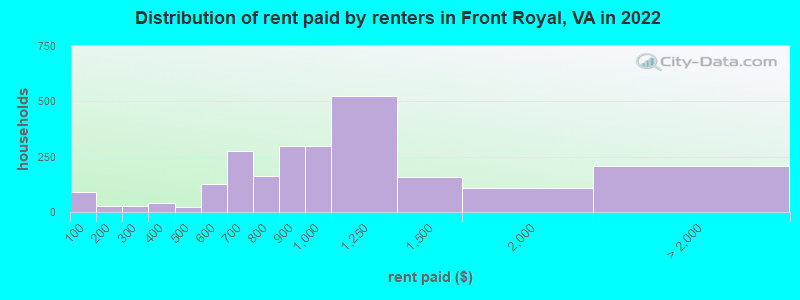
Rent paid by renters in 2022 in Front Royal, VA
-
- 91Less than $100
- 21$100 to $149
- 7$150 to $199
- 26$250 to $299
- 21$300 to $349
- 19$350 to $399
- 16$400 to $449
- 6$450 to $499
- 72$500 to $549
- 55$550 to $599
- 138$600 to $649
- 137$650 to $699
- 47$700 to $749
- 113$750 to $799
- 300$800 to $899
- 298$900 to $999
- 522$1,000 to $1,249
- 160$1,250 to $1,499
- 109$1,500 to $1,999
- 45$3,500 or more
- 164No cash rent
Percentage of workers working in this county: 54.0%
Number of people working at home: 687 (9.7% of all workers)
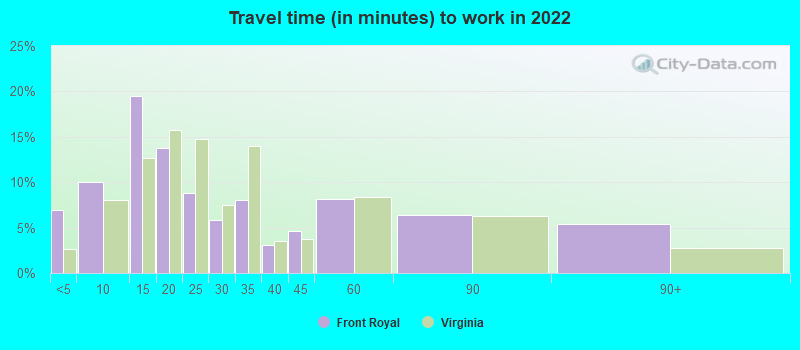
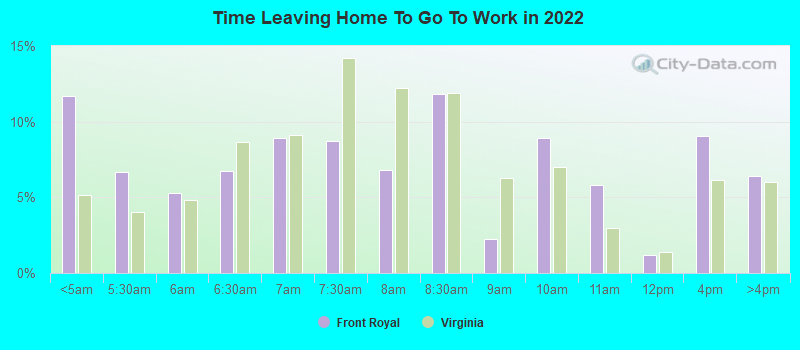
Travel time to work (commute)
- Less than 5 minutes: 498
- 5 to 9 minutes: 676
- 10 to 14 minutes: 844
- 15 to 19 minutes: 509
- 20 to 24 minutes: 425
- 25 to 29 minutes: 252
- 30 to 34 minutes: 798
- 35 to 39 minutes: 359
- 40 to 44 minutes: 220
- 45 to 59 minutes: 287
- 60 to 89 minutes: 1,003
- 90 or more minutes: 314
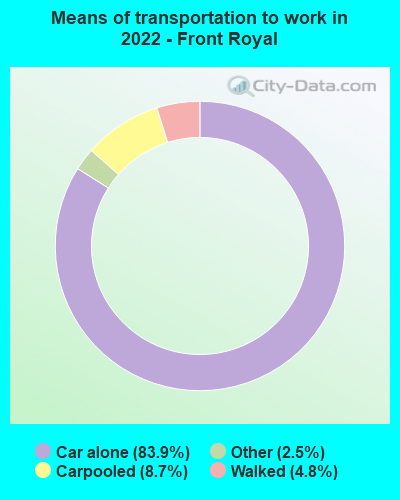
Means of transportation to work:
- Drove a car alone: 5,600 (74.3%)
- Carpooled: 592 (7.9%)
- Taxi: 202 (2.7%)
- Walked: 345 (4.6%)
- Worked at home: 687 (9.1%)
- Unemployment by race in 2022
- Unemployment rate for White non-Hispanic residents
- 8.3%Males
- 4.7%Females
- Unemployment rate for Asian residents
- 50.4%Males
- Unemployment rate for other race residents
- 7.3%Males
- 9.3%Females
- Unemployment rate for two or more race residents
- 3.8%Males
- 0.7%Females
- Unemployment rate for Hispanic or Latino residents
- 4.9%Females
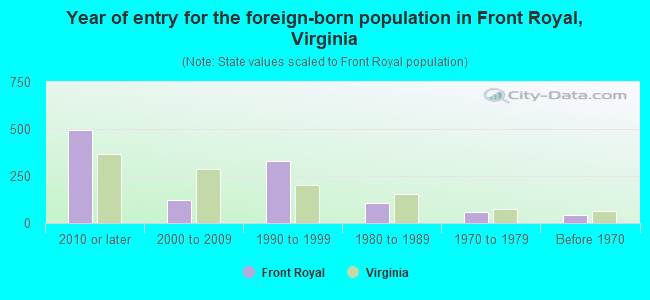
- Year of entry for the foreign-born population in Front Royal, Virginia
- 4942010 or later
- 1242000 to 2009
- 3281990 to 1999
- 1041980 to 1989
- 611970 to 1979
- 42Before 1970
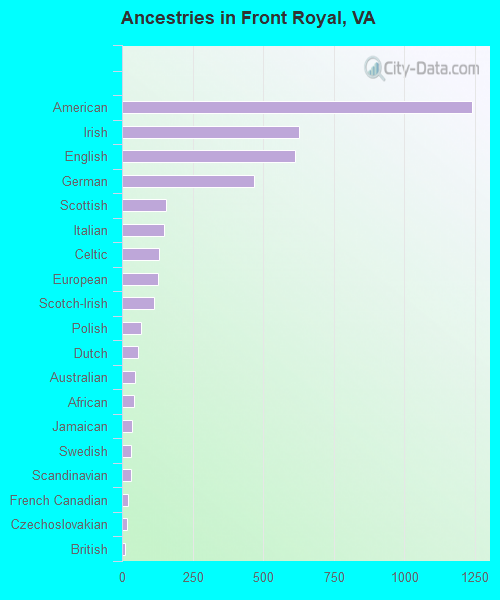
First ancestries reported:
- American: 1,239 (19.4%)
- Irish: 626 (9.8%)
- English: 613 (9.6%)
- German: 468 (7.3%)
- Scottish: 156 (2.4%)
- Italian: 150 (2.3%)
- Celtic: 130 (2.0%)
- European: 129 (2.0%)
- Scotch-Irish: 113 (1.8%)
- Polish: 67 (1.0%)
- Dutch: 58 (0.9%)
- Australian: 45 (0.7%)
- African: 42 (0.7%)
- Jamaican: 36 (0.6%)
- Swedish: 32 (0.5%)
- Scandinavian: 31 (0.5%)
- French Canadian: 21 (0.3%)
- Czechoslovakian: 16 (0.3%)
- British: 12 (0.2%)
- French: 11 (0.2%)
- Northern European: 10 (0.2%)
- Portuguese: 6 (0.09%)
- Ukrainian: 4 (0.06%)
Most common places of birth for foreign-born residents (%):
| Front Royal: | 31.0% (325) |
| Virginia: | 9.9% (107,534) |
| Front Royal: | 11.4% (119) |
| Virginia: | 2.3% (24,582) |
| Front Royal: | 10.8% (113) |
| Virginia: | 2.4% (26,366) |
| Front Royal: | 6.8% (71) |
| Virginia: | 5.3% (57,498) |
| Front Royal: | 6.0% (63) |
| Virginia: | 0.2% (2,350) |
| Front Royal: | 4.3% (45) |
| Virginia: | 1.0% (10,734) |
| Front Royal: | 4.1% (43) |
| Virginia: | 3.3% (35,938) |
| Front Royal: | 4.0% (42) |
| Virginia: | 0.8% (8,805) |
| Front Royal: | 3.1% (32) |
| Virginia: | 4.8% (52,629) |
| Front Royal: | 3.0% (31) |
| Virginia: | 0.1% (1,352) |
| Front Royal: | 1.6% (17) |
| Virginia: | 0.7% (7,672) |
Place of birth for U.S.-born residents:
- This state: 9,215
- Other state: 4,689
- Northeast: 1,416
- Midwest: 666
- South: 2,030
- West: 576
88.7% of Front Royal residents lived in the same house 1 years ago.
Out of people who lived in different houses, 26.3% lived in this county.
Out of people who lived in different counties, 78.9% lived in Virginia.
| Front Royal: | 88.7% |
| State average: | 86.6% |
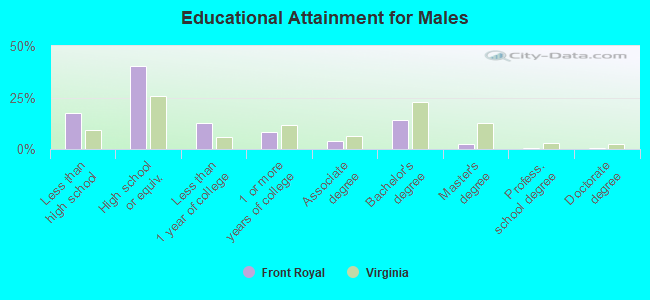
Education attainment for males 25 years and older:
- No schooling: 166
- Nursery to 4th grade: 17
- 5th and 6th grade: 62
- 7th and 8th grade: 56
- 9th grade: 114
- 10th grade: 193
- 11th grade: 136
- 12th grade, no diploma: 140
- High school graduate (or equivalency): 2,021
- Less than 1 year of college: 625
- Some college more than 1 year, no degree: 419
- Associate degree: 202
- Bachelor's degree: 709
- Master's degree: 117
- Professional school degree: 32
- Doctorate degree: 18
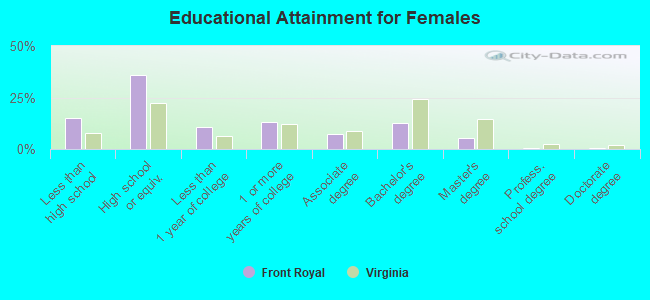
Education attainment for females 25 years and older:
- No schooling: 181
- Nursery to 4th grade: 14
- 5th and 6th grade: 32
- 7th and 8th grade: 117
- 9th grade: 81
- 10th grade: 155
- 11th grade: 150
- 12th grade, no diploma: 92
- High school graduate (or equivalency): 1,977
- Less than 1 year of college: 593
- Some college more than 1 year, no degree: 714
- Associate degree: 390
- Bachelor's degree: 689
- Master's degree: 282
- Professional school degree: 33
- Doctorate degree: 19
Housing units in structures:
- One, detached: 3,953
- One, attached: 826
- Two: 220
- 3 or 4: 396
- 5 to 9: 282
- 10 to 19: 399
- 20 to 49: 78
- 50 or more: 29
- Mobile homes: 65
Housing units lacking complete kitchen facilities in 2022: 2.4%
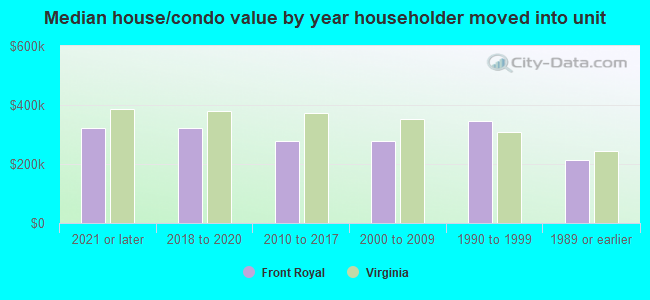
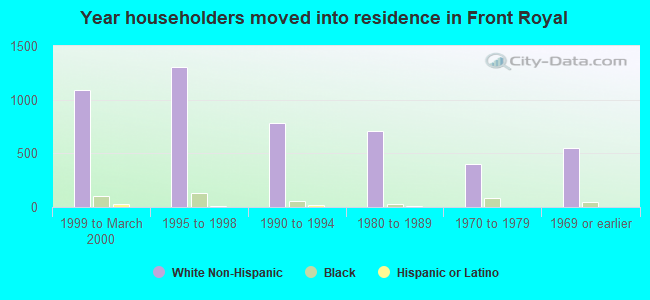
House/condo owner moved in on average 13 years ago
Renter moved in on average 4 years ago
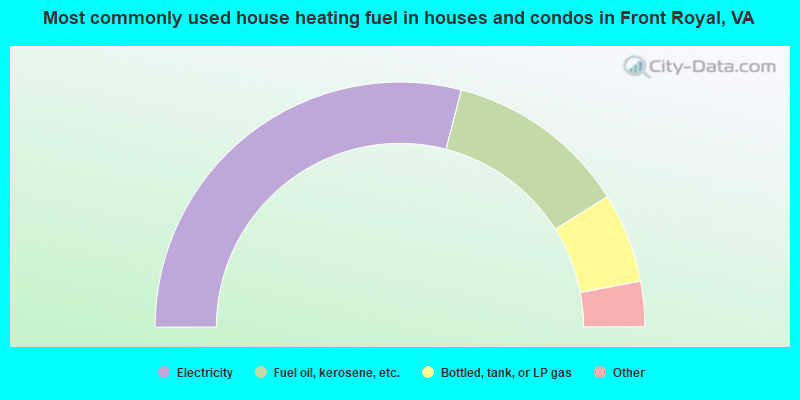
- 58.2%Electricity
- 24.1%Fuel oil, kerosene, etc.
- 11.9%Bottled, tank, or LP gas
- 2.2%Wood
- 1.4%Other fuel
- 1.2%Utility gas
- 1.0%No fuel used
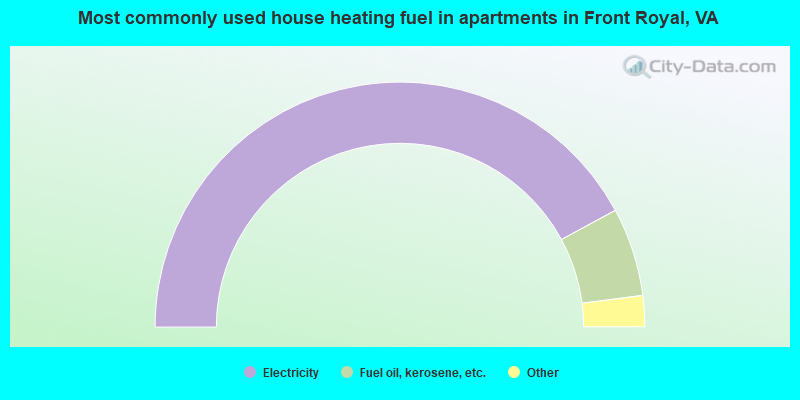
- 84.2%Electricity
- 11.7%Fuel oil, kerosene, etc.
- 2.6%Bottled, tank, or LP gas
- 0.7%No fuel used
- 0.5%Wood
- 0.4%Utility gas
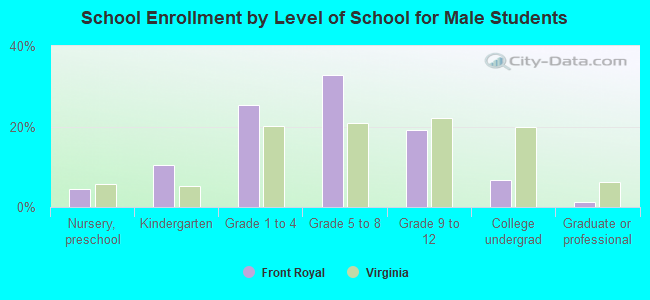
Private vs. public school enrollment:
| Here: | 3.9% |
| Virginia: | 13.2% |
| Here: | 5.4% |
| Virginia: | 10.2% |
| Here: | 14.6% |
| Virginia: | 18.7% |