Fruitport, MI (Michigan) Houses and Residents
| Fruitport: | $192,177 |
| Michigan: | $224,400 |
Total population: 1,104 (All urban)
Houses: 537 (490 occupied: 480 owner occupied, 11 renter occupied)
| % of renters here: | 2% |
| State: | 27% |
Housing density: 572 houses/condos per square mile
Median price asked for vacant for-sale houses and condos in 2022 in this county: $113,156.
Median contract rent in 2022: $905 (lower quartile is $720, upper quartile is $935)
Median rent asked for vacant for-rent units in 2022: $560
Median gross rent in Fruitport, MI in 2022: $1,108
Housing units in Fruitport with a mortgage: 268 (29 second mortgage, 0 home equity loan, 28 both second mortgage and home equity loan)
Houses without a mortgage: 14
Median household income for houses/condos with a mortgage: $86,018
Median household income for apartments without a mortgage: $72,829
Median monthly housing costs: $865
Compare current foreclosures near Fruitport, MI:
| Photo | Address | Area | Beds / Baths | Price | Details |
|---|---|---|---|---|---|

|
#1
Heights Ravenna Rd
Fruitport, MI 49415
|
2,446 sq. feet
|
1 baths 4 beds |
show details | |

|
#2
Fruitport Rd
Fruitport, MI 49415
|
1,568 sq. feet
|
2 baths 3 beds |
show details | |

|
#3
S Hilton Park Rd
Fruitport, MI 49415
|
1,008 sq. feet
|
1 baths 3 beds |
show details | |

|
#4
N 2nd Ave
Fruitport, MI 49415
|
1,794 sq. feet
|
1 baths 4 beds |
show details | |

|
#5
N 6th Ave
Fruitport, MI 49415
|
1,568 sq. feet
|
2 baths 4 beds |
show details | |

|
#6
E Mount Garfield Rd
Fruitport, MI 49415
|
832 sq. feet
|
1 baths 2 beds |
show details | |

|
#7
Bridge St
Fruitport, MI 49415
|
1,644 sq. feet
|
1 baths - beds |
show details | |

|
#8
Heights Ravenna Rd
Fruitport, MI 49415
|
- sq. feet
|
- baths - beds |
show details | |

|
#9
Marcoux Ave
Muskegon, MI 49442
|
702 sq. feet
|
1 baths 2 beds |
show details | |

|
#10
Columbus Ave
Grand Haven, MI 49417
|
1,318 sq. feet
|
1 baths 4 beds |
show details |
| Photo | Address | Area | Beds / Baths | Price | Details |
|---|---|---|---|---|---|

|
#11
N Robinhood Dr
Muskegon, MI 49445
|
1,436 sq. feet
|
2 baths 3 beds |
show details | |

|
#12
Lakeshore Dr
Grand Haven, MI 49417
|
2,900 sq. feet
|
3 baths 4 beds |
show details | |

|
#13
Mccracken St
Muskegon, MI 49441
|
1,200 sq. feet
|
1 baths 3 beds |
show details | |

|
#14
Lakeshore Dr
Muskegon, MI 49441
|
1,880 sq. feet
|
2 baths 4 beds |
show details | |

|
#15
Sisson St
Muskegon, MI 49441
|
1,235 sq. feet
|
1 baths 4 beds |
show details | |

|
#16
Catherine Ave
Muskegon, MI 49442
|
1,308 sq. feet
|
1 baths 4 beds |
show details | |

|
#17
Lemuel St
Muskegon, MI 49444
|
- sq. feet
|
1 baths 3 beds |
show details | |

|
#18
Irwin Ave
Muskegon, MI 49442
|
1,152 sq. feet
|
2 baths 3 beds |
show details | |

|
#19
Kenneth St
Muskegon, MI 49442
|
1,229 sq. feet
|
1 baths 2 beds |
show details | |

|
#20
W Barney Ave
Muskegon, MI 49441
|
1,027 sq. feet
|
1 baths 3 beds |
show details |
| Photo | Address | Area | Beds / Baths | Price | Details |
|---|---|---|---|---|---|

|
#21
Heights Ravenna Rd
Muskegon, MI 49444
|
- sq. feet
|
1 baths 2 beds |
show details | |

|
#22
W Summit Ave
Muskegon, MI 49441
|
1,383 sq. feet
|
2 baths 4 beds |
show details | |

|
#23
Langeland Ave
Muskegon, MI 49442
|
1,128 sq. feet
|
1 baths 3 beds |
show details | |

|
#24
Bolen Rd
Muskegon, MI 49442
|
1,158 sq. feet
|
1 baths 3 beds |
show details | |

|
#25
Nielwood Dr
Muskegon, MI 49445
|
1,200 sq. feet
|
1 baths 3 beds |
show details | |

|
#26
Taylor Ave
Grand Haven, MI 49417
|
950 sq. feet
|
2 baths 3 beds |
show details | |

|
#27
Esther Ave
Muskegon, MI 49441
|
1,144 sq. feet
|
1 baths 3 beds |
show details | |

|
#28
W Moore Rd
Ravenna, MI 49451
|
- sq. feet
|
2 baths 3 beds |
show details | |

|
#29
108th Ave
Zeeland, MI 49464
|
- sq. feet
|
2 baths 3 beds |
show details | |

|
#30
Whitehall Rd
Muskegon, MI 49445
|
1,460 sq. feet
|
1 baths 3 beds |
show details |
| Photo | Address | Area | Beds / Baths | Price | Details |
|---|---|---|---|---|---|

|
#31
Holton Rd
Muskegon, MI 49445
|
1,300 sq. feet
|
2 baths 3 beds |
show details | |

|
#32
148th Ave
Spring Lake, MI 49456
|
1,748 sq. feet
|
2 baths 3 beds |
show details | |

|
#33
W Mcmillan Rd
Muskegon, MI 49445
|
1,680 sq. feet
|
2 baths 3 beds |
show details | |

|
#34
Aurora Ave
Muskegon, MI 49442
|
840 sq. feet
|
1 baths 2 beds |
show details | |

|
#35
Emerson Ave
Muskegon, MI 49442
|
1,513 sq. feet
|
2 baths 5 beds |
show details | |

|
#36
E Forest Ave
Muskegon, MI 49442
|
788 sq. feet
|
1 baths 2 beds |
show details | |

|
#37
Jefferson St
Muskegon, MI 49441
|
2,432 sq. feet
|
2 baths 3 beds |
show details | |

|
#38
Lee Ave
Muskegon, MI 49444
|
1,452 sq. feet
|
1 baths 4 beds |
show details | |

|
#39
Le Roux Rd
Muskegon, MI 49441
|
1,232 sq. feet
|
1 baths 3 beds |
show details | |

|
#40
New St
Muskegon, MI 49442
|
2,130 sq. feet
|
2 baths 4 beds |
show details |
| Photo | Address | Area | Beds / Baths | Price | Details |
|---|---|---|---|---|---|

|
#41
W River Rd
Muskegon, MI 49445
|
1,512 sq. feet
|
1 baths 3 beds |
show details | |

|
#42
W River Rd
Muskegon, MI 49445
|
1,702 sq. feet
|
2 baths 4 beds |
show details | |

|
#43
W River Rd
Muskegon, MI 49445
|
1,164 sq. feet
|
2 baths 3 beds |
show details | |

|
#44
S Virginia Dr
Muskegon, MI 49444
|
1,008 sq. feet
|
1 baths 3 beds |
show details | |

|
#45
Jiroch St
Muskegon, MI 49442
|
1,412 sq. feet
|
1 baths 4 beds |
show details | |

|
#46
Barlow St
Muskegon, MI 49442
|
1,082 sq. feet
|
2 baths 2 beds |
show details | |

|
#47
Quarterline Rd
Spring Lake, MI 49456
|
1,475 sq. feet
|
1 baths 3 beds |
show details | |

|
#48
Langeland Ave
Muskegon, MI 49442
|
1,275 sq. feet
|
1 baths 3 beds |
show details | |

|
#49
Mclaughlin Ave
Muskegon, MI 49442
|
864 sq. feet
|
1 baths 2 beds |
show details | |

|
Check over 1 million property listings on Foreclosure.com!
|
browse all offers | |||

Latest news about housing in Fruitport, MI collected exclusively by city-data.com from local newspapers, TV, and radio stations

 | 2020 Census: GR Metro breakdown (14 replies) |
| Fruitport (0 replies) |
| What part of west Michigan would fit us? (10 replies) |
| Muskegon for retirement? (6 replies) |
| Retirement reconnaissance trip report (27 replies) |
| Towns Near Grand Rapids (7 replies) |

Median year apartment built: 1968
Household type by relationship:
Households: 1,392- Male householders: 203 (34 living alone), Female householders: 284 (66 living alone)
309 spouses (300 opposite-sex spouses), 21 unmarried partners, (21 opposite-sex unmarried partners), 511 children (477 natural, 24 adopted, 10 stepchildren), 23 grandchildren, 7 brothers or sisters, 5 parents, 0 foster children, 13 other relatives, 14 non-relatives
Size of family households: 128 2-persons, 58 3-persons, 96 4-persons, 48 5-persons, 11 6-persons.
Size of nonfamily households: 111 1-person, 17 2-persons.
306 married couples with children.
52 single-parent households (11 men, 41 women).
97.5% of residents of Fruitport speak English at home.
1.2% of residents speak Spanish at home (100% speak English very well).
0.8% of residents speak other Indo-European language at home (100% speak English very well).
Foreign born population: 24 (1.7%)
(75.0% of them are naturalized citizens)
| Here: | 6.0 |
| State: | 6.5 |
| Here: | 4.3 |
| State: | 4.3 |

- Bedrooms in owner-occupied houses and condos in Fruitport, Michigan
- 0no bedroom
- 31 bedroom
- 672 bedrooms
- 2913 bedrooms
- 834 bedrooms
- 375+ bedrooms

- Bedrooms in renter-occupied apartments in Fruitport, Michigan
- 0no bedroom
- 01 bedroom
- 112 bedrooms
- 03 bedrooms
- 04 bedrooms
- 05+ bedrooms

- Cars and other vehicles available in Fruitport in owner-occupied houses/condos
- 13no vehicle
- 1491 vehicle
- 1952 vehicles
- 903 vehicles
- 224 vehicles
- 115+ vehicles

- Cars and other vehicles available in Fruitport in renter-occupied apartments
- 0no vehicle
- 91 vehicle
- 22 vehicles
- 03 vehicles
- 04 vehicles
- 05+ vehicles

- Rooms in owner-occupied houses in Fruitport, Michigan
- 01 room
- 02 rooms
- 03 rooms
- 374 rooms
- 1525 rooms
- 976 rooms
- 487 rooms
- 648 rooms
- 829+ rooms

- Rooms in renter-occupied apartments in Fruitport, Michigan
- 01 room
- 02 rooms
- 03 rooms
- 64 rooms
- 05 rooms
- 56 rooms
- 07 rooms
- 08 rooms
- 09+ rooms


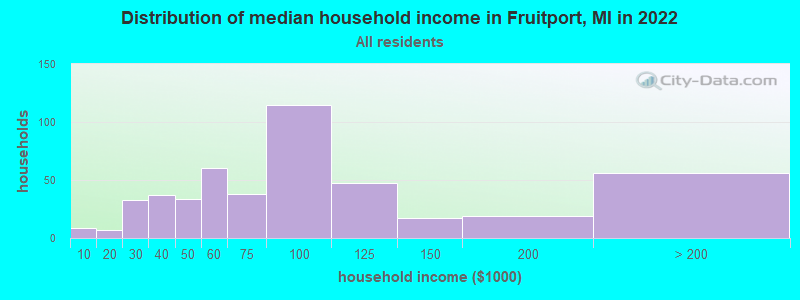
Fruitport, MI household income distribution

- 9Less than $10,000
- 7$10,000 to $19,999
- 33$20,000 to $29,999
- 37$30,000 to $39,999
- 34$40,000 to $49,999
- 60$50,000 to $59,999
- 38$60,000 to $74,999
- 115$75,000 to $99,999
- 47$100,000 to $124,999
- 17$125,000 to $149,999
- 19$150,000 to $199,999
- 56$200,000 or more
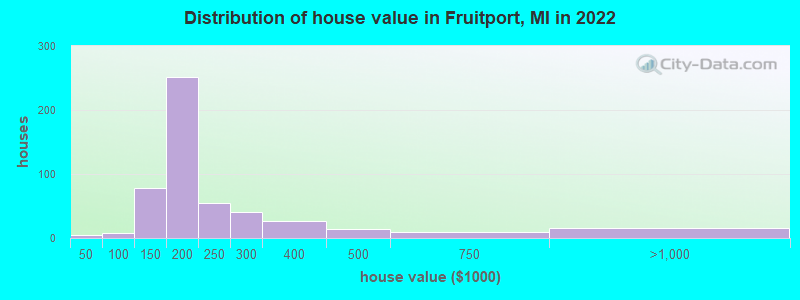
Home value of owner - occupied houses in 2022 in Fruitport, MI
-
- 2Less than $10,000
- 1$25,000 to $29,999
- 2$50,000 to $59,999
- 4$60,000 to $69,999
- 1$80,000 to $89,999
- 50$100,000 to $124,999
- 26$125,000 to $149,999
- 169$150,000 to $174,999
- 82$175,000 to $199,999
- 55$200,000 to $249,999
- 39$250,000 to $299,999
- 26$300,000 to $399,999
- 13$400,000 to $499,999
- 9$500,000 to $749,999
- 11$750,000 to $999,999
- 2$1,000,000 to $1,499,999
Rent paid by renters in 2022 in Fruitport, MI
-
- 1$650 to $699
- 7$800 to $899


Percentage of workers working in this county: 53.7%
Number of people working at home: 51 (8.2% of all workers)
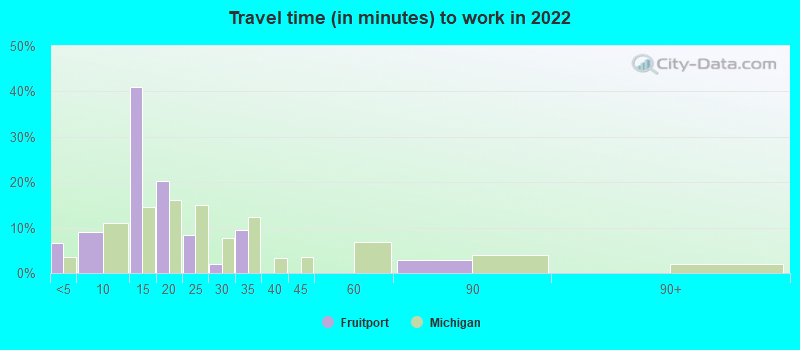
Travel time to work (commute)
- Less than 5 minutes: 25
- 5 to 9 minutes: 43
- 10 to 14 minutes: 158
- 15 to 19 minutes: 75
- 20 to 24 minutes: 54
- 25 to 29 minutes: 2
- 30 to 34 minutes: 44
- 35 to 39 minutes: 43
- 40 to 44 minutes: 6
- 45 to 59 minutes: 76
- 60 to 89 minutes: 0
- 90 or more minutes: 28
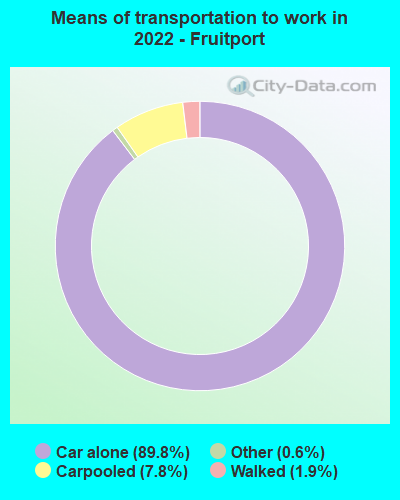
Means of transportation to work:
- Drove a car alone: 473 (80.4%)
- Carpooled: 41 (7.0%)
- Taxi: 3 (0.5%)
- Walked: 9 (1.5%)
- Worked at home: 51 (8.7%)

- Unemployment by race in 2022
- Unemployment rate for White non-Hispanic residents
- 5.3%Males
- 3.7%Females

- Year of entry for the foreign-born population in Fruitport, Michigan
- 82010 or later
- 82000 to 2009
- 01990 to 1999
- 11980 to 1989
- 41970 to 1979
- 6Before 1970

First ancestries reported:
- English: 126 (34.3%)
- German: 41 (11.2%)
- Dutch: 28 (7.6%)
- Italian: 27 (7.4%)
- Irish: 21 (5.7%)
- French: 19 (5.2%)
- Ethiopian: 14 (3.8%)
- Polish: 11 (3.0%)
- Hungarian: 5 (1.4%)
- American: 4 (1.1%)
- European: 3 (0.8%)
- Danish: 2 (0.5%)
- Norwegian: 2 (0.5%)
- Lithuanian: 1 (0.3%)
- Scotch-Irish: 1 (0.3%)
- Scottish: 1 (0.3%)
Most common places of birth for foreign-born residents (%):
| Fruitport: | 45.8% (11) |
| Michigan: | 0.3% (1,985) |
| Fruitport: | 33.3% (8) |
| Michigan: | 10.9% (75,965) |
| Fruitport: | 4.2% (1) |
| Michigan: | 4.9% (34,295) |
Place of birth for U.S.-born residents:
- This state: 1,268
- Other state: 96
- Northeast: 12
- Midwest: 51
- South: 16
- West: 12
89.6% of Fruitport residents lived in the same house 1 years ago.
Out of people who lived in different houses, 1.5% lived in this county.
Out of people who lived in different counties, 100.0% lived in Michigan.
| Fruitport: | 89.6% |
| State average: | 88.4% |
Education attainment for males 25 years and older:
- No schooling: 0
- Nursery to 4th grade: 0
- 5th and 6th grade: 0
- 7th and 8th grade: 1
- 9th grade: 1
- 10th grade: 5
- 11th grade: 0
- 12th grade, no diploma: 2
- High school graduate (or equivalency): 119
- Less than 1 year of college: 53
- Some college more than 1 year, no degree: 97
- Associate degree: 39
- Bachelor's degree: 89
- Master's degree: 28
- Professional school degree: 0
- Doctorate degree: 0

Education attainment for females 25 years and older:
- No schooling: 0
- Nursery to 4th grade: 0
- 5th and 6th grade: 0
- 7th and 8th grade: 17
- 9th grade: 0
- 10th grade: 0
- 11th grade: 1
- 12th grade, no diploma: 3
- High school graduate (or equivalency): 165
- Less than 1 year of college: 32
- Some college more than 1 year, no degree: 57
- Associate degree: 75
- Bachelor's degree: 66
- Master's degree: 51
- Professional school degree: 2
- Doctorate degree: 0


Housing units in structures:
- One, detached: 525
- Two: 10
- 5 to 9: 2
House/condo owner moved in on average 16 years ago
Renter moved in on average 11 years ago

Private vs. public school enrollment:
| Here: | 16.1% |
| Michigan: | 12.4% |
| Here: | 0.0% |
| Michigan: | 9.8% |
| Here: | 0.0% |
| Michigan: | 14.9% |


