Housing density: 2,277 houses/condos per square mile
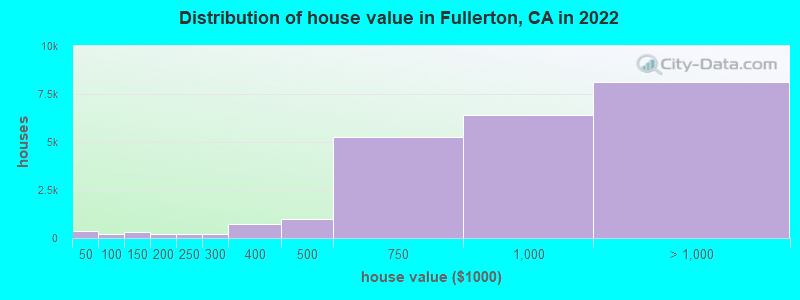
Median price asked for vacant for-sale houses and condos in 2022: $1,209,598.
Median contract rent in 2022: $1,914 (lower quartile is $1,580, upper quartile is over $2,000)
Median rent asked for vacant for-rent units in 2022: $1,961
Median gross rent in Fullerton, CA in 2022: over $2,000
Housing units in Fullerton with a mortgage: 16,665 (2,172 second mortgage, 113 home equity loan, 1,718 both second mortgage and home equity loan) Houses without a mortgage: 192
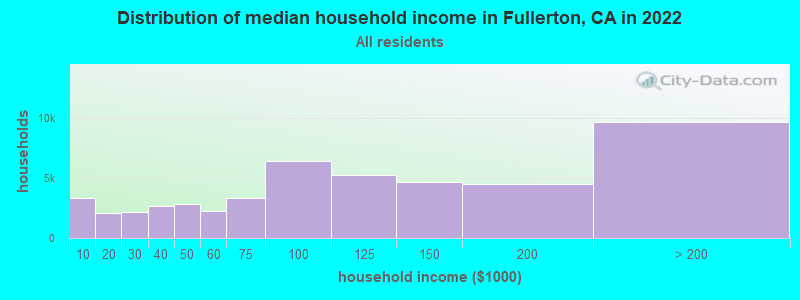
Median household income for houses/condos with a mortgage: $144,851
Median household income for apartments without a mortgage: $87,297
17,787 married couples with children.
6,417 single-parent households (1,048 men, 5,369 women).
51.0% of residents of Fullerton speak English at home.
25.9% of residents speak Spanish at home (65% speak English very well, 12% speak English well, 17% speak English not well, 5% don't speak English at all).
5.2% of residents speak other Indo-European language at home (68% speak English very well, 17% speak English well, 15% speak English not well).
17.2% of residents speak Asian or Pacific Island language at home (40% speak English very well, 36% speak English well, 23% speak English not well, 1% don't speak English at all).
0.7% of residents speak other language at home (90% speak English very well, 10% speak English well).
Foreign born population: 45,016 (32.0%)
(56.8% of them are naturalized citizens)
Percentage of workers working in this county: 77.3% Number of people working at home: 10,707 (15.3% of all workers)
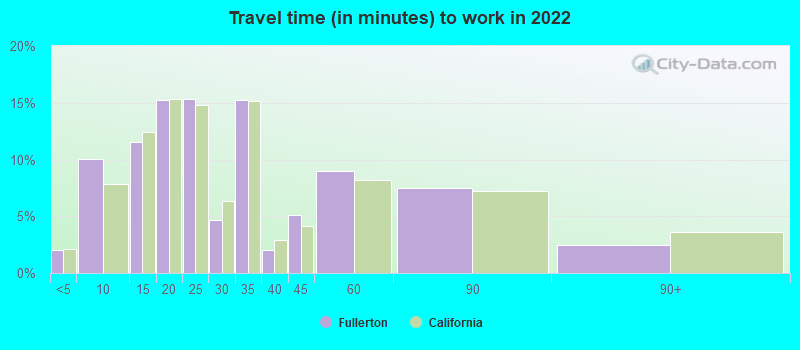
Travel time to work (commute)
Less than 5 minutes: 1,071
5 to 9 minutes: 4,602
10 to 14 minutes: 5,857
15 to 19 minutes: 8,679
20 to 24 minutes: 7,600
25 to 29 minutes: 3,319
30 to 34 minutes: 8,994
35 to 39 minutes: 2,734
40 to 44 minutes: 2,783
45 to 59 minutes: 6,166
60 to 89 minutes: 5,164
90 or more minutes: 2,324
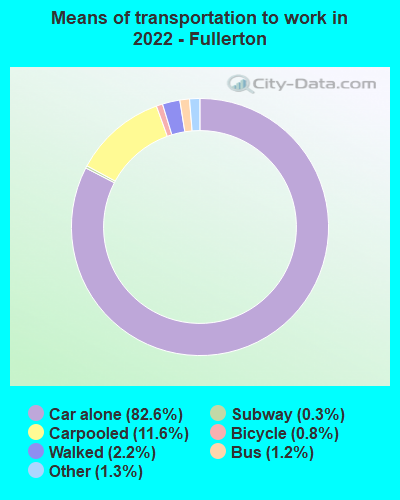
Means of transportation to work:
Drove a car alone: 45,321 (69.6%)
Carpooled: 6,902 (10.6%)
Bus: 571 (0.9%)
Subway or elevated rail: 11 (0.0%)
Long-distance train or commuter rail: 116 (0.2%)
Light rail, streetcar or trolley: 8 (0.0%)
Ferryboat: 5 (0.0%)
Taxi: 801 (1.2%)
Bicycle: 464 (0.7%)
Walked: 1,222 (1.9%)
Worked at home: 9,355 (14.4%)
Unemployment by race in 2022
Unemployment rate for White non-Hispanic residents
2.4%Males
4.3%Females
Unemployment rate for Black residents
20.1%Males
23.7%Females
Unemployment rate for American Indian and Alaska Native residents
14.5%Males
Unemployment rate for Asian residents
3.5%Males
6.1%Females
Unemployment rate for other race residents
3.8%Males
6.1%Females
Unemployment rate for two or more race residents
4.5%Males
5.1%Females
Unemployment rate for Hispanic or Latino residents
2.3%Males
5.5%Females
Year of entry for the foreign-born population in Fullerton, California
7,4092010 or later
9,0712000 to 2009
8,4691990 to 1999
11,7321980 to 1989
6,5881970 to 1979
3,603Before 1970
First ancestries reported:
American: 3,170 (3.5%)
English: 3,151 (3.5%)
Irish: 2,400 (2.7%)
German: 2,205 (2.5%)
European: 1,594 (1.8%)
Italian: 1,193 (1.3%)
Romanian: 697 (0.8%)
Iranian: 561 (0.6%)
Swedish: 381 (0.4%)
Scottish: 373 (0.4%)
Lebanese: 355 (0.4%)
Polish: 353 (0.4%)
Dutch: 284 (0.3%)
French: 261 (0.3%)
Norwegian: 244 (0.3%)
Assyrian: 209 (0.2%)
Canadian: 186 (0.2%)
Syrian: 172 (0.2%)
Brazilian: 160 (0.2%)
French Canadian: 157 (0.2%)
Jamaican: 151 (0.2%)
Nigerian: 149 (0.2%)
Greek: 149 (0.2%)
Northern European: 145 (0.2%)
Armenian: 144 (0.2%)
Scandinavian: 140 (0.2%)
Ukrainian: 133 (0.1%)
Kenyan: 133 (0.1%)
Albanian: 108 (0.1%)
African: 102 (0.1%)
Portuguese: 102 (0.1%)
Ethiopian: 101 (0.1%)
Russian: 100 (0.1%)
Lithuanian: 91 (0.1%)
Eastern European: 90 (0.1%)
British: 87 (0.10%)
Hungarian: 84 (0.09%)
Austrian: 83 (0.09%)
Welsh: 79 (0.09%)
Slovak: 74 (0.08%)
Croatian: 62 (0.07%)
Egyptian: 61 (0.07%)
Scotch-Irish: 60 (0.07%)
Palestinian: 54 (0.06%)
Danish: 53 (0.06%)
Swiss: 50 (0.06%)
Belizean: 30 (0.03%)
Bulgarian: 28 (0.03%)
Haitian: 24 (0.03%)
Turkish: 22 (0.02%)
Czech: 19 (0.02%)
Celtic: 17 (0.02%)
Sudanese: 17 (0.02%)
Belgian: 10 (0.01%)
Finnish: 8 (0.01%)
Czechoslovakian: 7 (0.01%)
Basque: 6 (0.01%)
Most common places of birth for foreign-born residents (%):
Mexico
Fullerton:
28.8% (12,024)
California:
37.2% (3,881,193)
Korea
Fullerton:
25.3% (10,587)
California:
3.0% (315,248)
Philippines
Fullerton:
6.1% (2,542)
California:
7.8% (818,297)
India
Fullerton:
5.0% (2,100)
California:
5.2% (539,184)
Vietnam
Fullerton:
4.2% (1,751)
California:
4.9% (512,335)
China, excluding Hong Kong and Taiwan
Fullerton:
4.0% (1,693)
California:
6.6% (684,672)
Taiwan
Fullerton:
2.6% (1,073)
California:
1.7% (176,274)
Iran
Fullerton:
2.0% (850)
California:
2.0% (206,004)
Peru
Fullerton:
1.8% (771)
California:
0.7% (74,025)
El Salvador
Fullerton:
1.5% (645)
California:
4.2% (440,287)
Place of birth for U.S.-born residents:
This state: 74,598
Other state: 17,617
Northeast: 3,598
Midwest: 5,922
South: 3,995
West: 4,102
87.0% of Fullerton residents lived in the same house 1 years ago. Out of people who lived in different houses, 34.4% lived in this county. Out of people who lived in different counties, 78.1% lived in California.
Fullerton:
87.0%
State average:
88.9%
Education attainment for males 25 years and older:
No schooling: 1,623
Nursery to 4th grade: 887
5th and 6th grade: 1,441
7th and 8th grade: 51
9th grade: 295
10th grade: 453
11th grade: 414
12th grade, no diploma: 1,641
High school graduate (or equivalency): 7,897
Less than 1 year of college: 2,039
Some college more than 1 year, no degree: 7,872
Associate degree: 3,332
Bachelor's degree: 12,861
Master's degree: 5,577
Professional school degree: 1,652
Doctorate degree: 1,106
Education attainment for females 25 years and older:
No schooling: 1,448
Nursery to 4th grade: 537
5th and 6th grade: 1,335
7th and 8th grade: 292
9th grade: 586
10th grade: 515
11th grade: 37
12th grade, no diploma: 726
High school graduate (or equivalency): 7,566
Less than 1 year of college: 1,509
Some college more than 1 year, no degree: 7,245
Associate degree: 3,517
Bachelor's degree: 15,438
Master's degree: 5,944
Professional school degree: 2,346
Doctorate degree: 896
Housing units in structures:
One, detached: 26,240
One, attached: 4,088
Two: 687
3 or 4: 4,234
5 to 9: 2,756
10 to 19: 1,957
20 to 49: 1,478
50 or more: 7,898
Mobile homes: 1,216
Median worth of mobile homes: $157,600
Housing units lacking complete plumbing facilities in 2022: 0.7%
Housing units lacking complete kitchen facilities in 2022: 2.7%
House/condo owner moved in on average 14 years ago