Gaffney, SC (South Carolina) Houses and Residents
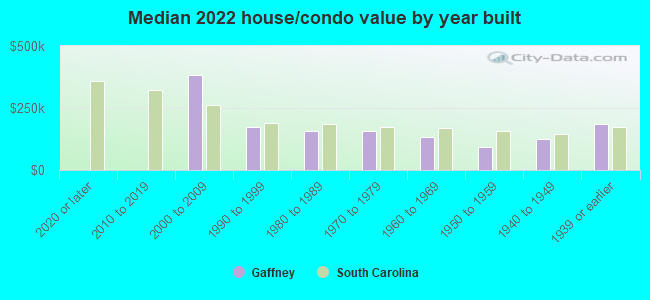
| Gaffney: | $142,256 |
| South Carolina: | $254,600 |
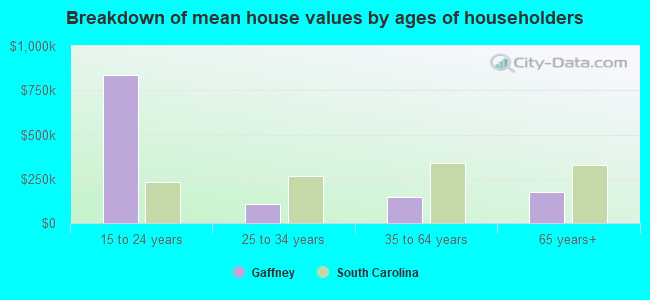
Mean price in 2022:
Detached houses: $159,053
Here: $159,053 State: $368,255 Mobile homes: $30,170
Here: $30,170 State: $102,531
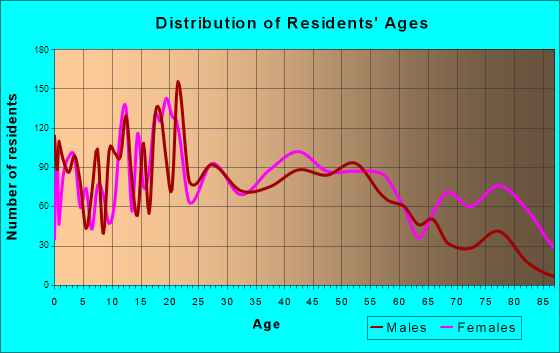
Total population: 12,597 (All urban)
Houses: 5,720 (4,775 occupied: 2,580 owner occupied, 2,288 renter occupied)
| % of renters here: | 47% |
| State: | 28% |
Housing density: 728 houses/condos per square mile
Median price asked for vacant for-sale houses and condos in 2022: $182,016.
Median contract rent in 2022: $610 (lower quartile is $357, upper quartile is $813)
Median rent asked for vacant for-rent units in 2022: $646
Median gross rent in Gaffney, SC in 2022: $851
Housing units in Gaffney with a mortgage: 1,395 (73 second mortgage, 0 home equity loan, 58 both second mortgage and home equity loan)
Houses without a mortgage: 102
Median household income for houses/condos with a mortgage: $60,675
Median household income for apartments without a mortgage: $38,171
Median monthly housing costs: $736
Compare current foreclosures in Gaffney, SC:
| Photo | Address | Area | Beds / Baths | Price | Details |
|---|---|---|---|---|---|

|
#1
Gardner Rd
Gaffney, SC 29341
|
- sq. feet
|
2 baths 3 beds |
show details | |

|
#2
Mcarthur St
Gaffney, SC 29340
|
1,036 sq. feet
|
1 baths 3 beds |
show details | |

|
#3
Goucher School Rd
Gaffney, SC 29340
|
- sq. feet
|
- baths - beds |
$25,000
|
show details |

|
#4
Carver St
Gaffney, SC 29341
|
- sq. feet
|
1 baths 3 beds |
show details | |

|
#5
Spruce St
Gaffney, SC 29340
|
- sq. feet
|
- baths - beds |
$25,000
|
show details |

|
#6
Birchwood Ct
Gaffney, SC 29341
|
- sq. feet
|
- baths - beds |
$29,900
|
show details |

|
#7
Filter Plant Rd
Gaffney, SC 29340
|
1,058 sq. feet
|
- baths - beds |
show details | |

|
#8
Ashley St
Gaffney, SC 29340
|
2,180 sq. feet
|
- baths - beds |
show details | |

|
#9
Cypress Dr
Gaffney, SC 29340
|
1,023 sq. feet
|
- baths - beds |
show details | |

|
#10
Old Mckown Farm Rd
Gaffney, SC 29340
|
2,016 sq. feet
|
- baths - beds |
show details |
| Photo | Address | Area | Beds / Baths | Price | Details |
|---|---|---|---|---|---|

|
#11
S Poplar Springs Dr
Gaffney, SC 29341
|
1,030 sq. feet
|
- baths - beds |
show details | |

|
#12
Mccluney Dr
Gaffney, SC 29340
|
- sq. feet
|
- baths - beds |
show details | |

|
#13
Cherokee Ave
Gaffney, SC 29340
|
- sq. feet
|
- baths - beds |
show details | |

|
#14
Foxfire Dr
Gaffney, SC 29340
|
1,669 sq. feet
|
- baths - beds |
show details | |

|
#15
Oakwood Dr
Gaffney, SC 29341
|
- sq. feet
|
- baths - beds |
show details | |

|
#16
Lovers Lane Rd
Gaffney, SC 29340
|
- sq. feet
|
- baths - beds |
show details | |

|
#17
S Limestone St
Gaffney, SC 29340
|
1,948 sq. feet
|
- baths - beds |
show details | |

|
#18
Ballenger Rd
Gaffney, SC 29340
|
- sq. feet
|
- baths - beds |
show details | |

|
#19
W Buford St
Gaffney, SC 29341
|
1,458 sq. feet
|
- baths - beds |
show details | |

|
#20
Pleasant School Rd
Gaffney, SC 29341
|
- sq. feet
|
- baths - beds |
show details |
| Photo | Address | Area | Beds / Baths | Price | Details |
|---|---|---|---|---|---|

|
#21
Burnt Gin Rd
Gaffney, SC 29340
|
- sq. feet
|
- baths - beds |
show details | |

|
#22
Anns Trl
Gaffney, SC 29341
|
- sq. feet
|
- baths - beds |
show details | |

|
#23
Overbrook Dr
Gaffney, SC 29341
|
- sq. feet
|
- baths - beds |
show details | |

|
#24
Roland Farm Rd
Gaffney, SC 29340
|
1,588 sq. feet
|
- baths - beds |
show details | |

|
#25
Brittany Rd
Gaffney, SC 29341
|
1,976 sq. feet
|
- baths - beds |
show details | |

|
#26
Nob Hl
Gaffney, SC 29340
|
- sq. feet
|
- baths - beds |
show details | |

|
#27
W Buford St Apt 604
Gaffney, SC 29341
|
- sq. feet
|
- baths - beds |
show details | |

|
#28
Hillcrest Dr
Gaffney, SC 29340
|
1,920 sq. feet
|
- baths - beds |
show details | |

|
#29
Gettys Dr
Gaffney, SC 29341
|
- sq. feet
|
- baths - beds |
show details | |

|
#30
Knollcrest Dr
Gaffney, SC 29340
|
1,113 sq. feet
|
- baths - beds |
show details |
| Photo | Address | Area | Beds / Baths | Price | Details |
|---|---|---|---|---|---|

|
#31
Meadow Ln
Gaffney, SC 29340
|
- sq. feet
|
- baths - beds |
show details | |

|
#32
Oak Ridge Rd
Gaffney, SC 29341
|
- sq. feet
|
- baths - beds |
show details | |

|
#33
Champion Ferry Rd
Gaffney, SC 29341
|
1,508 sq. feet
|
- baths - beds |
show details | |

|
#34
Sunset Dr
Gaffney, SC 29340
|
1,449 sq. feet
|
- baths - beds |
show details | |

|
#35
Columbus Dr
Gaffney, SC 29340
|
2,052 sq. feet
|
- baths - beds |
show details | |

|
#36
Pleasant School Rd
Gaffney, SC 29341
|
1,456 sq. feet
|
- baths - beds |
show details | |

|
#37
Ford Rd
Gaffney, SC 29340
|
1,081 sq. feet
|
- baths - beds |
show details | |

|
#38
Thorn Creek Dr
Gaffney, SC 29341
|
- sq. feet
|
- baths - beds |
show details | |

|
#39
Sardis Rd
Gaffney, SC 29340
|
1,696 sq. feet
|
- baths - beds |
show details | |

|
#40
Anthony St
Gaffney, SC 29340
|
- sq. feet
|
- baths - beds |
show details |
| Photo | Address | Area | Beds / Baths | Price | Details |
|---|---|---|---|---|---|

|
#41
Freemont Dr
Gaffney, SC 29340
|
- sq. feet
|
- baths - beds |
show details | |

|
#42
Coach Hill Dr
Gaffney, SC 29340
|
- sq. feet
|
- baths - beds |
show details | |

|
#43
Cherokee Ridge Dr
Gaffney, SC 29341
|
- sq. feet
|
- baths - beds |
show details | |

|
#44
Sarratt Ave
Gaffney, SC 29341
|
- sq. feet
|
- baths - beds |
show details | |

|
#45
Champion Ferry Rd
Gaffney, SC 29341
|
- sq. feet
|
- baths - beds |
show details | |

|
#46
Hess Ln
Gaffney, SC 29340
|
- sq. feet
|
- baths - beds |
show details | |

|
Check over 1 million property listings on Foreclosure.com!
|
browse all offers | |||

Latest news about housing in Gaffney, SC collected exclusively by city-data.com from local newspapers, TV, and radio stations

 | Can Anyone Tell Me About Trailer Home Construction? (17 replies) |
| Housing Market? (10 replies) |
| New retail/restaurant thread, Part 2, 1/1/2020 through xxxxx. (2008 replies) |
| Rug & Homes location off Exit 67 (5 replies) |
| Out-of-market OTA TV reception in Columbia area? (60 replies) |
| WBTV Reception Upstate SC (17 replies) |
Median year apartment built: 1989
Household type by relationship:
Households: 12,995- Male householders: 1,985 (721 living alone), Female householders: 2,750 (1,138 living alone)
1,471 spouses (1,462 opposite-sex spouses), 189 unmarried partners, (189 opposite-sex unmarried partners), 3,942 children (3,790 natural, 44 adopted, 107 stepchildren), 330 grandchildren, 426 brothers or sisters, 94 parents, 32 foster children, 263 other relatives, 503 non-relatives
- In group quarters: 1,003
Size of family households: 1,148 2-persons, 733 3-persons, 499 4-persons, 229 5-persons, 71 6-persons.
Size of nonfamily households: 1,889 1-person, 203 2-persons, 30 3-persons, 34 4-persons.
917 married couples with children.
1,376 single-parent households (171 men, 1,205 women).
95.0% of residents of Gaffney speak English at home.
4.1% of residents speak Spanish at home (36% speak English very well, 23% speak English well, 36% speak English not well, 5% don't speak English at all).
0.5% of residents speak other Indo-European language at home (39% speak English very well, 22% speak English well, 39% speak English not well).
0.1% of residents speak other language at home (100% speak English very well).
Foreign born population: 417 (3.2%)
(37.2% of them are naturalized citizens)
| Here: | 6.1 |
| State: | 6.4 |
| Here: | 4.5 |
| State: | 4.5 |
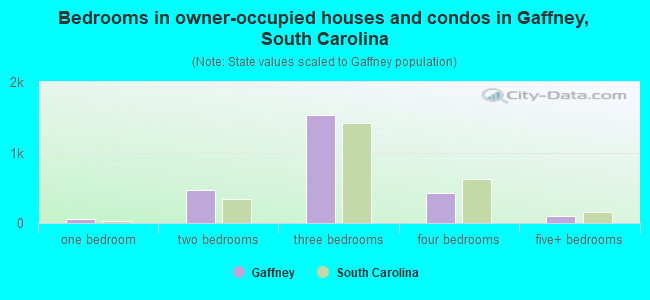
- Bedrooms in owner-occupied houses and condos in Gaffney, South Carolina
- 0no bedroom
- 631 bedroom
- 4612 bedrooms
- 1,5343 bedrooms
- 4284 bedrooms
- 945+ bedrooms
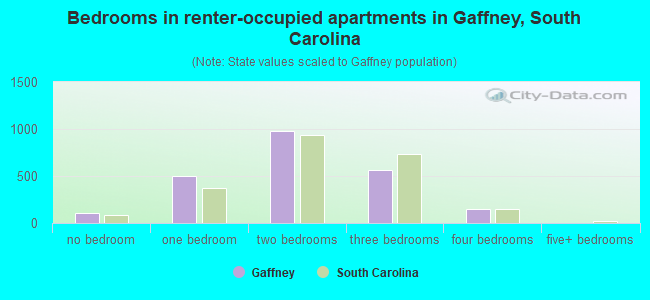
- Bedrooms in renter-occupied apartments in Gaffney, South Carolina
- 108no bedroom
- 4971 bedroom
- 9792 bedrooms
- 5603 bedrooms
- 1454 bedrooms
- 05+ bedrooms
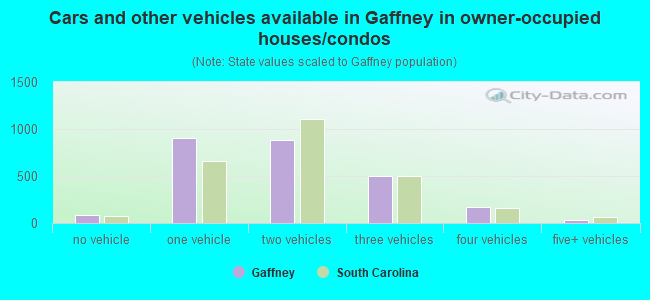
- Cars and other vehicles available in Gaffney in owner-occupied houses/condos
- 88no vehicle
- 9021 vehicle
- 8872 vehicles
- 5003 vehicles
- 1724 vehicles
- 325+ vehicles
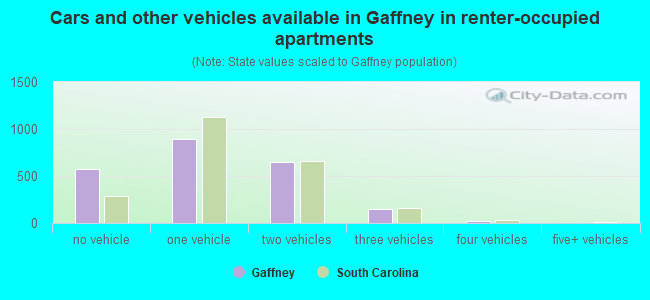
- Cars and other vehicles available in Gaffney in renter-occupied apartments
- 578no vehicle
- 8961 vehicle
- 6492 vehicles
- 1463 vehicles
- 194 vehicles
- 05+ vehicles
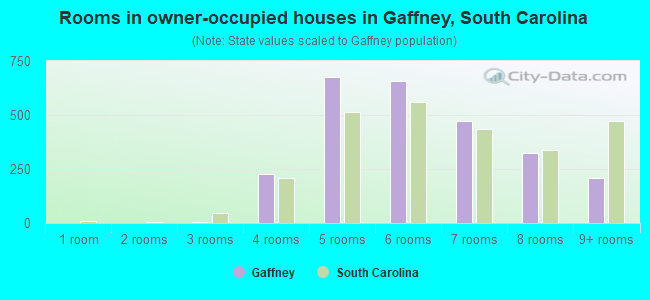
- Rooms in owner-occupied houses in Gaffney, South Carolina
- 01 room
- 02 rooms
- 53 rooms
- 2294 rooms
- 6785 rooms
- 6596 rooms
- 4747 rooms
- 3258 rooms
- 2109+ rooms
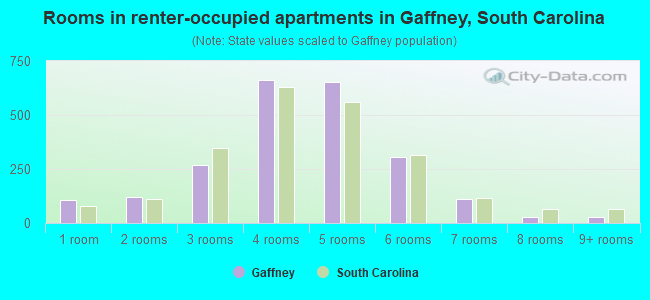
- Rooms in renter-occupied apartments in Gaffney, South Carolina
- 1081 room
- 1222 rooms
- 2703 rooms
- 6624 rooms
- 6545 rooms
- 3046 rooms
- 1107 rooms
- 308 rooms
- 299+ rooms
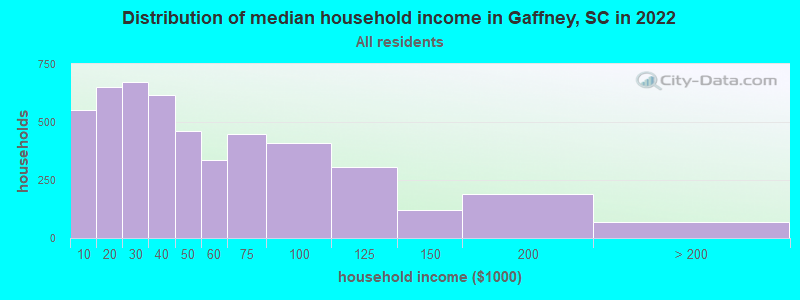
Gaffney, SC household income distribution

- 550Less than $10,000
- 652$10,000 to $19,999
- 671$20,000 to $29,999
- 618$30,000 to $39,999
- 463$40,000 to $49,999
- 336$50,000 to $59,999
- 449$60,000 to $74,999
- 410$75,000 to $99,999
- 306$100,000 to $124,999
- 119$125,000 to $149,999
- 191$150,000 to $199,999
- 71$200,000 or more
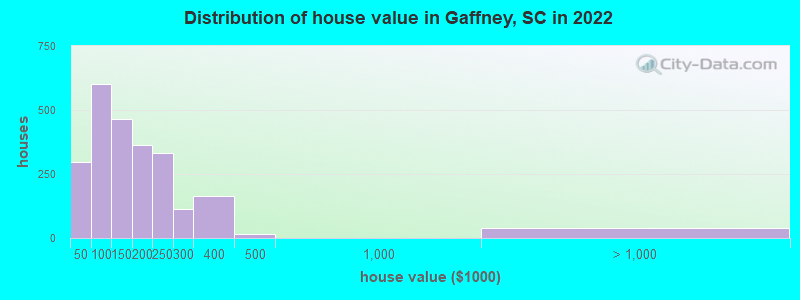
Home value of owner - occupied houses in 2022 in Gaffney, SC
-
- 25Less than $10,000
- 27$10,000 to $14,999
- 74$15,000 to $19,999
- 21$20,000 to $24,999
- 5$25,000 to $29,999
- 41$35,000 to $39,999
- 100$40,000 to $49,999
- 46$50,000 to $59,999
- 86$60,000 to $69,999
- 177$70,000 to $79,999
- 97$80,000 to $89,999
- 94$90,000 to $99,999
- 355$100,000 to $124,999
- 108$125,000 to $149,999
- 281$150,000 to $174,999
- 83$175,000 to $199,999
- 333$200,000 to $249,999
- 114$250,000 to $299,999
- 164$300,000 to $399,999
- 16$400,000 to $499,999
- 39$1,000,000 to $1,499,999
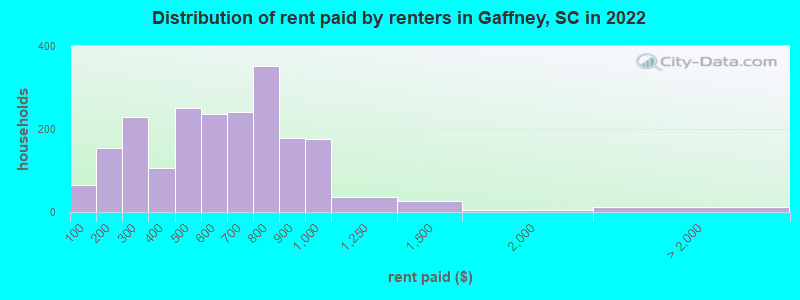
Rent paid by renters in 2022 in Gaffney, SC
-
- 63Less than $100
- 71$100 to $149
- 82$150 to $199
- 149$200 to $249
- 77$250 to $299
- 42$300 to $349
- 64$350 to $399
- 164$400 to $449
- 86$450 to $499
- 136$500 to $549
- 98$550 to $599
- 115$600 to $649
- 126$650 to $699
- 130$700 to $749
- 221$750 to $799
- 178$800 to $899
- 175$900 to $999
- 37$1,000 to $1,249
- 25$1,250 to $1,499
- 6$1,500 to $1,999
- 11No cash rent
Percentage of workers working in this county: 71.3%
Number of people working at home: 364 (7.2% of all workers)
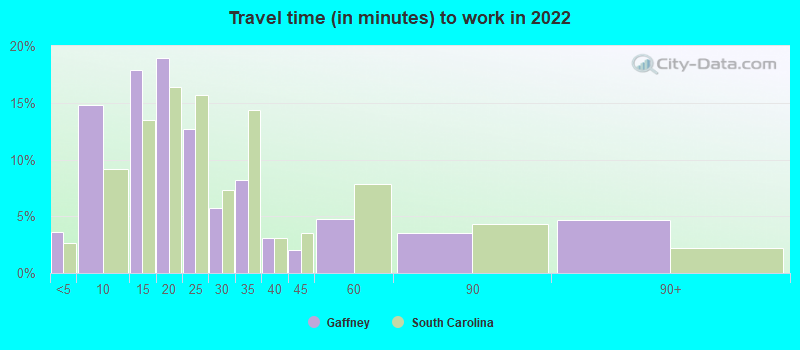
Travel time to work (commute)
- Less than 5 minutes: 351
- 5 to 9 minutes: 1,101
- 10 to 14 minutes: 918
- 15 to 19 minutes: 451
- 20 to 24 minutes: 300
- 25 to 29 minutes: 228
- 30 to 34 minutes: 291
- 35 to 39 minutes: 180
- 40 to 44 minutes: 289
- 45 to 59 minutes: 281
- 60 to 89 minutes: 203
- 90 or more minutes: 66
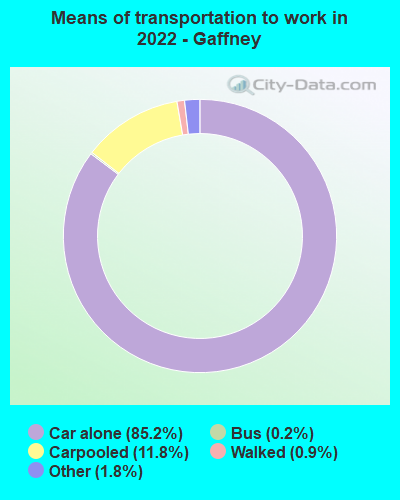
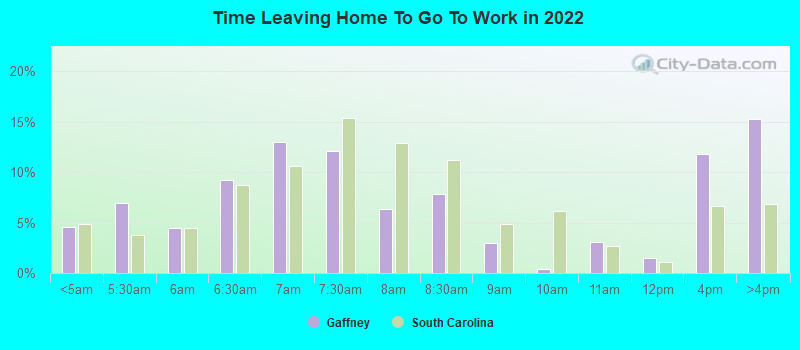
Means of transportation to work:
- Drove a car alone: 7,042 (79.6%)
- Carpooled: 1,025 (11.6%)
- Bus: 17 (0.2%)
- Taxi: 165 (1.9%)
- Walked: 67 (0.8%)
- Worked at home: 364 (4.1%)
- Unemployment by race in 2022
- Unemployment rate for White non-Hispanic residents
- 8.8%Males
- 4.0%Females
- Unemployment rate for Black residents
- 5.7%Males
- 9.9%Females
- Unemployment rate for other race residents
- 41.0%Females
- Unemployment rate for two or more race residents
- 17.3%Males
- 3.2%Females
- Unemployment rate for Hispanic or Latino residents
- 4.2%Males
- 9.4%Females
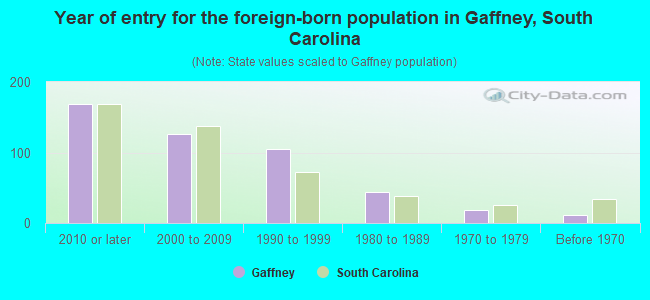
- Year of entry for the foreign-born population in Gaffney, South Carolina
- 1692010 or later
- 1262000 to 2009
- 1051990 to 1999
- 441980 to 1989
- 181970 to 1979
- 12Before 1970
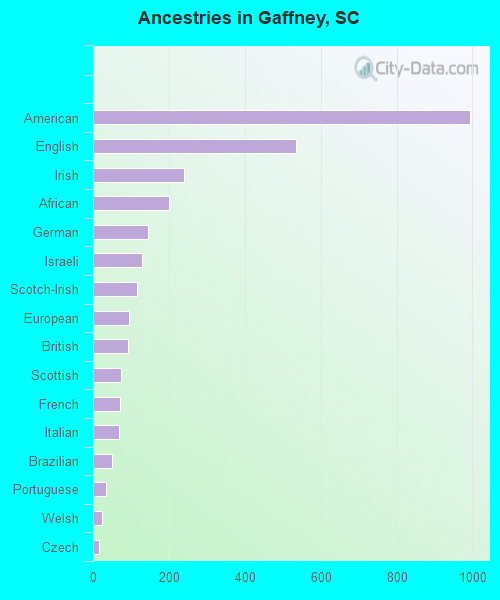
First ancestries reported:
- American: 994 (12.5%)
- English: 534 (6.7%)
- Irish: 241 (3.0%)
- African: 200 (2.5%)
- German: 145 (1.8%)
- Israeli: 128 (1.6%)
- Scotch-Irish: 116 (1.5%)
- European: 94 (1.2%)
- British: 93 (1.2%)
- Scottish: 74 (0.9%)
- French: 71 (0.9%)
- Italian: 68 (0.9%)
- Brazilian: 49 (0.6%)
- Portuguese: 34 (0.4%)
- Welsh: 23 (0.3%)
- Czech: 15 (0.2%)
- Hungarian: 6 (0.08%)
- Swedish: 2 (0.03%)
Most common places of birth for foreign-born residents (%):
| Gaffney: | 65.5% (273) |
| South Carolina: | 22.5% (60,774) |
| Gaffney: | 12.9% (54) |
| South Carolina: | 0.4% (1,091) |
| Gaffney: | 4.8% (20) |
| South Carolina: | 0.1% (386) |
| Gaffney: | 4.3% (18) |
| South Carolina: | 3.0% (8,193) |
| Gaffney: | 3.4% (14) |
| South Carolina: | 2.6% (7,073) |
| Gaffney: | 2.6% (11) |
| South Carolina: | 1.2% (3,296) |
| Gaffney: | 2.4% (10) |
| South Carolina: | 2.0% (5,344) |
| Gaffney: | 2.2% (9) |
| South Carolina: | 4.3% (11,533) |
Place of birth for U.S.-born residents:
- This state: 9,045
- Other state: 3,273
- Northeast: 491
- Midwest: 474
- South: 2,056
- West: 229
78.8% of Gaffney residents lived in the same house 1 years ago.
Out of people who lived in different houses, 36.0% lived in this county.
Out of people who lived in different counties, 43.1% lived in South Carolina.
| Gaffney: | 78.8% |
| State average: | 86.5% |
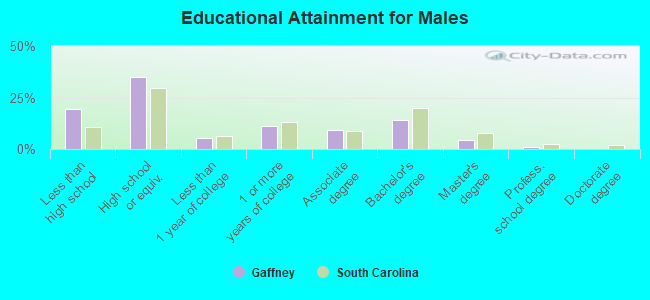
Education attainment for males 25 years and older:
- No schooling: 64
- Nursery to 4th grade: 9
- 5th and 6th grade: 10
- 7th and 8th grade: 57
- 9th grade: 71
- 10th grade: 207
- 11th grade: 212
- 12th grade, no diploma: 94
- High school graduate (or equivalency): 1,302
- Less than 1 year of college: 208
- Some college more than 1 year, no degree: 425
- Associate degree: 339
- Bachelor's degree: 531
- Master's degree: 161
- Professional school degree: 41
- Doctorate degree: 0
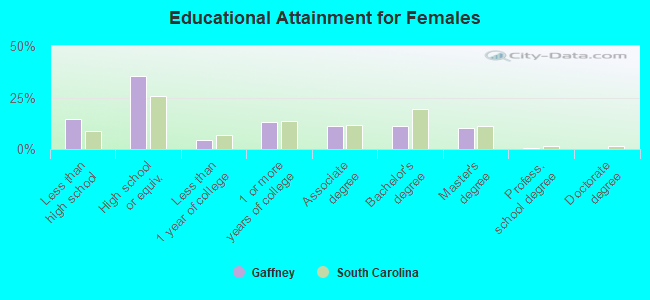
Education attainment for females 25 years and older:
- No schooling: 141
- Nursery to 4th grade: 3
- 5th and 6th grade: 22
- 7th and 8th grade: 55
- 9th grade: 33
- 10th grade: 83
- 11th grade: 197
- 12th grade, no diploma: 116
- High school graduate (or equivalency): 1,610
- Less than 1 year of college: 187
- Some college more than 1 year, no degree: 593
- Associate degree: 494
- Bachelor's degree: 499
- Master's degree: 468
- Professional school degree: 13
- Doctorate degree: 0
Housing units in structures:
- One, detached: 3,894
- One, attached: 45
- Two: 253
- 3 or 4: 330
- 5 to 9: 507
- 10 to 19: 351
- 20 to 49: 145
- 50 or more: 16
- Mobile homes: 176
Housing units lacking complete kitchen facilities in 2022: 4.0%
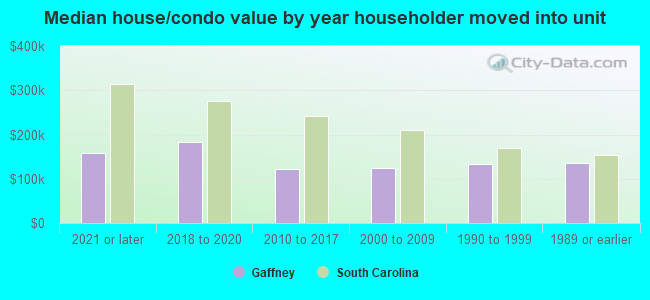
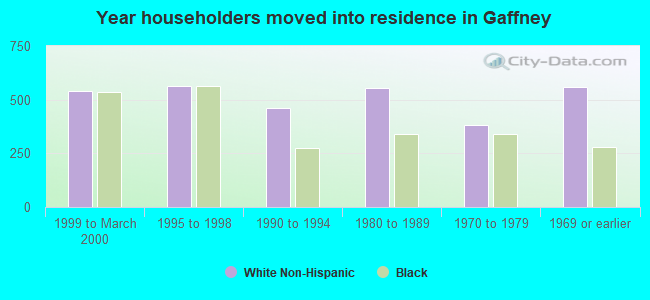
House/condo owner moved in on average 17 years ago
Renter moved in on average 1 years ago
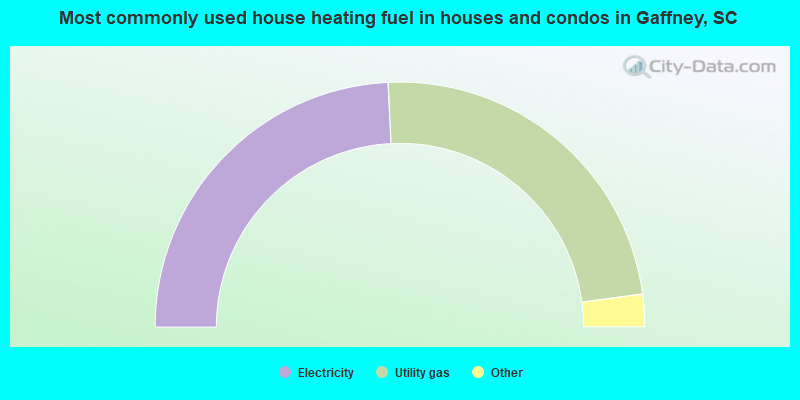
- 48.5%Electricity
- 47.3%Utility gas
- 3.4%Bottled, tank, or LP gas
- 0.8%Wood
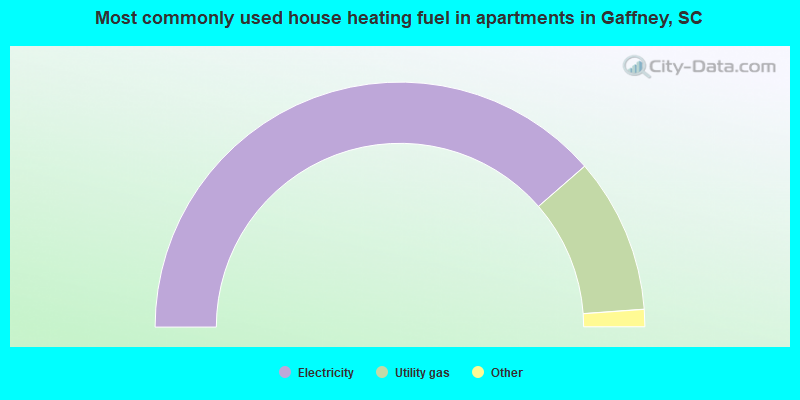
- 77.2%Electricity
- 20.5%Utility gas
- 1.3%No fuel used
- 0.5%Bottled, tank, or LP gas
- 0.4%Fuel oil, kerosene, etc.
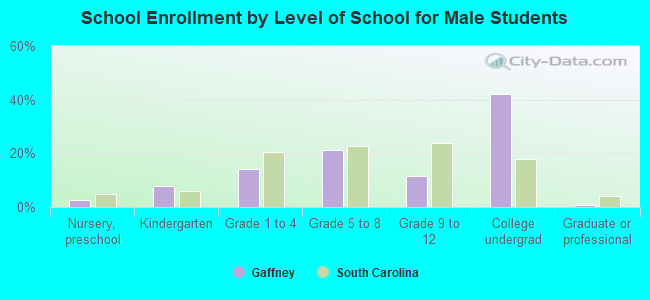
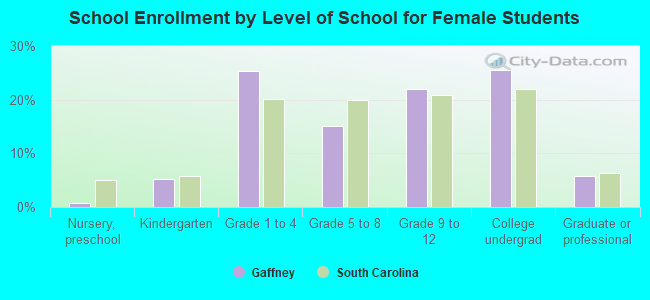
Private vs. public school enrollment:
| Here: | 4.9% |
| South Carolina: | 14.4% |
| Here: | 2.4% |
| South Carolina: | 11.1% |
| Here: | 66.8% |
| South Carolina: | 21.9% |