Gainesville, GA (Georgia) Houses and Residents
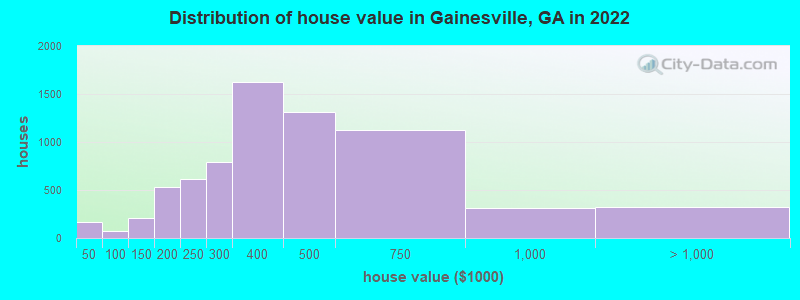
Estimated median house or condo value in 2022: $379,166 (it was $129,500 in 2000 )
Gainesville:
$379,166Georgia:
$297,400
Lower value quartile - upper value quartile: $254,142 - $517,078Mean price in 2022: Detached houses: $394,662 Here:
$394,662State:
$376,364
Townhouses or other attached units: $236,764 Here:
$236,764State:
$341,709
In 3-to-4-unit structures: $299,593 Here:
$299,593State:
$250,092
In 5-or-more-unit structures: $174,802 Here:
$174,802State:
$370,730
Mobile homes: $172,748 Here:
$172,748State:
$102,413
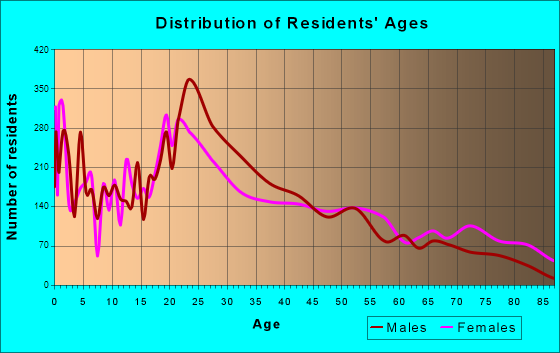
Total population: 36,306 (Urban population: 25,305, Rural population: 149 (all nonfarm) )
Houses: 18,060 (15,698 occupied: 6,952 owner occupied, 9,078 renter occupied )
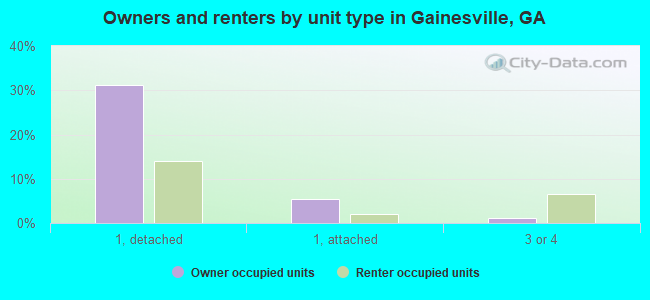
% of renters here:
57%State:
34%
Housing density: 667 houses/condos per square mile
Median price asked for vacant for-sale houses and condos in 2022: $424,525.
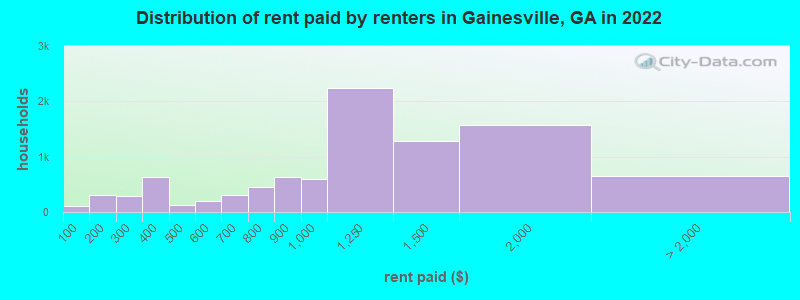
Median contract rent in 2022: $1,151 (lower quartile is $847, upper quartile is $1,513)
Median rent asked for vacant for-rent units in 2022: $2,093
Median gross rent in Gainesville, GA in 2022: $1,248
Housing units in Gainesville with a mortgage: 4,288 (316 second mortgage, 0 home equity loan, 236 both second mortgage and home equity loan )Houses without a mortgage: 54
Median household income for houses/condos with a mortgage: $99,783
Median household income for apartments without a mortgage: $70,750
Median monthly housing costs: $1,228
Data:
Median house or condo value ($)
Median house or condo value ($ change since 2000)
Median house or condo value ($) - White
Median house or condo value ($) - Black or African American
Median house or condo value ($) - Asian
Median house or condo value ($) - Hispanic or Latino
Median house or condo value ($) - American Indian and Alaska Native
Median house or condo value ($) - Multirace
Median house or condo value ($) - Other Race
Median price asked for mobile homes ($)
Household density (households per square mile)
Mean house or condo value by units in structure - 1, detached ($)
Mean house or condo value by units in structure - 1, attached ($)
Mean house or condo value by units in structure - 2 ($)
Mean house or condo value by units in structure by units in structure - 3 or 4 ($)
Mean house or condo value by units in structure - 5 or more ($)
Mean house or condo value by units in structure - Boat, RV, van, etc. ($)
Mean house or condo value by units in structure - Mobile home ($)
Median contract rent ($)
Median contract rent - Lower quartile ($)
Median contract rent - Upper quartile ($)
Median gross rent ($)
Urban houses (%)
Rural houses (%)
Houses occupied (%)
Houses occupied (% change since 2000)
Houses owner occupied (%)
Houses owner occupied (% change since 2000)
Houses renter occupied (%)
Houses renter occupied (% change since 2000)
Vacant housing units - For rent (%)
Vacant housing units - For rent (% change since 2000)
Vacant housing units - For sale only (%)
Vacant housing units - For sale only (% change since 2000)
Vacant housing units - Rented or sold, not occupied (%)
Vacant housing units - Rented or sold, not occupied (% change since 2000)
Vacant housing units - For seasonal, recreational, or occasional use (%)
Vacant housing units - For seasonal, recreational, or occasional use (% change since 2000)
Vacant housing units - For migrant workers (%)
Vacant housing units - For migrant workers (% change since 2000)
Vacant housing units - Other vacant (%)
Vacant housing units - Other vacant (% change since 2000)
Median monthly housing costs ($)
Median household income for houses/condos with a mortgage ($)
Median household income for houses/condos without a mortgage ($)
Median household income ($)
Median household income ($) - White
Median household income ($) - Black or African American
Median household income ($) - Asian
Median household income ($) - Hispanic or Latino
Median household income ($) - American Indian and Alaska Native
Median household income ($) - Multirace
Median household income ($) - Other Race
Mortgage status - with mortgage (%)
Mortgage status - with second mortgage (%)
Mortgage status - with home equity loan (%)
Mortgage status - with both second mortgage and home equity loan (%)
Mortgage status - without a mortgage (%)
Median year house/condo built
Median year apartment built
Household type by relationship - Male householder living alone (%)
Household type by relationship - Male householder not living alone (%)
Household type by relationship - Female householder living alone (%)
Household type by relationship - Female householder not living alone (%)
Household type by relationship - Opposite-Sex spouse (%)
Household type by relationship - Same-Sex spouse (%)
Household type by relationship - Opposite-Sex unmarried partner (%)
Household type by relationship - Same-Sex unmarried partner (%)
Household type by relationship - In group quarters (%)
Size of family households - 2-person household (%)
Size of family households - 3-person household (%)
Size of family households - 4-person household (%)
Size of family households - 5-person household (%)
Size of family households - 6-person household (%)
Size of family households - 7-or-more-person household (%)
Size of nonfamily households - 1-person household (%)
Size of nonfamily households - 2-person household (%)
Size of nonfamily households - 3-person household (%)
Size of nonfamily households - 4-person household (%)
Size of nonfamily households - 5-person household (%)
Size of nonfamily households - 6-person household (%)
Size of nonfamily households - 7-or-moreperson household (%)
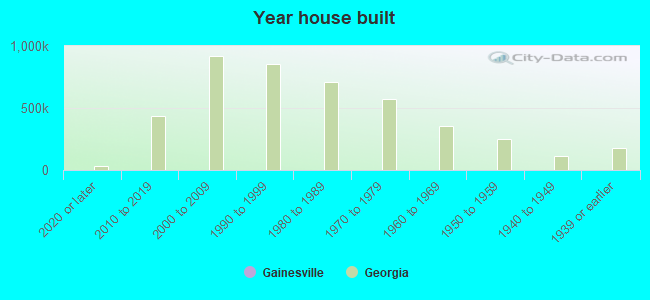
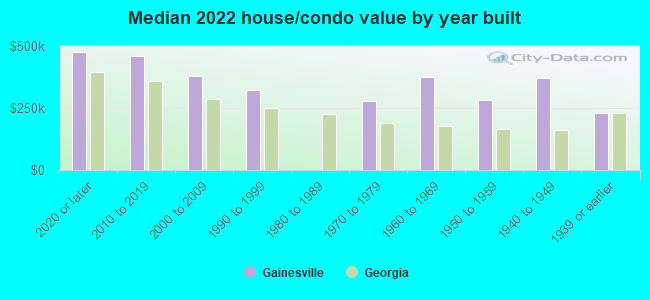
Year house built - Built 2010 or later (%)
Year house built - Built 2000 to 2009 (%)
Year house built - Built 1990 to 1999 (%)
Year house built - Built 1980 to 1989 (%)
Year house built - Built 1970 to 1979 (%)
Year house built - Built 1960 to 1969 (%)
Year house built - Built 1950 to 1959 (%)
Year house built - Built 1940 to 1949 (%)
Year house built - Built 1939 or earlier (%)
Median number of rooms in houses and condos
Median number of rooms in apartments
Median number of bedrooms in owner occupied houses
Mean number of bedrooms in owner occupied houses
Median number of bedrooms in renter occupied houses
Mean number of bedrooms in renter occupied houses
Median number of vehichles in owner occupied houses
Mean number of vehichles in owner occupied houses
Median number of vehichles in renter occupied houses
Mean number of vehichles in renter occupied houses
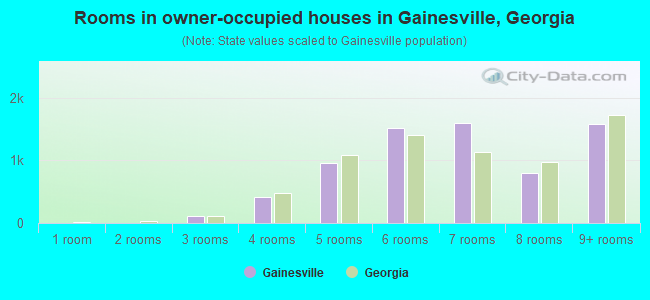
Rooms in owner-occupied houses - 1 room (%)
Rooms in owner-occupied houses - 2 rooms (%)
Rooms in owner-occupied houses - 3 rooms (%)
Rooms in owner-occupied houses - 4 rooms (%)
Rooms in owner-occupied houses - 5 rooms (%)
Rooms in owner-occupied houses - 6 rooms (%)
Rooms in owner-occupied houses - 7 rooms (%)
Rooms in owner-occupied houses - 8 rooms (%)
Rooms in owner-occupied houses - 9+ rooms (%)
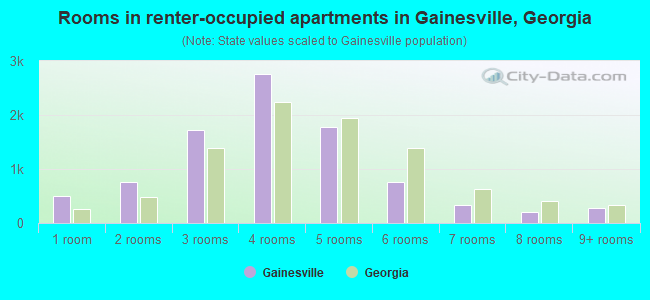
Rooms in renter-occupied houses - 1 room (%)
Rooms in renter-occupied houses - 2 rooms (%)
Rooms in renter-occupied houses - 3 rooms (%)
Rooms in renter-occupied houses - 4 rooms (%)
Rooms in renter-occupied houses - 5 rooms (%)
Rooms in renter-occupied houses - 6 rooms (%)
Rooms in renter-occupied houses - 7 rooms (%)
Rooms in renter-occupied houses - 8 rooms (%)
Rooms in renter-occupied houses - 9+ rooms (%)
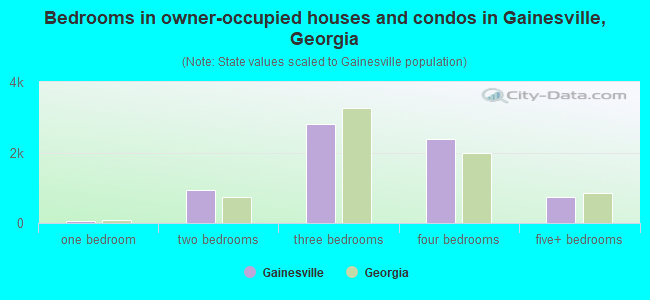
Bedrooms in owner-occupied houses - no bedrooms (%)
Bedrooms in owner-occupied houses - 1 bedroom (%)
Bedrooms in owner-occupied houses - 2 bedrooms (%)
Bedrooms in owner-occupied houses - 3 bedrooms (%)
Bedrooms in owner-occupied houses - 4 bedrooms (%)
Bedrooms in owner-occupied houses - 5+ bedrooms (%)
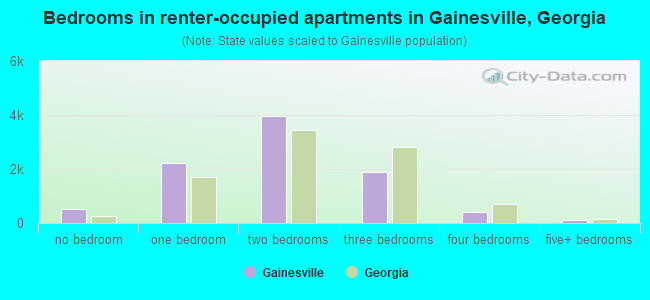
Bedrooms in renter-occupied houses - no bedrooms (%)
Bedrooms in renter-occupied houses - 1 bedroom (%)
Bedrooms in renter-occupied houses - 2 bedrooms (%)
Bedrooms in renter-occupied houses - 3 bedrooms (%)
Bedrooms in renter-occupied houses - 4 bedrooms (%)
Bedrooms in renter-occupied houses - 5+ bedrooms (%)
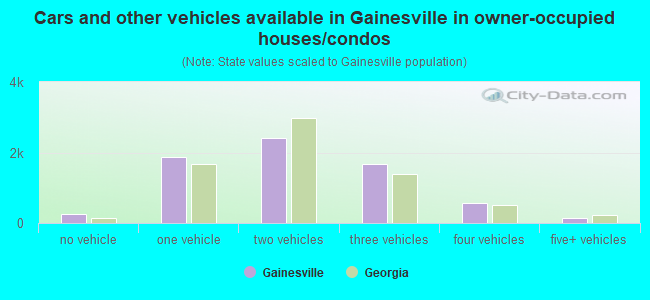
Vehicles available in owner-occupied houses - no vehicle available (%)
Vehicles available in owner-occupied houses - 1 vehicle available(%)
Vehicles available in owner-occupied houses - 2 Vehicles available (%)
Vehicles available in owner-occupied houses - 3 Vehicles available (%)
Vehicles available in owner-occupied houses - 4 Vehicles available (%)
Vehicles available in owner-occupied houses - 5+ Vehicles available (%)
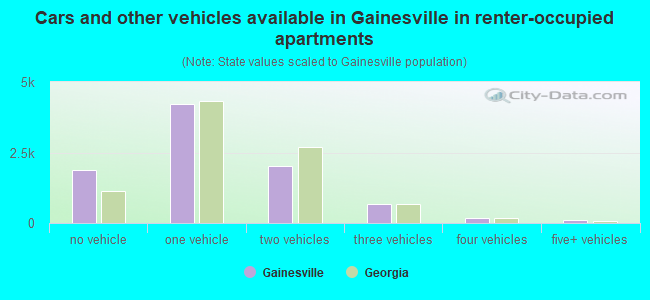
Vehicles available in renter-occupied houses - no vehicle available (%)
Vehicles available in renter-occupied houses - 1 vehicle available (%)
Vehicles available in renter-occupied houses - 2 Vehicles available (%)
Vehicles available in renter-occupied houses - 3 Vehicles available (%)
Vehicles available in renter-occupied houses - 4 Vehicles available (%)
Vehicles available in renter-occupied houses - 5+ Vehicles available (%)
Housing units in structures - 1, detached (%)
Housing units in structures - 1, attached (%)
Housing units in structures - 2 (%)
Housing units in structures - 3 or 4 (%)
Housing units in structures - 5 to 9 (%)
Housing units in structures - 10 to 19 (%)
Housing units in structures - 20 to 49 (%)
Housing units in structures - 50 or more (%)
Housing units in structures - Mobile home (%)
Housing units in structures - Boat, RV, van, etc. (%)
Housing units in structures - Owners - 1, detached (%)
Housing units in structures - Owners - 1, attached (%)
Housing units in structures - Owners - 2 (%)
Housing units in structures - Owners - 3 or 4 (%)
Housing units in structures - Owners - 5 to 9 (%)
Housing units in structures - Owners - 10 to 19 (%)
Housing units in structures - Owners - 20 to 49 (%)
Housing units in structures - Owners - 50 or more (%)
Housing units in structures - Owners - Mobile home (%)
Housing units in structures - Owners - Boat, RV, van, etc. (%)
Housing units in structures - Renters - 1, detached (%)
Housing units in structures - Renters - 1, attached (%)
Housing units in structures - Renters - 2 (%)
Housing units in structures - Renters - 3 or 4 (%)
Housing units in structures - Renters - 5 to 9 (%)
Housing units in structures - Renters - 10 to 19 (%)
Housing units in structures - Renters - 20 to 49 (%)
Housing units in structures - Renters - 50 or more (%)
Housing units in structures - Renters - Mobile home (%)
Housing units in structures - Renters - Boat, RV, van, etc. (%)
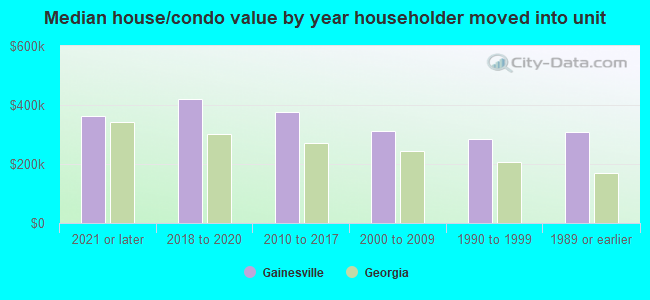
House/condo owner moved in on average (years ago)
Renter moved in on average (years ago)
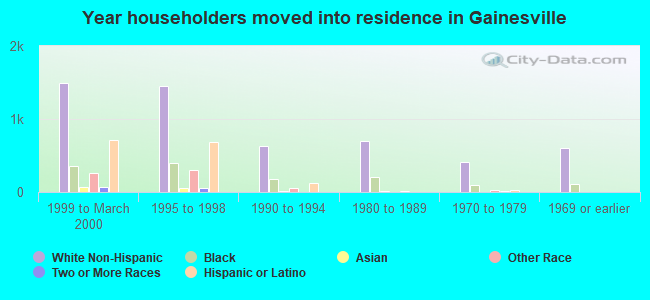
Year householder moved into unit - Moved in 1999 to March 2000 (%)
Year householder moved into unit - Moved in 1999 to March 2000 (%) - White
Year householder moved into unit - Moved in 1999 to March 2000 (%) - Black or African American
Year householder moved into unit - Moved in 1999 to March 2000 (%) - Asian
Year householder moved into unit - Moved in 1999 to March 2000 (%) - Hispanic or Latino
Year householder moved into unit - Moved in 1999 to March 2000 (%) - American Indian and Alaska Native
Year householder moved into unit - Moved in 1999 to March 2000 (%) - Multirace
Year householder moved into unit - Moved in 1999 to March 2000 (%) - Other Race
Year householder moved into unit - Moved in 1995 to 1998 (%)
Year householder moved into unit - Moved in 1995 to 1998 (%) - White
Year householder moved into unit - Moved in 1995 to 1998 (%) - Black or African American
Year householder moved into unit - Moved in 1995 to 1998 (%) - Asian
Year householder moved into unit - Moved in 1995 to 1998 (%) - Hispanic or Latino
Year householder moved into unit - Moved in 1995 to 1998 (%) - American Indian and Alaska Native
Year householder moved into unit - Moved in 1995 to 1998 (%) - Multirace
Year householder moved into unit - Moved in 1995 to 1998 (%) - Other Race
Year householder moved into unit - Moved in 1990 to 1994 (%)
Year householder moved into unit - Moved in 1990 to 1994 (%) - White
Year householder moved into unit - Moved in 1990 to 1994 (%) - Black or African American
Year householder moved into unit - Moved in 1990 to 1994 (%) - Asian
Year householder moved into unit - Moved in 1990 to 1994 (%) - Hispanic or Latino
Year householder moved into unit - Moved in 1990 to 1994 (%) - American Indian and Alaska Native
Year householder moved into unit - Moved in 1990 to 1994 (%) - Multirace
Year householder moved into unit - Moved in 1990 to 1994 (%) - Other Race
Year householder moved into unit - Moved in 1980 to 1989 (%)
Year householder moved into unit - Moved in 1980 to 1989 (%) - White
Year householder moved into unit - Moved in 1980 to 1989 (%) - Black or African American
Year householder moved into unit - Moved in 1980 to 1989 (%) - Asian
Year householder moved into unit - Moved in 1980 to 1989 (%) - Hispanic or Latino
Year householder moved into unit - Moved in 1980 to 1989 (%) - American Indian and Alaska Native
Year householder moved into unit - Moved in 1980 to 1989 (%) - Multirace
Year householder moved into unit - Moved in 1980 to 1989 (%) - Other Race
Year householder moved into unit - Moved in 1970 to 1979 (%)
Year householder moved into unit - Moved in 1970 to 1979 (%) - White
Year householder moved into unit - Moved in 1970 to 1979 (%) - Black or African American
Year householder moved into unit - Moved in 1970 to 1979 (%) - Asian
Year householder moved into unit - Moved in 1970 to 1979 (%) - Hispanic or Latino
Year householder moved into unit - Moved in 1970 to 1979 (%) - American Indian and Alaska Native
Year householder moved into unit - Moved in 1970 to 1979 (%) - Multirace
Year householder moved into unit - Moved in 1970 to 1979 (%) - Other Race
Year householder moved into unit - Moved in 1969 or earlier (%)
Year householder moved into unit - Moved in 1969 or earlier (%) - White
Year householder moved into unit - Moved in 1969 or earlier (%) - Black or African American
Year householder moved into unit - Moved in 1969 or earlier (%) - Asian
Year householder moved into unit - Moved in 1969 or earlier (%) - Hispanic or Latino
Year householder moved into unit - Moved in 1969 or earlier (%) - American Indian and Alaska Native
Year householder moved into unit - Moved in 1969 or earlier (%) - Multirace
Year householder moved into unit - Moved in 1969 or earlier (%) - Other Race
Housing units lacking complete plumbing facilities (%)
Housing units lacking complete kitchen facilities (%)
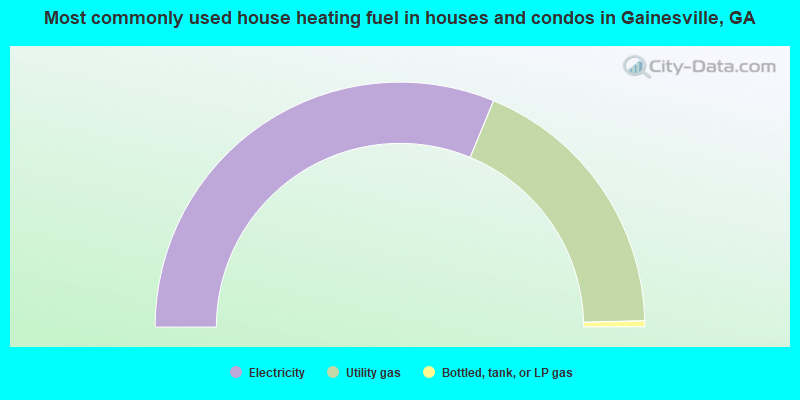
House heating fuel used in houses and condos - Utility gas (%)
House heating fuel used in houses and condos - Bottled, tank, or LP gas (%)
House heating fuel used in houses and condos - Electricity (%)
House heating fuel used in houses and condos - Fuel oil, kerosene, etc. (%)
House heating fuel used in houses and condos - Coal or coke (%)
House heating fuel used in houses and condos - Wood (%)
House heating fuel used in houses and condos - Solar energy (%)
House heating fuel used in houses and condos - Other fuel (%)
House heating fuel used in houses and condos - No fuel used (%)
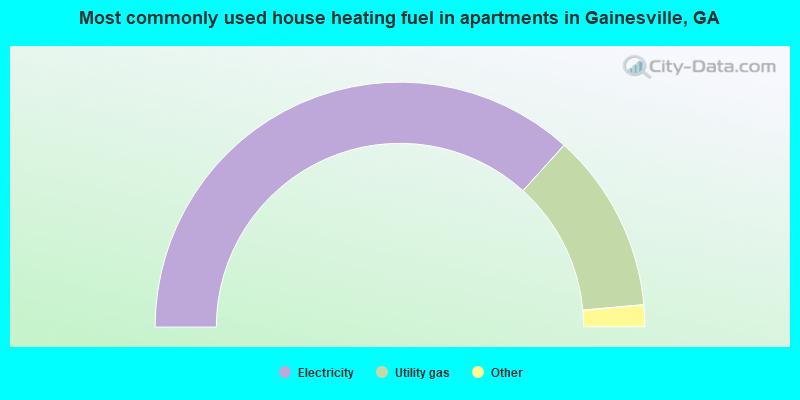
House heating fuel used in apartments - Utility gas (%)
House heating fuel used in apartments - Bottled, tank, or LP gas (%)
House heating fuel used in apartments - Electricity (%)
House heating fuel used in apartments - Fuel oil, kerosene, etc. (%)
House heating fuel used in apartments - Coal or coke (%)
House heating fuel used in apartments - Wood (%)
House heating fuel used in apartments - Solar energy (%)
House heating fuel used in apartments - Other fuel (%)
House heating fuel used in apartments - No fuel used (%)
Latest news about housing in Gainesville, GA collected exclusively by city-data.com from local newspapers, TV, and radio stations
Median year house/condo built: 2003Median year apartment built: 1989Household type by relationship:
Households: 44,395
Male householders: 6,796 (1,457 living alone ), Female householders: 8,733 (3,256 living alone )6,313 spouses (6,276 opposite-sex spouses ), 1,204 unmarried partners , (1,193 opposite-sex unmarried partners ), 13,881 children (13,213 natural , 281 adopted , 386 stepchildren ), 1,047 grandchildren , 728 brothers or sisters , 1,270 parents , 0 foster children , 1,313 other relatives , 1,503 non-relatives In group quarters: 1,602
Size of family households: 3,819 2-persons , 1,953 3-persons , 2,070 4-persons , 1,072 5-persons , 537 6-persons , 460 7-or-more-persons .
Size of nonfamily households: 4,962 1-person , 1,093 2-persons , 96 3-persons , 35 4-persons .
4,990 married couples with children. single-parent households (586 men , 4,483 women ).
60.2% of residents of Gainesville speak English at home. of residents speak Spanish at home (59% speak English very well , 12% speak English well , 15% speak English not well , 14% don't speak English at all ).of residents speak other Indo-European language at home (61% speak English very well , 4% speak English well , 22% speak English not well , 13% don't speak English at all ).of residents speak Asian or Pacific Island language at home (65% speak English very well , 16% speak English well , 15% speak English not well , 4% don't speak English at all ).of residents speak other language at home (57% speak English very well , 25% speak English well , 17% don't speak English at all ).
Foreign born population: 9,925 (22.4%)of them are naturalized citizens )
Median number of rooms in houses and condos:
Median number of rooms in apartments
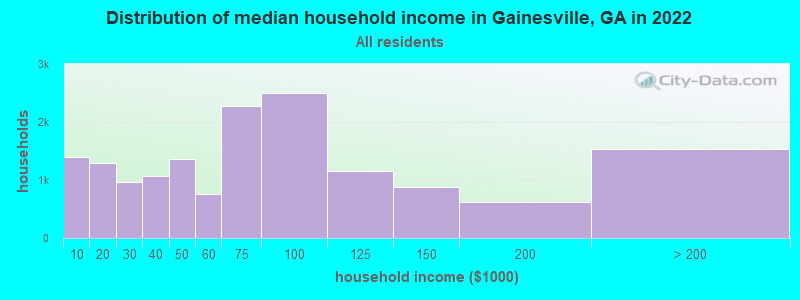
Gainesville, GA household income distribution 1,390 Less than $10,0001,289 $10,000 to $19,999967 $20,000 to $29,9991,061 $30,000 to $39,9991,361 $40,000 to $49,999764 $50,000 to $59,9992,278 $60,000 to $74,9992,503 $75,000 to $99,9991,156 $100,000 to $124,999887 $125,000 to $149,999621 $150,000 to $199,9991,530 $200,000 or more
Home value of owner - occupied houses in 2022 in Gainesville, GA 13 Less than $10,00073 $20,000 to $24,99969 $30,000 to $34,99911 $40,000 to $49,99936 $60,000 to $69,99920 $80,000 to $89,999122 $100,000 to $124,99982 $125,000 to $149,999172 $150,000 to $174,999363 $175,000 to $199,999616 $200,000 to $249,999794 $250,000 to $299,9991,622 $300,000 to $399,9991,315 $400,000 to $499,9991,126 $500,000 to $749,999312 $750,000 to $999,999206 $1,000,000 to $1,499,99965 $1,500,000 to $1,999,99947 $2,000,000 or moreRent paid by renters in 2022 in Gainesville, GA 114 Less than $100269 $100 to $14934 $150 to $199279 $200 to $2498 $250 to $299458 $300 to $349166 $350 to $39984 $400 to $44943 $450 to $499148 $500 to $54955 $550 to $599207 $600 to $64996 $650 to $699116 $700 to $749339 $750 to $799635 $800 to $899592 $900 to $9992,249 $1,000 to $1,2491,285 $1,250 to $1,4991,576 $1,500 to $1,999494 $2,000 to $2,49959 $2,500 to $2,99990 No cash rent
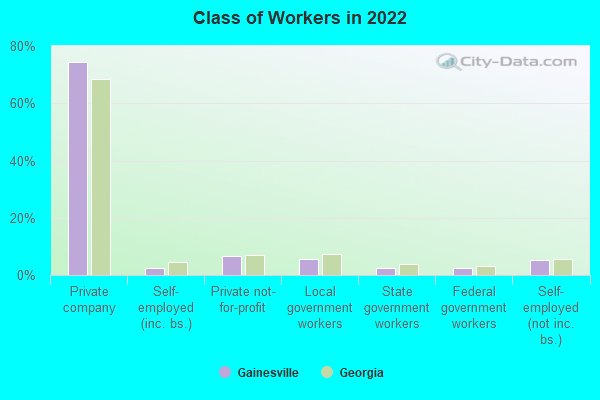
Percentage of workers working in this county: 74.0%Number of people working at home: 1,561 (7.8% of all workers )
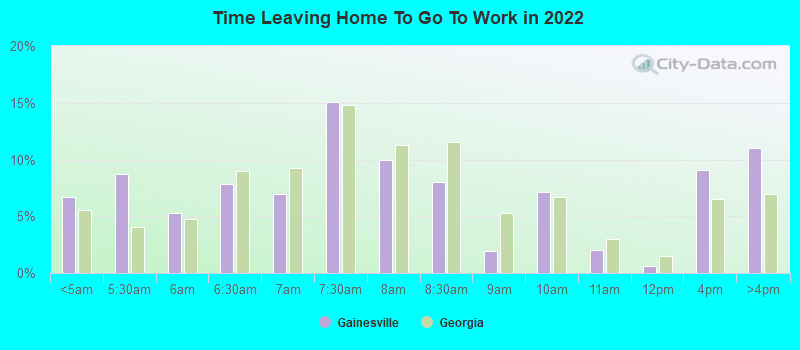
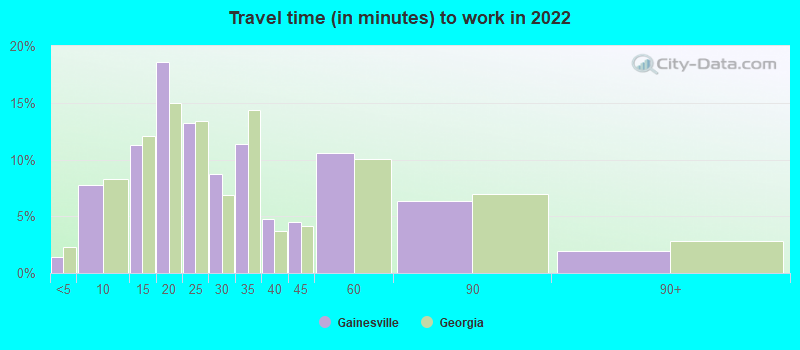
Travel time to work (commute)
Less than 5 minutes: 5425 to 9 minutes: 2,49610 to 14 minutes: 3,59415 to 19 minutes: 4,08520 to 24 minutes: 1,72625 to 29 minutes: 80830 to 34 minutes: 2,00235 to 39 minutes: 38140 to 44 minutes: 74245 to 59 minutes: 1,07060 to 89 minutes: 84690 or more minutes: 209
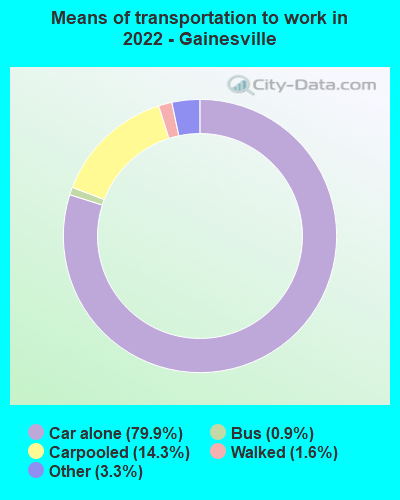
Means of transportation to work:
Drove a car alone: 39,419 (74.2%)Carpooled: 7,921 (14.9%)Bus : 357 (0.7%)Taxi: 2,243 (4.2%)Walked: 987 (1.9%)Worked at home: 1,561 (2.9%)
Unemployment by race in 2022
Unemployment rate for White non-Hispanic residents 2.1% Males5.2% FemalesUnemployment rate for Black residents 1.5% Males15.0% FemalesUnemployment rate for Asian residents 14.8% MalesUnemployment rate for other race residents 2.0% FemalesUnemployment rate for two or more race residents 1.1% Males4.6% FemalesUnemployment rate for Hispanic or Latino residents 2.7% Males7.4% Females
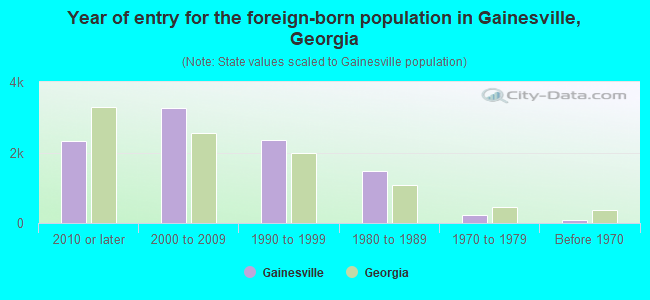
Year of entry for the foreign-born population in Gainesville, Georgia
2,337 2010 or later 3,272 2000 to 2009 2,359 1990 to 1999 1,483 1980 to 1989 222 1970 to 1979 71 Before 1970
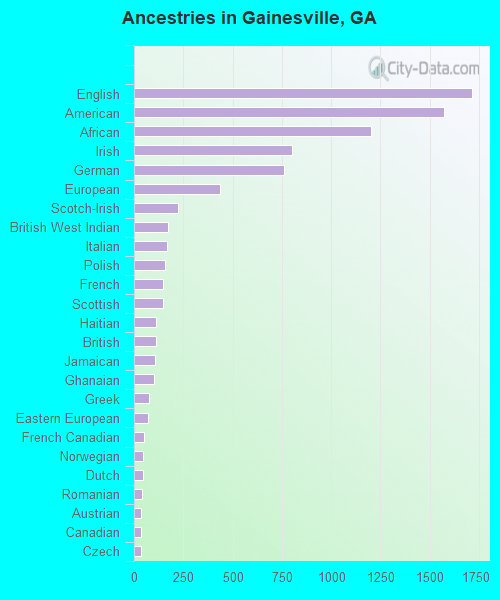
First ancestries reported:
English: 1,715 (6.9%)
American: 1,570 (6.3%)
African: 1,204 (4.8%)
Irish: 802 (3.2%)
German: 762 (3.1%)
European: 434 (1.7%)
Scotch-Irish: 221 (0.9%)
British West Indian: 171 (0.7%)
Italian: 167 (0.7%)
Polish: 158 (0.6%)
French: 147 (0.6%)
Scottish: 147 (0.6%)
Haitian: 114 (0.5%)
British: 113 (0.5%)
Jamaican: 109 (0.4%)
Ghanaian: 103 (0.4%)
Greek: 77 (0.3%)
Eastern European: 69 (0.3%)
French Canadian: 50 (0.2%)
Norwegian: 46 (0.2%)
Dutch: 45 (0.2%)
Romanian: 43 (0.2%)
Austrian: 38 (0.2%)
Canadian: 34 (0.1%)
Czech: 34 (0.1%)
Northern European: 34 (0.1%)
Welsh: 33 (0.1%)
Nigerian: 27 (0.1%)
Hungarian: 23 (0.09%)
Portuguese: 18 (0.07%)
Lebanese: 16 (0.06%)
Turkish: 16 (0.06%)
Swedish: 13 (0.05%)
Ukrainian: 9 (0.04%)
Russian: 6 (0.02%) Most common places of birth for foreign-born residents (%): Mexico Gainesville:
41.7% (4,133)Georgia:
20.0% (223,400)
El Salvador Gainesville:
17.8% (1,758)Georgia:
2.5% (27,794)
Vietnam Gainesville:
4.3% (429)Georgia:
4.1% (45,797)
Honduras Gainesville:
3.5% (345)Georgia:
2.1% (23,500)
Guatemala Gainesville:
3.3% (322)Georgia:
3.6% (39,974)
Cameroon Gainesville:
3.1% (306)Georgia:
0.3% (3,906)
Colombia Gainesville:
2.8% (279)Georgia:
2.1% (23,813)
Philippines Gainesville:
2.3% (224)Georgia:
1.8% (20,700)
Jamaica Gainesville:
1.7% (173)Georgia:
4.6% (51,270)
Democratic Republic of Congo (Zaire) Gainesville:
1.6% (159)Georgia:
0.3% (3,069)
Place of birth for U.S.-born residents:
This state: 21,540Other state: 12,535Northeast: 2,221Midwest: 3,573South: 5,413West: 1,310 78.9% of Gainesville residents lived in the same house 1 years ago.
Out of people who lived in different houses, 28.3% lived in this county.
Out of people who lived in different counties, 82.3% lived in Georgia.
Gainesville:
78.9%State average:
86.6%
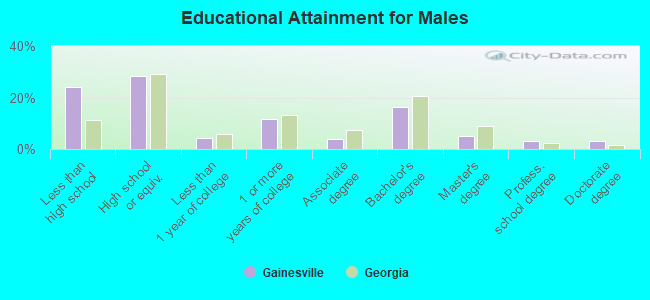
Education attainment for males 25 years and older:
No schooling: 606Nursery to 4th grade: 1335th and 6th grade: 9227th and 8th grade: 2959th grade: 48010th grade: 10411th grade: 17312th grade, no diploma: 328High school graduate (or equivalency): 3,579Less than 1 year of college: 535Some college more than 1 year, no degree: 1,486Associate degree: 505Bachelor's degree: 2,081Master's degree: 637Professional school degree: 387Doctorate degree: 383
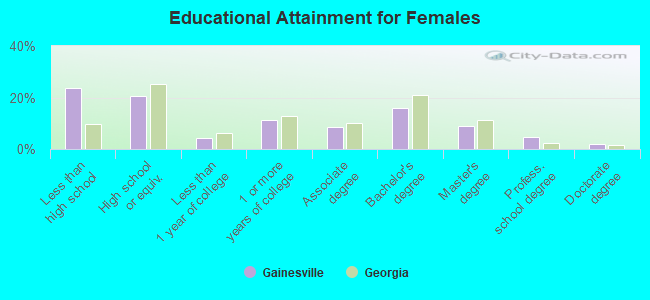
Education attainment for females 25 years and older:
No schooling: 1,192Nursery to 4th grade: 4285th and 6th grade: 6407th and 8th grade: 609th grade: 45310th grade: 23111th grade: 34212th grade, no diploma: 252High school graduate (or equivalency): 3,147Less than 1 year of college: 663Some college more than 1 year, no degree: 1,684Associate degree: 1,275Bachelor's degree: 2,425Master's degree: 1,384Professional school degree: 693Doctorate degree: 301
Housing units in structures:
One, detached: 8,630One, attached: 478Two: 4753 or 4: 8375 to 9: 2,28210 to 19: 2,71520 to 49: 1,05550 or more: 1,313Mobile homes: 272Housing units lacking complete plumbing facilities in 2022: 4.9%Housing units lacking complete kitchen facilities in 2022: 5.3%House/condo owner moved in on average 7 years ago
Renter moved in on average 1 years ago
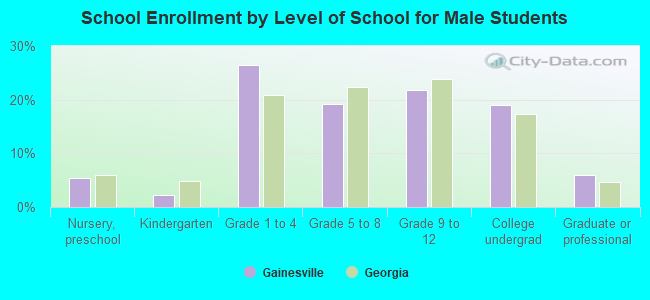
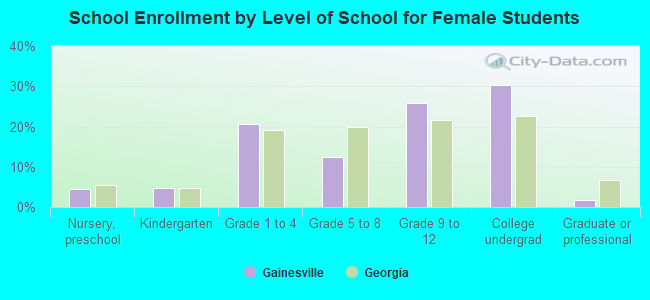
Private vs. public school enrollment:
Students in private schools in grades 1 to 8 (elementary and middle school): 311 Students in private schools in grades 9 to 12 (high school): 111 Students in private undergraduate colleges: 590