Galatia, IL (Illinois) Houses and Residents
| Galatia: | $72,186 |
| Illinois: | $251,600 |
Mean price in 2022:
Detached houses: $102,755
Here: $102,755 State: $310,164 Mobile homes: $59,557
Here: $59,557 State: $78,855
Total population: 921 (Urban population: 0, Rural population: 1,045 (8 farm, 1,037 nonfarm))
Houses: 408 (370 occupied: 308 owner occupied, 67 renter occupied)
| % of renters here: | 18% |
| State: | 33% |
Housing density: 208 houses/condos per square mile
Median price asked for vacant for-sale houses and condos in 2022 in this county: $53,275.
Median contract rent in 2022: $445
Median rent asked for vacant for-rent units in 2022: $464
Median gross rent in Galatia, IL in 2022: $815
Housing units in Galatia with a mortgage: 146 (0 second mortgage, 0 home equity loan, 0 both second mortgage and home equity loan)
Houses without a mortgage: 0
Median household income for houses/condos with a mortgage: $64,433
Median household income for apartments without a mortgage: $39,121
Median monthly housing costs: $685
Compare current foreclosures near Galatia, IL:
| Photo | Address | Area | Beds / Baths | Price | Details |
|---|---|---|---|---|---|

|
#1
Possum Flat Rd
Galatia, IL 62935
|
- sq. feet
|
2 baths 3 beds |
show details | |

|
#2
E Illinois St # B
Galatia, IL 62935
|
- sq. feet
|
- baths - beds |
show details | |

|
#3
Brown Rd
Galatia, IL 62935
|
- sq. feet
|
- baths - beds |
show details | |

|
#4
W Ogara St
Harrisburg, IL 62946
|
1,152 sq. feet
|
1 baths 3 beds |
show details | |

|
#5
County Rd 100 N
Thompsonville, IL 62890
|
- sq. feet
|
- baths - beds |
$49,900
|
show details |

|
#6
Harmony Church Rd
West Frankfort, IL 62896
|
1,610 sq. feet
|
2 baths 3 beds |
show details | |

|
#7
Napolean Rd
Marion, IL 62959
|
920 sq. feet
|
2 baths 3 beds |
show details | |

|
#8
E Gaskins St
Harrisburg, IL 62946
|
1,600 sq. feet
|
2 baths 3 beds |
show details | |

|
#9
E Gaskins St
Harrisburg, IL 62946
|
1,430 sq. feet
|
1 baths 3 beds |
show details | |

|
#10
Mitchellsville Rd
Carrier Mills, IL 62917
|
- sq. feet
|
- baths - beds |
show details |
| Photo | Address | Area | Beds / Baths | Price | Details |
|---|---|---|---|---|---|

|
#11
Galatia Post Rd
Marion, IL 62959
|
- sq. feet
|
- baths - beds |
show details | |

|
#12
Antioch Rd
West Frankfort, IL 62896
|
- sq. feet
|
- baths - beds |
show details | |

|
#13
Perry Rd
Pittsburg, IL 62974
|
- sq. feet
|
- baths - beds |
show details | |

|
#14
Ford Rd
Thompsonville, IL 62890
|
- sq. feet
|
- baths - beds |
show details | |

|
#15
Pope St
Marion, IL 62959
|
- sq. feet
|
- baths - beds |
show details | |

|
#16
Crab Orchard Rd
Marion, IL 62959
|
- sq. feet
|
- baths - beds |
show details | |

|
#17
Pittsburg Rd
Marion, IL 62959
|
- sq. feet
|
- baths - beds |
show details | |

|
#18
Stilleys Mill Rd
Marion, IL 62959
|
- sq. feet
|
- baths - beds |
show details | |

|
#19
Calico Rd
Marion, IL 62959
|
- sq. feet
|
- baths - beds |
show details | |

|
#20
W Scranton Ave
Pittsburg, IL 62974
|
- sq. feet
|
- baths - beds |
show details |
| Photo | Address | Area | Beds / Baths | Price | Details |
|---|---|---|---|---|---|

|
#21
Harris School Rd
Johnston City, IL 62951
|
- sq. feet
|
- baths - beds |
show details | |

|
#22
Saraville Rd
Marion, IL 62959
|
- sq. feet
|
- baths - beds |
show details | |

|
#23
Mauseyville Rd
Creal Springs, IL 62922
|
- sq. feet
|
- baths - beds |
show details | |

|
#24
Rock Creek Rd
Pittsburg, IL 62974
|
- sq. feet
|
- baths - beds |
show details | |

|
#25
N Calhoun St
Equality, IL 62934
|
- sq. feet
|
- baths - beds |
show details | |

|
#26
W Jackson St
Equality, IL 62934
|
- sq. feet
|
- baths - beds |
show details | |

|
#27
County Road 750 N
Mc Leansboro, IL 62859
|
- sq. feet
|
- baths - beds |
show details | |

|
#28
Spring Garden Rd
Marion, IL 62959
|
- sq. feet
|
- baths - beds |
show details | |

|
#29
Cherry St
Omaha, IL 62871
|
- sq. feet
|
- baths - beds |
show details | |

|
#30
County Road 600 E
Mc Leansboro, IL 62859
|
- sq. feet
|
- baths - beds |
show details |
| Photo | Address | Area | Beds / Baths | Price | Details |
|---|---|---|---|---|---|

|
#31
Paulton Rd
Pittsburg, IL 62974
|
- sq. feet
|
- baths - beds |
show details | |

|
#32
Paulton Rd
Pittsburg, IL 62974
|
- sq. feet
|
- baths - beds |
show details | |

|
#33
E Sloan St
Harrisburg, IL 62946
|
- sq. feet
|
- baths - beds |
show details | |

|
#34
N Thompson St
Carrier Mills, IL 62917
|
- sq. feet
|
- baths - beds |
show details | |

|
#35
Dewey Rd Apt 320
Eldorado, IL 62930
|
- sq. feet
|
- baths - beds |
show details | |

|
#36
2nd St
Broughton, IL 62817
|
- sq. feet
|
- baths - beds |
show details | |

|
#37
Madison St
Eldorado, IL 62930
|
- sq. feet
|
- baths - beds |
show details | |

|
#38
W Barnett St
Harrisburg, IL 62946
|
- sq. feet
|
- baths - beds |
show details | |

|
#39
Corinth Rd
Pittsburg, IL 62974
|
- sq. feet
|
- baths - beds |
show details | |

|
#40
Raleigh Rd
Eldorado, IL 62930
|
- sq. feet
|
- baths - beds |
show details |
| Photo | Address | Area | Beds / Baths | Price | Details |
|---|---|---|---|---|---|

|
#41
E Locust St
Harrisburg, IL 62946
|
- sq. feet
|
- baths - beds |
show details | |

|
#42
Forest St
Eldorado, IL 62930
|
- sq. feet
|
- baths - beds |
show details | |

|
#43
Homer St
Harrisburg, IL 62946
|
- sq. feet
|
- baths - beds |
show details | |

|
#44
E Clark St
West Frankfort, IL 62896
|
- sq. feet
|
- baths - beds |
show details | |

|
#45
Tyler Bridge Rd
Creal Springs, IL 62922
|
- sq. feet
|
- baths - beds |
show details | |

|
#46
Hoover Rd
Thompsonville, IL 62890
|
- sq. feet
|
- baths - beds |
show details | |

|
#47
E Cleveland St
West Frankfort, IL 62896
|
- sq. feet
|
- baths - beds |
show details | |

|
#48
W Raymond St
Harrisburg, IL 62946
|
- sq. feet
|
- baths - beds |
show details | |

|
#49
Norman Rd
Marion, IL 62959
|
- sq. feet
|
- baths - beds |
show details | |

|
Check over 1 million property listings on Foreclosure.com!
|
browse all offers | |||

Latest news about housing in Galatia, IL collected exclusively by city-data.com from local newspapers, TV, and radio stations

 | Moving from CA to Cairo...Where and what kind of work is available? (99 replies) |

Median year apartment built: 1983
Household type by relationship:
Households: 950- Male householders: 148 (59 living alone), Female householders: 214 (56 living alone)
156 spouses (156 opposite-sex spouses), 22 unmarried partners, (22 opposite-sex unmarried partners), 386 children (337 natural, 44 adopted, 4 stepchildren), 13 grandchildren, 0 brothers or sisters, 0 parents, 0 foster children, 6 other relatives, 0 non-relatives
Size of family households: 62 2-persons, 72 3-persons, 95 4-persons, 7 5-persons.
Size of nonfamily households: 121 1-person, 16 2-persons.
71 married couples with children.
118 single-parent households (0 men, 118 women).
97.5% of residents of Galatia speak English at home.
1.8% of residents speak Spanish at home (100% speak English very well).
| Here: | 5.9 |
| State: | 6.4 |
| Here: | 4.5 |
| State: | 4.1 |

- Bedrooms in owner-occupied houses and condos in Galatia, Illinois
- 0no bedroom
- 31 bedroom
- 672 bedrooms
- 1793 bedrooms
- 574 bedrooms
- 25+ bedrooms

- Bedrooms in renter-occupied apartments in Galatia, Illinois
- 0no bedroom
- 401 bedroom
- 72 bedrooms
- 203 bedrooms
- 04 bedrooms
- 05+ bedrooms

- Cars and other vehicles available in Galatia in owner-occupied houses/condos
- 10no vehicle
- 751 vehicle
- 1402 vehicles
- 433 vehicles
- 404 vehicles
- 05+ vehicles

- Cars and other vehicles available in Galatia in renter-occupied apartments
- 6no vehicle
- 521 vehicle
- 12 vehicles
- 83 vehicles
- 04 vehicles
- 05+ vehicles

- Rooms in owner-occupied houses in Galatia, Illinois
- 01 room
- 02 rooms
- 03 rooms
- 344 rooms
- 745 rooms
- 1076 rooms
- 437 rooms
- 258 rooms
- 259+ rooms

- Rooms in renter-occupied apartments in Galatia, Illinois
- 01 room
- 92 rooms
- 183 rooms
- 44 rooms
- 165 rooms
- 126 rooms
- 77 rooms
- 08 rooms
- 09+ rooms


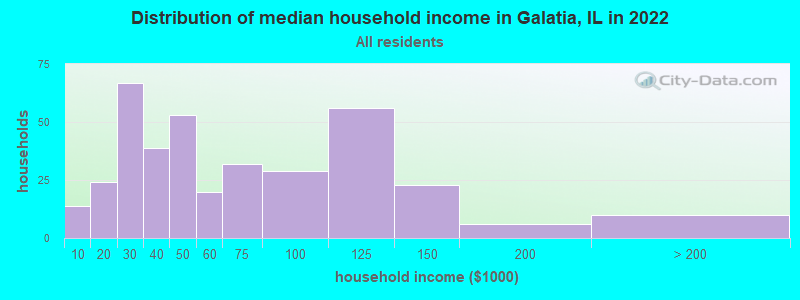
Galatia, IL household income distribution

- 14Less than $10,000
- 24$10,000 to $19,999
- 67$20,000 to $29,999
- 39$30,000 to $39,999
- 53$40,000 to $49,999
- 20$50,000 to $59,999
- 32$60,000 to $74,999
- 29$75,000 to $99,999
- 56$100,000 to $124,999
- 23$125,000 to $149,999
- 6$150,000 to $199,999
- 10$200,000 or more
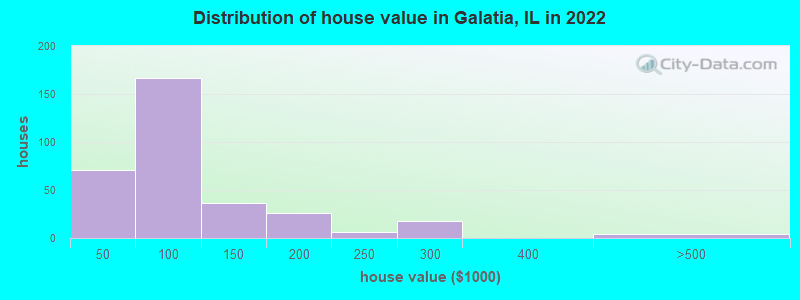
Home value of owner - occupied houses in 2022 in Galatia, IL
-
- 1Less than $10,000
- 39$10,000 to $14,999
- 1$15,000 to $19,999
- 5$20,000 to $24,999
- 2$35,000 to $39,999
- 20$40,000 to $49,999
- 30$50,000 to $59,999
- 64$60,000 to $69,999
- 21$70,000 to $79,999
- 16$80,000 to $89,999
- 12$90,000 to $99,999
- 28$100,000 to $124,999
- 7$125,000 to $149,999
- 16$150,000 to $174,999
- 8$175,000 to $199,999
- 5$200,000 to $249,999
- 18$250,000 to $299,999
- 4$400,000 to $499,999
Rent paid by renters in 2022 in Galatia, IL
-
- 7$100 to $149
- 13$200 to $249
- 1$250 to $299
- 4$300 to $349
- 3$350 to $399
- 9$500 to $549
- 4$550 to $599
- 3$750 to $799
- 3$900 to $999
- 8$2,000 to $2,499
- 6No cash rent


Percentage of workers working in this county: 67.1%
Number of people working at home: 17 (5.0% of all workers)
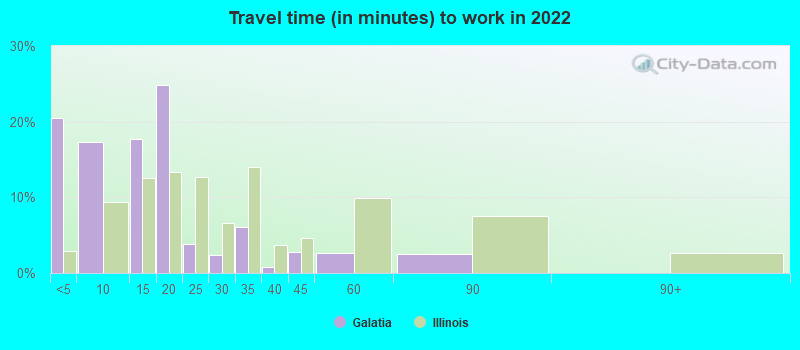
Travel time to work (commute)
- Less than 5 minutes: 25
- 5 to 9 minutes: 9
- 10 to 14 minutes: 14
- 15 to 19 minutes: 44
- 20 to 24 minutes: 100
- 25 to 29 minutes: 4
- 30 to 34 minutes: 10
- 35 to 39 minutes: 0
- 40 to 44 minutes: 5
- 45 to 59 minutes: 35
- 60 to 89 minutes: 20
- 90 or more minutes: 36
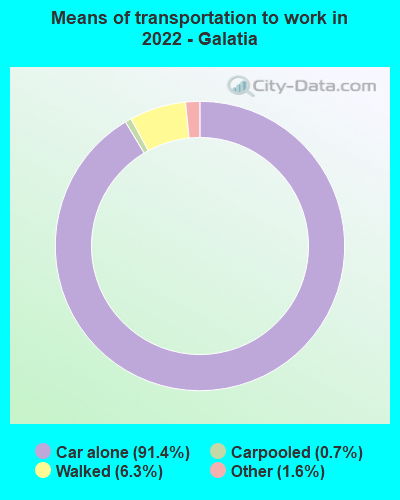
Means of transportation to work:
- Drove a car alone: 382 (82.7%)
- Carpooled: 2 (0.4%)
- Taxi: 8 (1.7%)
- Walked: 25 (5.4%)
- Worked at home: 40 (8.7%)

- Unemployment by race in 2022
- Unemployment rate for White non-Hispanic residents
- 3.9%Males
- 4.1%Females

- Year of entry for the foreign-born population in Galatia, Illinois
- 01995 to March 2000
- 01990 to 1994
- 31985 to 1989
- 01980 to 1984
- 01975 to 1979
- 01970 to 1974
- 01965 to 1969
- 0Before 1965

First ancestries reported:
- Irish: 155 (37.9%)
- English: 76 (18.6%)
- German: 66 (16.1%)
- American: 44 (10.7%)
- Welsh: 11 (2.7%)
- Italian: 8 (2.0%)
- Lithuanian: 8 (2.0%)
- French: 6 (1.5%)
- Czech: 5 (1.2%)
- Polish: 2 (0.5%)
Most common places of birth for foreign-born residents (%):
| Galatia: | 100.0% (3) |
| Illinois: | 2.1% (32,764) |
Place of birth for U.S.-born residents:
- This state: 757
- Other state: 189
- Northeast: 9
- Midwest: 129
- South: 43
- West: 8
79.9% of Galatia residents lived in the same house 1 years ago.
Out of people who lived in different houses, 48.5% lived in this county.
Out of people who lived in different counties, 100.0% lived in Illinois.
| Galatia: | 79.9% |
| State average: | 88.3% |
Education attainment for males 25 years and older:
- No schooling: 0
- Nursery to 4th grade: 0
- 5th and 6th grade: 0
- 7th and 8th grade: 0
- 9th grade: 0
- 10th grade: 0
- 11th grade: 12
- 12th grade, no diploma: 2
- High school graduate (or equivalency): 108
- Less than 1 year of college: 43
- Some college more than 1 year, no degree: 31
- Associate degree: 49
- Bachelor's degree: 27
- Master's degree: 14
- Professional school degree: 0
- Doctorate degree: 0

Education attainment for females 25 years and older:
- No schooling: 0
- Nursery to 4th grade: 0
- 5th and 6th grade: 0
- 7th and 8th grade: 1
- 9th grade: 0
- 10th grade: 17
- 11th grade: 2
- 12th grade, no diploma: 0
- High school graduate (or equivalency): 114
- Less than 1 year of college: 17
- Some college more than 1 year, no degree: 91
- Associate degree: 65
- Bachelor's degree: 31
- Master's degree: 0
- Professional school degree: 0
- Doctorate degree: 0


Housing units in structures:
- One, detached: 309
- One, attached: 5
- Two: 9
- 3 or 4: 31
- 5 to 9: 4
- Mobile homes: 50
Median worth of mobile homes: $16,372
Housing units lacking complete kitchen facilities in 2022: 1.2%
House/condo owner moved in on average 10 years ago
Renter moved in on average 1 years ago

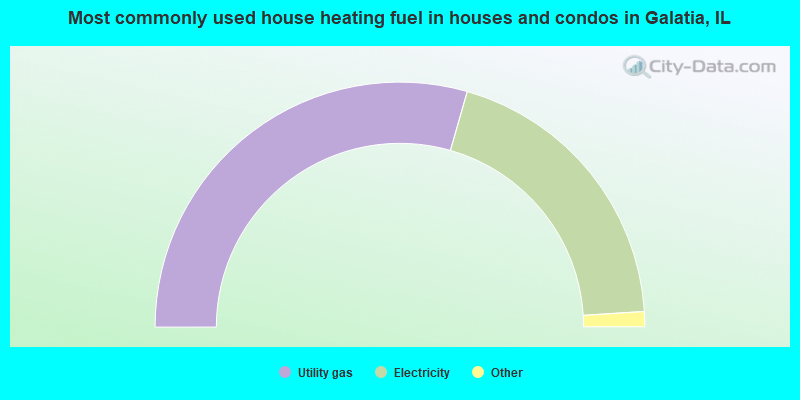
- 59.1%Utility gas
- 39.3%Electricity
- 1.0%Other fuel
- 0.7%Bottled, tank, or LP gas
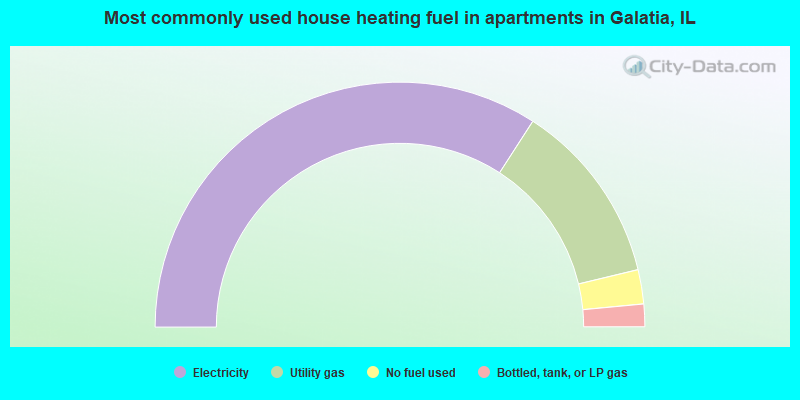
- 68.2%Electricity
- 24.2%Utility gas
- 4.5%No fuel used
- 3.0%Bottled, tank, or LP gas
Private vs. public school enrollment:
| Here: | 3.4% |
| Illinois: | 13.3% |
| Here: | 0.0% |
| Illinois: | 9.9% |
| Here: | 21.2% |
| Illinois: | 27.4% |


