Gallatin, TN (Tennessee) Houses and Residents
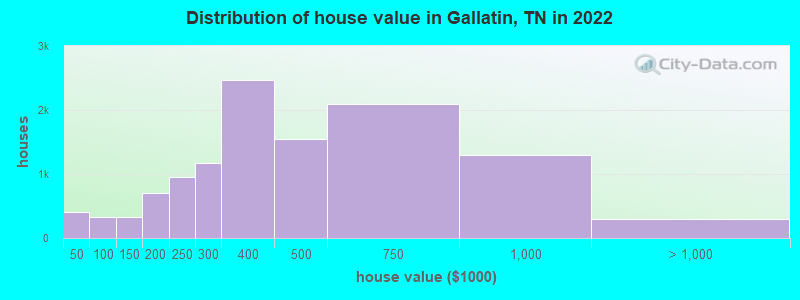
Estimated median house or condo value in 2022: $363,695 (it was $98,400 in 2000 )
Gallatin:
$363,695Tennessee:
$284,800
Lower value quartile - upper value quartile: $277,011 - $580,953Mean price in 2022: Detached houses: $476,252 Here:
$476,252State:
$374,382
Townhouses or other attached units: $288,165 Here:
$288,165State:
$354,101
In 3-to-4-unit structures: $337,307 Here:
$337,307State:
$239,060
In 5-or-more-unit structures: $245,974 Here:
$245,974State:
$317,434
Mobile homes: $62,075 Here:
$62,075State:
$101,421
Total population: 33,347 (Urban population: 22,238, Rural population: 997 (63 farm, 934 nonfarm ))
Houses: 20,030 (18,788 occupied: 11,391 owner occupied, 7,615 renter occupied )
% of renters here:
40%State:
33%
Housing density: 912 houses/condos per square mile
Median price asked for vacant for-sale houses and condos in 2022: $503,118.
Median contract rent in 2022: $1,204 (lower quartile is $820, upper quartile is $1,616)
Median rent asked for vacant for-rent units in 2022: $1,644
Median gross rent in Gallatin, TN in 2022: $1,371
Housing units in Gallatin with a mortgage: 7,508 (496 second mortgage, 0 home equity loan, 429 both second mortgage and home equity loan )Houses without a mortgage: 54
Median household income for houses/condos with a mortgage: $99,907
Median household income for apartments without a mortgage: $76,394
Median monthly housing costs: $1,333
Data:
Median house or condo value ($)
Median house or condo value ($ change since 2000)
Median house or condo value ($) - White
Median house or condo value ($) - Black or African American
Median house or condo value ($) - Asian
Median house or condo value ($) - Hispanic or Latino
Median house or condo value ($) - American Indian and Alaska Native
Median house or condo value ($) - Multirace
Median house or condo value ($) - Other Race
Median price asked for mobile homes ($)
Household density (households per square mile)
Mean house or condo value by units in structure - 1, detached ($)
Mean house or condo value by units in structure - 1, attached ($)
Mean house or condo value by units in structure - 2 ($)
Mean house or condo value by units in structure by units in structure - 3 or 4 ($)
Mean house or condo value by units in structure - 5 or more ($)
Mean house or condo value by units in structure - Boat, RV, van, etc. ($)
Mean house or condo value by units in structure - Mobile home ($)
Median contract rent ($)
Median contract rent - Lower quartile ($)
Median contract rent - Upper quartile ($)
Median gross rent ($)
Urban houses (%)
Rural houses (%)
Houses occupied (%)
Houses occupied (% change since 2000)
Houses owner occupied (%)
Houses owner occupied (% change since 2000)
Houses renter occupied (%)
Houses renter occupied (% change since 2000)
Vacant housing units - For rent (%)
Vacant housing units - For rent (% change since 2000)
Vacant housing units - For sale only (%)
Vacant housing units - For sale only (% change since 2000)
Vacant housing units - Rented or sold, not occupied (%)
Vacant housing units - Rented or sold, not occupied (% change since 2000)
Vacant housing units - For seasonal, recreational, or occasional use (%)
Vacant housing units - For seasonal, recreational, or occasional use (% change since 2000)
Vacant housing units - For migrant workers (%)
Vacant housing units - For migrant workers (% change since 2000)
Vacant housing units - Other vacant (%)
Vacant housing units - Other vacant (% change since 2000)
Median monthly housing costs ($)
Median household income for houses/condos with a mortgage ($)
Median household income for houses/condos without a mortgage ($)
Median household income ($)
Median household income ($) - White
Median household income ($) - Black or African American
Median household income ($) - Asian
Median household income ($) - Hispanic or Latino
Median household income ($) - American Indian and Alaska Native
Median household income ($) - Multirace
Median household income ($) - Other Race
Mortgage status - with mortgage (%)
Mortgage status - with second mortgage (%)
Mortgage status - with home equity loan (%)
Mortgage status - with both second mortgage and home equity loan (%)
Mortgage status - without a mortgage (%)
Median year house/condo built
Median year apartment built
Household type by relationship - Male householder living alone (%)
Household type by relationship - Male householder not living alone (%)
Household type by relationship - Female householder living alone (%)
Household type by relationship - Female householder not living alone (%)
Household type by relationship - Opposite-Sex spouse (%)
Household type by relationship - Same-Sex spouse (%)
Household type by relationship - Opposite-Sex unmarried partner (%)
Household type by relationship - Same-Sex unmarried partner (%)
Household type by relationship - In group quarters (%)
Size of family households - 2-person household (%)
Size of family households - 3-person household (%)
Size of family households - 4-person household (%)
Size of family households - 5-person household (%)
Size of family households - 6-person household (%)
Size of family households - 7-or-more-person household (%)
Size of nonfamily households - 1-person household (%)
Size of nonfamily households - 2-person household (%)
Size of nonfamily households - 3-person household (%)
Size of nonfamily households - 4-person household (%)
Size of nonfamily households - 5-person household (%)
Size of nonfamily households - 6-person household (%)
Size of nonfamily households - 7-or-moreperson household (%)
Year house built - Built 2010 or later (%)
Year house built - Built 2000 to 2009 (%)
Year house built - Built 1990 to 1999 (%)
Year house built - Built 1980 to 1989 (%)
Year house built - Built 1970 to 1979 (%)
Year house built - Built 1960 to 1969 (%)
Year house built - Built 1950 to 1959 (%)
Year house built - Built 1940 to 1949 (%)
Year house built - Built 1939 or earlier (%)
Median number of rooms in houses and condos
Median number of rooms in apartments
Median number of bedrooms in owner occupied houses
Mean number of bedrooms in owner occupied houses
Median number of bedrooms in renter occupied houses
Mean number of bedrooms in renter occupied houses
Median number of vehichles in owner occupied houses
Mean number of vehichles in owner occupied houses
Median number of vehichles in renter occupied houses
Mean number of vehichles in renter occupied houses
Rooms in owner-occupied houses - 1 room (%)
Rooms in owner-occupied houses - 2 rooms (%)
Rooms in owner-occupied houses - 3 rooms (%)
Rooms in owner-occupied houses - 4 rooms (%)
Rooms in owner-occupied houses - 5 rooms (%)
Rooms in owner-occupied houses - 6 rooms (%)
Rooms in owner-occupied houses - 7 rooms (%)
Rooms in owner-occupied houses - 8 rooms (%)
Rooms in owner-occupied houses - 9+ rooms (%)
Rooms in renter-occupied houses - 1 room (%)
Rooms in renter-occupied houses - 2 rooms (%)
Rooms in renter-occupied houses - 3 rooms (%)
Rooms in renter-occupied houses - 4 rooms (%)
Rooms in renter-occupied houses - 5 rooms (%)
Rooms in renter-occupied houses - 6 rooms (%)
Rooms in renter-occupied houses - 7 rooms (%)
Rooms in renter-occupied houses - 8 rooms (%)
Rooms in renter-occupied houses - 9+ rooms (%)
Bedrooms in owner-occupied houses - no bedrooms (%)
Bedrooms in owner-occupied houses - 1 bedroom (%)
Bedrooms in owner-occupied houses - 2 bedrooms (%)
Bedrooms in owner-occupied houses - 3 bedrooms (%)
Bedrooms in owner-occupied houses - 4 bedrooms (%)
Bedrooms in owner-occupied houses - 5+ bedrooms (%)
Bedrooms in renter-occupied houses - no bedrooms (%)
Bedrooms in renter-occupied houses - 1 bedroom (%)
Bedrooms in renter-occupied houses - 2 bedrooms (%)
Bedrooms in renter-occupied houses - 3 bedrooms (%)
Bedrooms in renter-occupied houses - 4 bedrooms (%)
Bedrooms in renter-occupied houses - 5+ bedrooms (%)
Vehicles available in owner-occupied houses - no vehicle available (%)
Vehicles available in owner-occupied houses - 1 vehicle available(%)
Vehicles available in owner-occupied houses - 2 Vehicles available (%)
Vehicles available in owner-occupied houses - 3 Vehicles available (%)
Vehicles available in owner-occupied houses - 4 Vehicles available (%)
Vehicles available in owner-occupied houses - 5+ Vehicles available (%)
Vehicles available in renter-occupied houses - no vehicle available (%)
Vehicles available in renter-occupied houses - 1 vehicle available (%)
Vehicles available in renter-occupied houses - 2 Vehicles available (%)
Vehicles available in renter-occupied houses - 3 Vehicles available (%)
Vehicles available in renter-occupied houses - 4 Vehicles available (%)
Vehicles available in renter-occupied houses - 5+ Vehicles available (%)
Housing units in structures - 1, detached (%)
Housing units in structures - 1, attached (%)
Housing units in structures - 2 (%)
Housing units in structures - 3 or 4 (%)
Housing units in structures - 5 to 9 (%)
Housing units in structures - 10 to 19 (%)
Housing units in structures - 20 to 49 (%)
Housing units in structures - 50 or more (%)
Housing units in structures - Mobile home (%)
Housing units in structures - Boat, RV, van, etc. (%)
Housing units in structures - Owners - 1, detached (%)
Housing units in structures - Owners - 1, attached (%)
Housing units in structures - Owners - 2 (%)
Housing units in structures - Owners - 3 or 4 (%)
Housing units in structures - Owners - 5 to 9 (%)
Housing units in structures - Owners - 10 to 19 (%)
Housing units in structures - Owners - 20 to 49 (%)
Housing units in structures - Owners - 50 or more (%)
Housing units in structures - Owners - Mobile home (%)
Housing units in structures - Owners - Boat, RV, van, etc. (%)
Housing units in structures - Renters - 1, detached (%)
Housing units in structures - Renters - 1, attached (%)
Housing units in structures - Renters - 2 (%)
Housing units in structures - Renters - 3 or 4 (%)
Housing units in structures - Renters - 5 to 9 (%)
Housing units in structures - Renters - 10 to 19 (%)
Housing units in structures - Renters - 20 to 49 (%)
Housing units in structures - Renters - 50 or more (%)
Housing units in structures - Renters - Mobile home (%)
Housing units in structures - Renters - Boat, RV, van, etc. (%)
House/condo owner moved in on average (years ago)
Renter moved in on average (years ago)
Year householder moved into unit - Moved in 1999 to March 2000 (%)
Year householder moved into unit - Moved in 1999 to March 2000 (%) - White
Year householder moved into unit - Moved in 1999 to March 2000 (%) - Black or African American
Year householder moved into unit - Moved in 1999 to March 2000 (%) - Asian
Year householder moved into unit - Moved in 1999 to March 2000 (%) - Hispanic or Latino
Year householder moved into unit - Moved in 1999 to March 2000 (%) - American Indian and Alaska Native
Year householder moved into unit - Moved in 1999 to March 2000 (%) - Multirace
Year householder moved into unit - Moved in 1999 to March 2000 (%) - Other Race
Year householder moved into unit - Moved in 1995 to 1998 (%)
Year householder moved into unit - Moved in 1995 to 1998 (%) - White
Year householder moved into unit - Moved in 1995 to 1998 (%) - Black or African American
Year householder moved into unit - Moved in 1995 to 1998 (%) - Asian
Year householder moved into unit - Moved in 1995 to 1998 (%) - Hispanic or Latino
Year householder moved into unit - Moved in 1995 to 1998 (%) - American Indian and Alaska Native
Year householder moved into unit - Moved in 1995 to 1998 (%) - Multirace
Year householder moved into unit - Moved in 1995 to 1998 (%) - Other Race
Year householder moved into unit - Moved in 1990 to 1994 (%)
Year householder moved into unit - Moved in 1990 to 1994 (%) - White
Year householder moved into unit - Moved in 1990 to 1994 (%) - Black or African American
Year householder moved into unit - Moved in 1990 to 1994 (%) - Asian
Year householder moved into unit - Moved in 1990 to 1994 (%) - Hispanic or Latino
Year householder moved into unit - Moved in 1990 to 1994 (%) - American Indian and Alaska Native
Year householder moved into unit - Moved in 1990 to 1994 (%) - Multirace
Year householder moved into unit - Moved in 1990 to 1994 (%) - Other Race
Year householder moved into unit - Moved in 1980 to 1989 (%)
Year householder moved into unit - Moved in 1980 to 1989 (%) - White
Year householder moved into unit - Moved in 1980 to 1989 (%) - Black or African American
Year householder moved into unit - Moved in 1980 to 1989 (%) - Asian
Year householder moved into unit - Moved in 1980 to 1989 (%) - Hispanic or Latino
Year householder moved into unit - Moved in 1980 to 1989 (%) - American Indian and Alaska Native
Year householder moved into unit - Moved in 1980 to 1989 (%) - Multirace
Year householder moved into unit - Moved in 1980 to 1989 (%) - Other Race
Year householder moved into unit - Moved in 1970 to 1979 (%)
Year householder moved into unit - Moved in 1970 to 1979 (%) - White
Year householder moved into unit - Moved in 1970 to 1979 (%) - Black or African American
Year householder moved into unit - Moved in 1970 to 1979 (%) - Asian
Year householder moved into unit - Moved in 1970 to 1979 (%) - Hispanic or Latino
Year householder moved into unit - Moved in 1970 to 1979 (%) - American Indian and Alaska Native
Year householder moved into unit - Moved in 1970 to 1979 (%) - Multirace
Year householder moved into unit - Moved in 1970 to 1979 (%) - Other Race
Year householder moved into unit - Moved in 1969 or earlier (%)
Year householder moved into unit - Moved in 1969 or earlier (%) - White
Year householder moved into unit - Moved in 1969 or earlier (%) - Black or African American
Year householder moved into unit - Moved in 1969 or earlier (%) - Asian
Year householder moved into unit - Moved in 1969 or earlier (%) - Hispanic or Latino
Year householder moved into unit - Moved in 1969 or earlier (%) - American Indian and Alaska Native
Year householder moved into unit - Moved in 1969 or earlier (%) - Multirace
Year householder moved into unit - Moved in 1969 or earlier (%) - Other Race
Housing units lacking complete plumbing facilities (%)
Housing units lacking complete kitchen facilities (%)
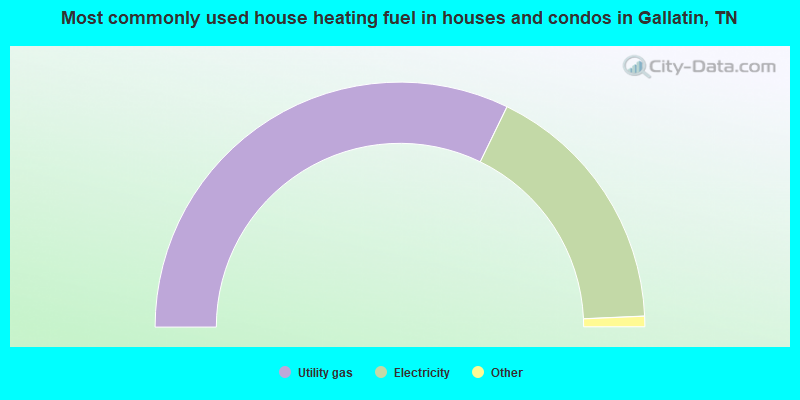
House heating fuel used in houses and condos - Utility gas (%)
House heating fuel used in houses and condos - Bottled, tank, or LP gas (%)
House heating fuel used in houses and condos - Electricity (%)
House heating fuel used in houses and condos - Fuel oil, kerosene, etc. (%)
House heating fuel used in houses and condos - Coal or coke (%)
House heating fuel used in houses and condos - Wood (%)
House heating fuel used in houses and condos - Solar energy (%)
House heating fuel used in houses and condos - Other fuel (%)
House heating fuel used in houses and condos - No fuel used (%)
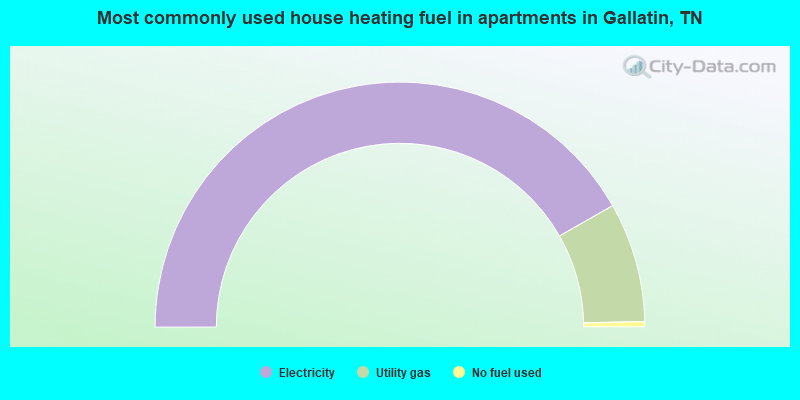
House heating fuel used in apartments - Utility gas (%)
House heating fuel used in apartments - Bottled, tank, or LP gas (%)
House heating fuel used in apartments - Electricity (%)
House heating fuel used in apartments - Fuel oil, kerosene, etc. (%)
House heating fuel used in apartments - Coal or coke (%)
House heating fuel used in apartments - Wood (%)
House heating fuel used in apartments - Solar energy (%)
House heating fuel used in apartments - Other fuel (%)
House heating fuel used in apartments - No fuel used (%)
Latest news about housing in Gallatin, TN collected exclusively by city-data.com from local newspapers, TV, and radio stations
Median year house/condo built: 2005Median year apartment built: 2002Household type by relationship:
Households: 46,548
Male householders: 9,275 (2,595 living alone ), Female householders: 9,270 (2,673 living alone )8,744 spouses (8,744 opposite-sex spouses ), 1,194 unmarried partners , (1,161 opposite-sex unmarried partners ), 13,482 children (12,494 natural , 485 adopted , 502 stepchildren ), 822 grandchildren , 383 brothers or sisters , 534 parents , 82 foster children , 506 other relatives , 1,240 non-relatives In group quarters: 1,010
Size of family households: 5,344 2-persons , 2,685 3-persons , 2,399 4-persons , 1,525 5-persons , 189 6-persons , 157 7-or-more-persons .
Size of nonfamily households: 5,405 1-person , 1,336 2-persons , 265 3-persons , 9 5-persons .
6,489 married couples with children. single-parent households (617 men , 1,920 women ).
90.8% of residents of Gallatin speak English at home. of residents speak Spanish at home (61% speak English very well , 13% speak English well , 21% speak English not well , 5% don't speak English at all ).of residents speak other Indo-European language at home (91% speak English very well , 4% speak English well , 4% speak English not well , 1% don't speak English at all ).of residents speak Asian or Pacific Island language at home (33% speak English very well , 26% speak English well , 39% speak English not well , 1% don't speak English at all ).of residents speak other language at home (67% speak English very well , 33% speak English well ).
Foreign born population: 2,593 (5.6%)of them are naturalized citizens )
Median number of rooms in houses and condos:
Median number of rooms in apartments
Owner-occupied Renter-occupied
Rooms in owner-occupied houses in Gallatin, Tennessee
15 1 room 0 2 rooms 39 3 rooms 803 4 rooms 1,905 5 rooms 3,105 6 rooms 1,369 7 rooms 1,339 8 rooms 2,816 9+ rooms
Rooms in renter-occupied apartments in Gallatin, Tennessee
299 1 room 265 2 rooms 1,404 3 rooms 2,359 4 rooms 1,624 5 rooms 1,042 6 rooms 446 7 rooms 98 8 rooms 77 9+ rooms
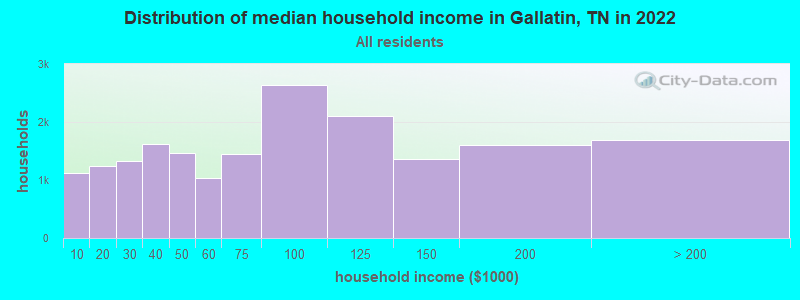
Gallatin, TN household income distribution 1,114 Less than $10,0001,240 $10,000 to $19,9991,330 $20,000 to $29,9991,624 $30,000 to $39,9991,460 $40,000 to $49,9991,043 $50,000 to $59,9991,449 $60,000 to $74,9992,642 $75,000 to $99,9992,095 $100,000 to $124,9991,361 $125,000 to $149,9991,599 $150,000 to $199,9991,683 $200,000 or more
Home value of owner - occupied houses in 2022 in Gallatin, TN 153 Less than $10,00064 $10,000 to $14,99913 $15,000 to $19,99942 $20,000 to $24,99945 $25,000 to $29,99951 $30,000 to $34,99925 $35,000 to $39,9998 $40,000 to $49,9993 $50,000 to $59,99920 $60,000 to $69,999102 $70,000 to $79,999134 $80,000 to $89,99957 $90,000 to $99,999228 $100,000 to $124,99999 $125,000 to $149,999264 $150,000 to $174,999444 $175,000 to $199,999952 $200,000 to $249,9991,178 $250,000 to $299,9992,476 $300,000 to $399,9991,539 $400,000 to $499,9992,098 $500,000 to $749,9991,294 $750,000 to $999,999269 $1,000,000 to $1,499,9996 $1,500,000 to $1,999,99924 $2,000,000 or moreRent paid by renters in 2022 in Gallatin, TN 95 Less than $10043 $150 to $19925 $200 to $249178 $250 to $299115 $300 to $349215 $350 to $39918 $400 to $44981 $450 to $49981 $500 to $54997 $550 to $599147 $600 to $649124 $650 to $699317 $700 to $749134 $750 to $799369 $800 to $899258 $900 to $9992,073 $1,000 to $1,2491,041 $1,250 to $1,4991,080 $1,500 to $1,999371 $2,000 to $2,49933 $2,500 to $2,99931 $3,500 or more336 No cash rent
Percentage of workers working in this county: 68.9%Number of people working at home: 4,454 (19.8% of all workers )
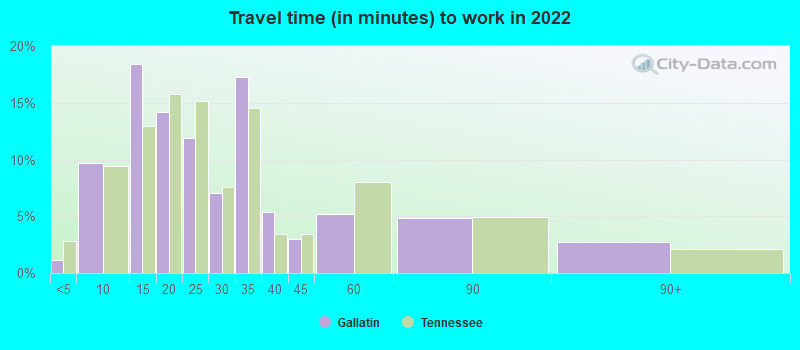
Travel time to work (commute)
Less than 5 minutes: 3255 to 9 minutes: 1,88110 to 14 minutes: 3,56415 to 19 minutes: 2,17120 to 24 minutes: 1,47325 to 29 minutes: 1,07130 to 34 minutes: 2,58835 to 39 minutes: 1,04940 to 44 minutes: 56745 to 59 minutes: 2,08060 to 89 minutes: 1,33090 or more minutes: 106
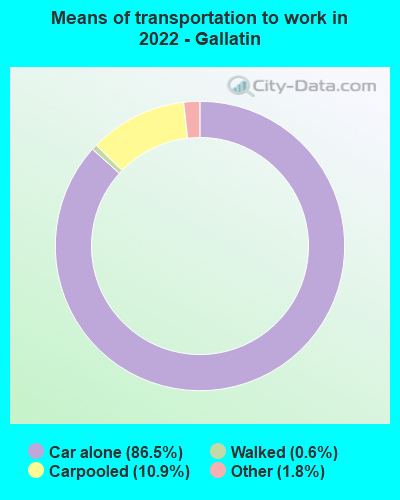
Means of transportation to work:
Drove a car alone: 20,228 (73.9%)Carpooled: 2,702 (9.9%)Taxi: 532 (1.9%)Bicycle: 26 (0.1%)Walked: 146 (0.5%)Worked at home: 3,887 (14.2%)
Unemployment by race in 2022
Unemployment rate for White non-Hispanic residents 1.1% Males1.8% FemalesUnemployment rate for Black residents 7.7% Males2.0% FemalesUnemployment rate for American Indian and Alaska Native residents 47.8% MalesUnemployment rate for Asian residents 5.8% MalesUnemployment rate for other race residents 24.6% FemalesUnemployment rate for two or more race residents 0.6% Males2.0% FemalesUnemployment rate for Hispanic or Latino residents 3.4% Males7.6% Females
Year of entry for the foreign-born population in Gallatin, Tennessee
1,409 2010 or later 651 2000 to 2009 439 1990 to 1999 133 1980 to 1989 42 1970 to 1979 42 Before 1970
First ancestries reported:
American: 5,345 (21.7%)
English: 2,930 (11.9%)
Irish: 1,523 (6.2%)
German: 1,305 (5.3%)
European: 808 (3.3%)
Italian: 392 (1.6%)
Scottish: 329 (1.3%)
French: 290 (1.2%)
Scotch-Irish: 218 (0.9%)
African: 159 (0.6%)
Ghanaian: 124 (0.5%)
British: 91 (0.4%)
Norwegian: 89 (0.4%)
Eastern European: 89 (0.4%)
Albanian: 89 (0.4%)
Polish: 75 (0.3%)
Greek: 69 (0.3%)
Swedish: 67 (0.3%)
Scandinavian: 66 (0.3%)
French Canadian: 58 (0.2%)
Pennsylvania German: 40 (0.2%)
Russian: 34 (0.1%)
Dutch: 33 (0.1%)
Danish: 31 (0.1%)
Northern European: 24 (0.10%)
Swiss: 24 (0.10%)
Belizean: 21 (0.09%)
Czech: 16 (0.06%)
Slovak: 15 (0.06%)
Welsh: 11 (0.04%)
Hungarian: 10 (0.04%)
Celtic: 8 (0.03%)
Nigerian: 6 (0.02%)
Finnish: 6 (0.02%) Most common places of birth for foreign-born residents (%): Mexico Gallatin:
24.7% (697)Tennessee:
23.0% (86,435)
Japan Gallatin:
8.2% (231)Tennessee:
0.9% (3,225)
El Salvador Gallatin:
8.2% (230)Tennessee:
2.7% (10,313)
India Gallatin:
6.1% (171)Tennessee:
6.1% (23,079)
Philippines Gallatin:
4.9% (138)Tennessee:
3.1% (11,640)
Sudan Gallatin:
4.5% (128)Tennessee:
0.5% (1,793)
Cuba Gallatin:
3.2% (89)Tennessee:
1.3% (4,841)
Australia Gallatin:
2.8% (79)Tennessee:
0.3% (1,109)
Vietnam Gallatin:
2.6% (72)Tennessee:
2.4% (8,894)
Canada Gallatin:
2.5% (71)Tennessee:
2.7% (10,295)
Ghana Gallatin:
2.4% (67)Tennessee:
0.4% (1,521)
Honduras Gallatin:
2.0% (57)Tennessee:
4.6% (17,433)
England Gallatin:
1.6% (45)Tennessee:
1.2% (4,587)
Place of birth for U.S.-born residents:
This state: 21,638Other state: 22,055Northeast: 3,267Midwest: 7,499South: 9,226West: 2,114 83.3% of Gallatin residents lived in the same house 1 years ago.
Out of people who lived in different houses, 31.2% lived in this county.
Out of people who lived in different counties, 37.1% lived in Tennessee.
Gallatin:
83.3%State average:
87.0%
Education attainment for males 25 years and older:
No schooling: 277Nursery to 4th grade: 965th and 6th grade: 1057th and 8th grade: 2099th grade: 6010th grade: 19811th grade: 20012th grade, no diploma: 237High school graduate (or equivalency): 4,471Less than 1 year of college: 1,415Some college more than 1 year, no degree: 2,157Associate degree: 1,379Bachelor's degree: 3,552Master's degree: 721Professional school degree: 201Doctorate degree: 407
Education attainment for females 25 years and older:
No schooling: 186Nursery to 4th grade: 495th and 6th grade: 1167th and 8th grade: 1459th grade: 22510th grade: 18611th grade: 25912th grade, no diploma: 171High school graduate (or equivalency): 4,204Less than 1 year of college: 1,465Some college more than 1 year, no degree: 2,072Associate degree: 1,212Bachelor's degree: 3,991Master's degree: 1,688Professional school degree: 80Doctorate degree: 179
Housing units in structures:
One, detached: 11,856One, attached: 1,290Two: 7673 or 4: 6775 to 9: 95710 to 19: 1,70520 to 49: 1,24650 or more: 650Mobile homes: 877Housing units lacking complete plumbing facilities in 2022: 0.5%Housing units lacking complete kitchen facilities in 2022: 0.8%House/condo owner moved in on average 6 years ago
Renter moved in on average 3 years ago
Private vs. public school enrollment:
Students in private schools in grades 1 to 8 (elementary and middle school): 1,013 Here:
20.9%Tennessee:
15.0%
Students in private schools in grades 9 to 12 (high school): 610 Here:
27.2%Tennessee:
16.2%
Students in private undergraduate colleges: 732 Here:
33.5%Tennessee:
23.5%