Garden Grove, CA (California) Houses and Residents
Estimated median house or condo value in 2022: $811,500 (it was $194,500 in 2000 )
Garden Grove:
$811,500California:
$715,900
Lower value quartile - upper value quartile: $634,600 - $942,800Mean price in 2022: Detached houses: $835,074 Here:
$835,074State:
$988,808
Townhouses or other attached units: $604,136 Here:
$604,136State:
$838,546
In 3-to-4-unit structures: $635,906 Here:
$635,906State:
$824,253
In 5-or-more-unit structures: $506,155 Here:
$506,155State:
$730,996
Mobile homes: $131,518 Here:
$131,518State:
$184,506
Total population: 175,078 (Urban population: 165,710, Rural population: 0)
Houses: 51,820 (49,225 occupied: 26,940 owner occupied, 22,285 renter occupied )
% of renters here:
45%State:
44%
Housing density: 2,875 houses/condos per square mile
Median price asked for vacant for-sale houses and condos in 2022: $687,315.
Median contract rent in 2022: $1,873 (lower quartile is $1,462, upper quartile is over $2,000)
Median rent asked for vacant for-rent units in 2022: $4,258
Median gross rent in Garden Grove, CA in 2022: $1,961
Housing units in Garden Grove with a mortgage: 16,814 (1,720 second mortgage, 132 home equity loan, 1,386 both second mortgage and home equity loan )Houses without a mortgage: 301
Median household income for houses/condos with a mortgage: $128,250
Median household income for apartments without a mortgage: $98,015
Median monthly housing costs: $1,964
Data:
Median house or condo value ($)
Median house or condo value ($ change since 2000)
Median house or condo value ($) - White
Median house or condo value ($) - Black or African American
Median house or condo value ($) - Asian
Median house or condo value ($) - Hispanic or Latino
Median house or condo value ($) - American Indian and Alaska Native
Median house or condo value ($) - Multirace
Median house or condo value ($) - Other Race
Median price asked for mobile homes ($)
Household density (households per square mile)
Mean house or condo value by units in structure - 1, detached ($)
Mean house or condo value by units in structure - 1, attached ($)
Mean house or condo value by units in structure - 2 ($)
Mean house or condo value by units in structure by units in structure - 3 or 4 ($)
Mean house or condo value by units in structure - 5 or more ($)
Mean house or condo value by units in structure - Boat, RV, van, etc. ($)
Mean house or condo value by units in structure - Mobile home ($)
Median contract rent ($)
Median contract rent - Lower quartile ($)
Median contract rent - Upper quartile ($)
Median gross rent ($)
Urban houses (%)
Rural houses (%)
Houses occupied (%)
Houses occupied (% change since 2000)
Houses owner occupied (%)
Houses owner occupied (% change since 2000)
Houses renter occupied (%)
Houses renter occupied (% change since 2000)
Vacant housing units - For rent (%)
Vacant housing units - For rent (% change since 2000)
Vacant housing units - For sale only (%)
Vacant housing units - For sale only (% change since 2000)
Vacant housing units - Rented or sold, not occupied (%)
Vacant housing units - Rented or sold, not occupied (% change since 2000)
Vacant housing units - For seasonal, recreational, or occasional use (%)
Vacant housing units - For seasonal, recreational, or occasional use (% change since 2000)
Vacant housing units - For migrant workers (%)
Vacant housing units - For migrant workers (% change since 2000)
Vacant housing units - Other vacant (%)
Vacant housing units - Other vacant (% change since 2000)
Median monthly housing costs ($)
Median household income for houses/condos with a mortgage ($)
Median household income for houses/condos without a mortgage ($)
Median household income ($)
Median household income ($) - White
Median household income ($) - Black or African American
Median household income ($) - Asian
Median household income ($) - Hispanic or Latino
Median household income ($) - American Indian and Alaska Native
Median household income ($) - Multirace
Median household income ($) - Other Race
Mortgage status - with mortgage (%)
Mortgage status - with second mortgage (%)
Mortgage status - with home equity loan (%)
Mortgage status - with both second mortgage and home equity loan (%)
Mortgage status - without a mortgage (%)
Median year house/condo built
Median year apartment built
Household type by relationship - Male householder living alone (%)
Household type by relationship - Male householder not living alone (%)
Household type by relationship - Female householder living alone (%)
Household type by relationship - Female householder not living alone (%)
Household type by relationship - Opposite-Sex spouse (%)
Household type by relationship - Same-Sex spouse (%)
Household type by relationship - Opposite-Sex unmarried partner (%)
Household type by relationship - Same-Sex unmarried partner (%)
Household type by relationship - In group quarters (%)
Size of family households - 2-person household (%)
Size of family households - 3-person household (%)
Size of family households - 4-person household (%)
Size of family households - 5-person household (%)
Size of family households - 6-person household (%)
Size of family households - 7-or-more-person household (%)
Size of nonfamily households - 1-person household (%)
Size of nonfamily households - 2-person household (%)
Size of nonfamily households - 3-person household (%)
Size of nonfamily households - 4-person household (%)
Size of nonfamily households - 5-person household (%)
Size of nonfamily households - 6-person household (%)
Size of nonfamily households - 7-or-moreperson household (%)
Year house built - Built 2010 or later (%)
Year house built - Built 2000 to 2009 (%)
Year house built - Built 1990 to 1999 (%)
Year house built - Built 1980 to 1989 (%)
Year house built - Built 1970 to 1979 (%)
Year house built - Built 1960 to 1969 (%)
Year house built - Built 1950 to 1959 (%)
Year house built - Built 1940 to 1949 (%)
Year house built - Built 1939 or earlier (%)
Median number of rooms in houses and condos
Median number of rooms in apartments
Median number of bedrooms in owner occupied houses
Mean number of bedrooms in owner occupied houses
Median number of bedrooms in renter occupied houses
Mean number of bedrooms in renter occupied houses
Median number of vehichles in owner occupied houses
Mean number of vehichles in owner occupied houses
Median number of vehichles in renter occupied houses
Mean number of vehichles in renter occupied houses
Rooms in owner-occupied houses - 1 room (%)
Rooms in owner-occupied houses - 2 rooms (%)
Rooms in owner-occupied houses - 3 rooms (%)
Rooms in owner-occupied houses - 4 rooms (%)
Rooms in owner-occupied houses - 5 rooms (%)
Rooms in owner-occupied houses - 6 rooms (%)
Rooms in owner-occupied houses - 7 rooms (%)
Rooms in owner-occupied houses - 8 rooms (%)
Rooms in owner-occupied houses - 9+ rooms (%)
Rooms in renter-occupied houses - 1 room (%)
Rooms in renter-occupied houses - 2 rooms (%)
Rooms in renter-occupied houses - 3 rooms (%)
Rooms in renter-occupied houses - 4 rooms (%)
Rooms in renter-occupied houses - 5 rooms (%)
Rooms in renter-occupied houses - 6 rooms (%)
Rooms in renter-occupied houses - 7 rooms (%)
Rooms in renter-occupied houses - 8 rooms (%)
Rooms in renter-occupied houses - 9+ rooms (%)
Bedrooms in owner-occupied houses - no bedrooms (%)
Bedrooms in owner-occupied houses - 1 bedroom (%)
Bedrooms in owner-occupied houses - 2 bedrooms (%)
Bedrooms in owner-occupied houses - 3 bedrooms (%)
Bedrooms in owner-occupied houses - 4 bedrooms (%)
Bedrooms in owner-occupied houses - 5+ bedrooms (%)
Bedrooms in renter-occupied houses - no bedrooms (%)
Bedrooms in renter-occupied houses - 1 bedroom (%)
Bedrooms in renter-occupied houses - 2 bedrooms (%)
Bedrooms in renter-occupied houses - 3 bedrooms (%)
Bedrooms in renter-occupied houses - 4 bedrooms (%)
Bedrooms in renter-occupied houses - 5+ bedrooms (%)
Vehicles available in owner-occupied houses - no vehicle available (%)
Vehicles available in owner-occupied houses - 1 vehicle available(%)
Vehicles available in owner-occupied houses - 2 Vehicles available (%)
Vehicles available in owner-occupied houses - 3 Vehicles available (%)
Vehicles available in owner-occupied houses - 4 Vehicles available (%)
Vehicles available in owner-occupied houses - 5+ Vehicles available (%)
Vehicles available in renter-occupied houses - no vehicle available (%)
Vehicles available in renter-occupied houses - 1 vehicle available (%)
Vehicles available in renter-occupied houses - 2 Vehicles available (%)
Vehicles available in renter-occupied houses - 3 Vehicles available (%)
Vehicles available in renter-occupied houses - 4 Vehicles available (%)
Vehicles available in renter-occupied houses - 5+ Vehicles available (%)
Housing units in structures - 1, detached (%)
Housing units in structures - 1, attached (%)
Housing units in structures - 2 (%)
Housing units in structures - 3 or 4 (%)
Housing units in structures - 5 to 9 (%)
Housing units in structures - 10 to 19 (%)
Housing units in structures - 20 to 49 (%)
Housing units in structures - 50 or more (%)
Housing units in structures - Mobile home (%)
Housing units in structures - Boat, RV, van, etc. (%)
Housing units in structures - Owners - 1, detached (%)
Housing units in structures - Owners - 1, attached (%)
Housing units in structures - Owners - 2 (%)
Housing units in structures - Owners - 3 or 4 (%)
Housing units in structures - Owners - 5 to 9 (%)
Housing units in structures - Owners - 10 to 19 (%)
Housing units in structures - Owners - 20 to 49 (%)
Housing units in structures - Owners - 50 or more (%)
Housing units in structures - Owners - Mobile home (%)
Housing units in structures - Owners - Boat, RV, van, etc. (%)
Housing units in structures - Renters - 1, detached (%)
Housing units in structures - Renters - 1, attached (%)
Housing units in structures - Renters - 2 (%)
Housing units in structures - Renters - 3 or 4 (%)
Housing units in structures - Renters - 5 to 9 (%)
Housing units in structures - Renters - 10 to 19 (%)
Housing units in structures - Renters - 20 to 49 (%)
Housing units in structures - Renters - 50 or more (%)
Housing units in structures - Renters - Mobile home (%)
Housing units in structures - Renters - Boat, RV, van, etc. (%)
House/condo owner moved in on average (years ago)
Renter moved in on average (years ago)
Year householder moved into unit - Moved in 1999 to March 2000 (%)
Year householder moved into unit - Moved in 1999 to March 2000 (%) - White
Year householder moved into unit - Moved in 1999 to March 2000 (%) - Black or African American
Year householder moved into unit - Moved in 1999 to March 2000 (%) - Asian
Year householder moved into unit - Moved in 1999 to March 2000 (%) - Hispanic or Latino
Year householder moved into unit - Moved in 1999 to March 2000 (%) - American Indian and Alaska Native
Year householder moved into unit - Moved in 1999 to March 2000 (%) - Multirace
Year householder moved into unit - Moved in 1999 to March 2000 (%) - Other Race
Year householder moved into unit - Moved in 1995 to 1998 (%)
Year householder moved into unit - Moved in 1995 to 1998 (%) - White
Year householder moved into unit - Moved in 1995 to 1998 (%) - Black or African American
Year householder moved into unit - Moved in 1995 to 1998 (%) - Asian
Year householder moved into unit - Moved in 1995 to 1998 (%) - Hispanic or Latino
Year householder moved into unit - Moved in 1995 to 1998 (%) - American Indian and Alaska Native
Year householder moved into unit - Moved in 1995 to 1998 (%) - Multirace
Year householder moved into unit - Moved in 1995 to 1998 (%) - Other Race
Year householder moved into unit - Moved in 1990 to 1994 (%)
Year householder moved into unit - Moved in 1990 to 1994 (%) - White
Year householder moved into unit - Moved in 1990 to 1994 (%) - Black or African American
Year householder moved into unit - Moved in 1990 to 1994 (%) - Asian
Year householder moved into unit - Moved in 1990 to 1994 (%) - Hispanic or Latino
Year householder moved into unit - Moved in 1990 to 1994 (%) - American Indian and Alaska Native
Year householder moved into unit - Moved in 1990 to 1994 (%) - Multirace
Year householder moved into unit - Moved in 1990 to 1994 (%) - Other Race
Year householder moved into unit - Moved in 1980 to 1989 (%)
Year householder moved into unit - Moved in 1980 to 1989 (%) - White
Year householder moved into unit - Moved in 1980 to 1989 (%) - Black or African American
Year householder moved into unit - Moved in 1980 to 1989 (%) - Asian
Year householder moved into unit - Moved in 1980 to 1989 (%) - Hispanic or Latino
Year householder moved into unit - Moved in 1980 to 1989 (%) - American Indian and Alaska Native
Year householder moved into unit - Moved in 1980 to 1989 (%) - Multirace
Year householder moved into unit - Moved in 1980 to 1989 (%) - Other Race
Year householder moved into unit - Moved in 1970 to 1979 (%)
Year householder moved into unit - Moved in 1970 to 1979 (%) - White
Year householder moved into unit - Moved in 1970 to 1979 (%) - Black or African American
Year householder moved into unit - Moved in 1970 to 1979 (%) - Asian
Year householder moved into unit - Moved in 1970 to 1979 (%) - Hispanic or Latino
Year householder moved into unit - Moved in 1970 to 1979 (%) - American Indian and Alaska Native
Year householder moved into unit - Moved in 1970 to 1979 (%) - Multirace
Year householder moved into unit - Moved in 1970 to 1979 (%) - Other Race
Year householder moved into unit - Moved in 1969 or earlier (%)
Year householder moved into unit - Moved in 1969 or earlier (%) - White
Year householder moved into unit - Moved in 1969 or earlier (%) - Black or African American
Year householder moved into unit - Moved in 1969 or earlier (%) - Asian
Year householder moved into unit - Moved in 1969 or earlier (%) - Hispanic or Latino
Year householder moved into unit - Moved in 1969 or earlier (%) - American Indian and Alaska Native
Year householder moved into unit - Moved in 1969 or earlier (%) - Multirace
Year householder moved into unit - Moved in 1969 or earlier (%) - Other Race
Housing units lacking complete plumbing facilities (%)
Housing units lacking complete kitchen facilities (%)
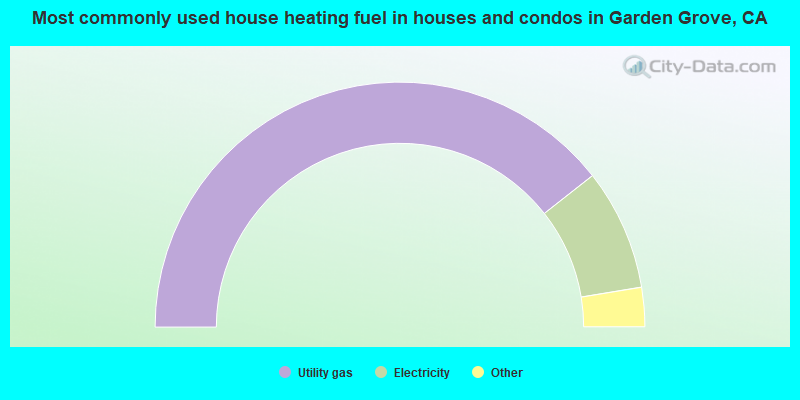
House heating fuel used in houses and condos - Utility gas (%)
House heating fuel used in houses and condos - Bottled, tank, or LP gas (%)
House heating fuel used in houses and condos - Electricity (%)
House heating fuel used in houses and condos - Fuel oil, kerosene, etc. (%)
House heating fuel used in houses and condos - Coal or coke (%)
House heating fuel used in houses and condos - Wood (%)
House heating fuel used in houses and condos - Solar energy (%)
House heating fuel used in houses and condos - Other fuel (%)
House heating fuel used in houses and condos - No fuel used (%)
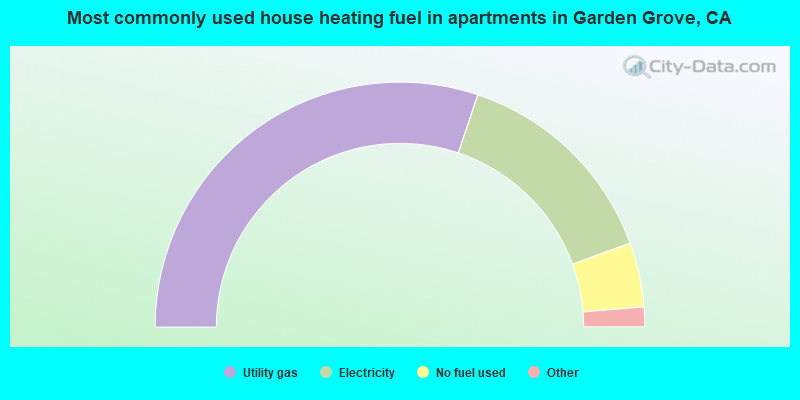
House heating fuel used in apartments - Utility gas (%)
House heating fuel used in apartments - Bottled, tank, or LP gas (%)
House heating fuel used in apartments - Electricity (%)
House heating fuel used in apartments - Fuel oil, kerosene, etc. (%)
House heating fuel used in apartments - Coal or coke (%)
House heating fuel used in apartments - Wood (%)
House heating fuel used in apartments - Solar energy (%)
House heating fuel used in apartments - Other fuel (%)
House heating fuel used in apartments - No fuel used (%)
Median year house/condo built: 1961Median year apartment built: 1972Household type by relationship:
Households: 169,265
Male householders: 25,015 (3,186 living alone ), Female householders: 24,210 (5,387 living alone )25,192 spouses (24,926 opposite-sex spouses ), 3,048 unmarried partners , (2,906 opposite-sex unmarried partners ), 51,357 children (49,307 natural , 591 adopted , 1,459 stepchildren ), 5,984 grandchildren , 6,169 brothers or sisters , 7,048 parents , 0 foster children , 8,098 other relatives , 10,580 non-relatives In group quarters: 2,564
Size of family households: 9,611 2-persons , 9,865 3-persons , 7,331 4-persons , 4,154 5-persons , 2,683 6-persons , 3,643 7-or-more-persons .
Size of nonfamily households: 8,573 1-person , 2,317 2-persons , 566 3-persons , 87 4-persons , 142 5-persons , 135 6-persons , 118 7-or-more-persons .
18,005 married couples with children. single-parent households (1,260 men , 5,831 women ).
29.6% of residents of Garden Grove speak English at home. of residents speak Spanish at home (60% speak English very well , 20% speak English well , 15% speak English not well , 5% don't speak English at all ).of residents speak other Indo-European language at home (53% speak English very well , 36% speak English well , 8% speak English not well , 3% don't speak English at all ).of residents speak Asian or Pacific Island language at home (40% speak English very well , 26% speak English well , 27% speak English not well , 7% don't speak English at all ).of residents speak other language at home (29% speak English well , 71% don't speak English at all ).
Foreign born population: 75,540 (44.6%)of them are naturalized citizens )
Median number of rooms in houses and condos:
Median number of rooms in apartments
Owner-occupied Renter-occupied
Bedrooms in owner-occupied houses and condos in Garden Grove, California
202 no bedroom 501 1 bedroom 2,854 2 bedrooms 12,078 3 bedrooms 10,088 4 bedrooms 1,217 5+ bedrooms
Bedrooms in renter-occupied apartments in Garden Grove, California
1,229 no bedroom 5,582 1 bedroom 8,254 2 bedrooms 4,431 3 bedrooms 2,278 4 bedrooms 511 5+ bedrooms
Owner-occupied Renter-occupied
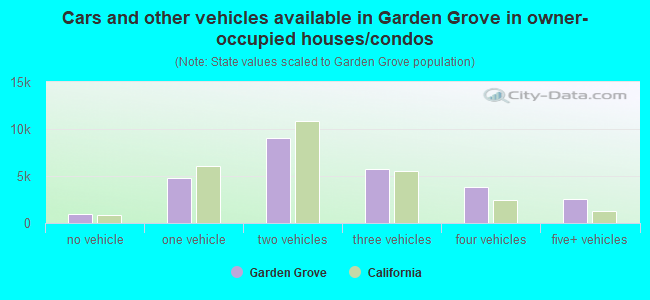
Cars and other vehicles available in Garden Grove in owner-occupied houses/condos
937 no vehicle 4,779 1 vehicle 9,016 2 vehicles 5,782 3 vehicles 3,845 4 vehicles 2,581 5+ vehicles
Cars and other vehicles available in Garden Grove in renter-occupied apartments
1,754 no vehicle 6,357 1 vehicle 9,096 2 vehicles 3,363 3 vehicles 1,297 4 vehicles 418 5+ vehicles
Owner-occupied Renter-occupied
Rooms in owner-occupied houses in Garden Grove, California
160 1 room 101 2 rooms 894 3 rooms 3,263 4 rooms 7,864 5 rooms 7,429 6 rooms 3,935 7 rooms 2,092 8 rooms 1,202 9+ rooms
Rooms in renter-occupied apartments in Garden Grove, California
1,192 1 room 1,859 2 rooms 5,907 3 rooms 5,794 4 rooms 2,486 5 rooms 2,880 6 rooms 805 7 rooms 928 8 rooms 434 9+ rooms
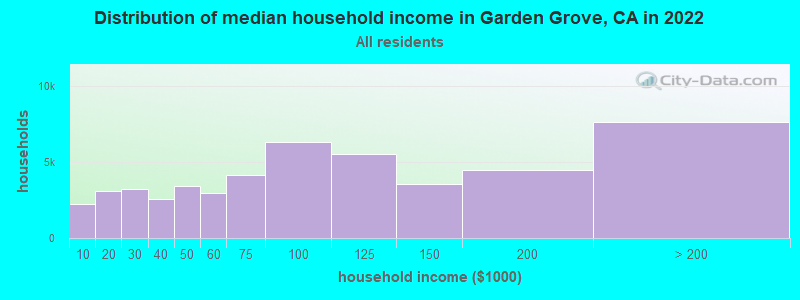
Garden Grove, CA household income distribution 2,267 Less than $10,0003,074 $10,000 to $19,9993,224 $20,000 to $29,9992,546 $30,000 to $39,9993,428 $40,000 to $49,9992,976 $50,000 to $59,9994,126 $60,000 to $74,9996,341 $75,000 to $99,9995,559 $100,000 to $124,9993,529 $125,000 to $149,9994,509 $150,000 to $199,9997,646 $200,000 or more
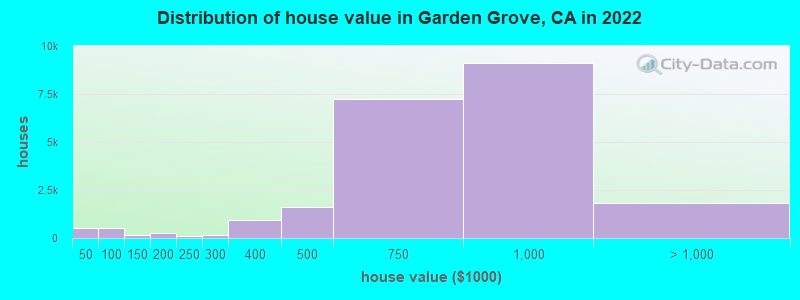
Home value of owner - occupied houses in 2022 in Garden Grove, CA 308 Less than $10,00038 $10,000 to $14,99910 $15,000 to $19,99918 $20,000 to $24,99933 $25,000 to $29,99913 $30,000 to $34,9993 $35,000 to $39,99986 $40,000 to $49,999115 $50,000 to $59,99943 $60,000 to $69,99972 $70,000 to $79,99998 $80,000 to $89,99987 $90,000 to $99,999117 $100,000 to $124,99942 $125,000 to $149,999224 $150,000 to $174,99946 $175,000 to $199,999104 $200,000 to $249,999141 $250,000 to $299,999931 $300,000 to $399,9991,604 $400,000 to $499,9997,227 $500,000 to $749,9999,116 $750,000 to $999,9991,390 $1,000,000 to $1,499,99991 $1,500,000 to $1,999,999346 $2,000,000 or moreRent paid by renters in 2022 in Garden Grove, CA 7 Less than $10074 $100 to $149352 $150 to $199265 $200 to $249234 $250 to $299376 $300 to $34949 $350 to $399181 $400 to $44964 $450 to $499110 $500 to $549122 $550 to $599169 $600 to $64951 $650 to $69985 $700 to $749134 $750 to $799270 $800 to $899170 $900 to $9991,753 $1,000 to $1,2492,500 $1,250 to $1,4997,000 $1,500 to $1,9994,152 $2,000 to $2,4992,339 $2,500 to $2,9991,037 $3,000 to $3,499556 $3,500 or more630 No cash rent
Percentage of workers working in this county: 88.6%Number of people working at home: 10,049 (11.5% of all workers )
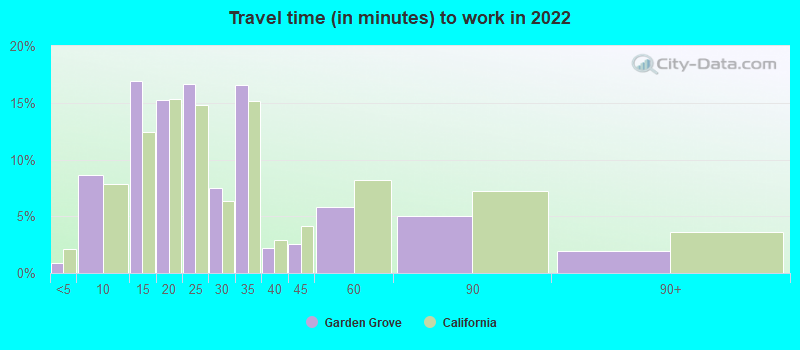
Travel time to work (commute)
Less than 5 minutes: 2805 to 9 minutes: 3,07710 to 14 minutes: 9,26815 to 19 minutes: 9,93620 to 24 minutes: 13,26125 to 29 minutes: 5,76830 to 34 minutes: 18,15735 to 39 minutes: 3,08640 to 44 minutes: 3,15245 to 59 minutes: 6,40160 to 89 minutes: 3,30890 or more minutes: 1,780
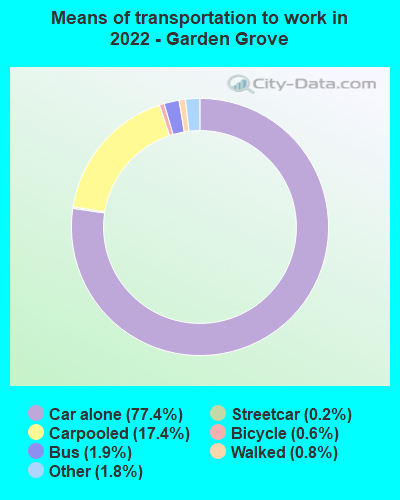
Means of transportation to work:
Drove a car alone: 33,032 (62.6%)Carpooled: 7,438 (14.1%)Bus : 830 (1.6%)Subway or elevated rail : 76 (0.1%)Taxi: 768 (1.5%)Bicycle: 238 (0.5%)Walked: 322 (0.6%)Worked at home: 10,049 (19.0%)
Unemployment by race in 2022
Unemployment rate for White non-Hispanic residents 2.3% Males0.7% FemalesUnemployment rate for American Indian and Alaska Native residents 8.6% MalesUnemployment rate for Asian residents 5.6% Males3.6% FemalesUnemployment rate for other race residents 2.5% Males5.0% FemalesUnemployment rate for two or more race residents 5.4% Males3.7% FemalesUnemployment rate for Hispanic or Latino residents 4.3% Males5.3% Females
Year of entry for the foreign-born population in Garden Grove, California
14,820 2010 or later 16,795 2000 to 2009 19,044 1990 to 1999 25,899 1980 to 1989 9,936 1970 to 1979 3,631 Before 1970
First ancestries reported:
American: 8,885 (8.6%)
German: 1,766 (1.7%)
English: 1,132 (1.1%)
Irish: 1,076 (1.0%)
Italian: 827 (0.8%)
European: 776 (0.7%)
Turkish: 281 (0.3%)
Polish: 239 (0.2%)
Ethiopian: 220 (0.2%)
Swedish: 218 (0.2%)
Assyrian: 213 (0.2%)
Egyptian: 206 (0.2%)
Iranian: 180 (0.2%)
Norwegian: 174 (0.2%)
French: 157 (0.2%)
Dutch: 146 (0.1%)
Afghan: 144 (0.1%)
Iraqi: 144 (0.1%)
Scottish: 133 (0.1%)
Portuguese: 128 (0.1%)
Ukrainian: 103 (0.10%)
Hungarian: 102 (0.10%)
Armenian: 95 (0.09%)
Northern European: 93 (0.09%)
German Russian: 90 (0.09%)
Romanian: 82 (0.08%)
Arab: 76 (0.07%)
Estonian: 75 (0.07%)
Scotch-Irish: 75 (0.07%)
Syrian: 62 (0.06%)
Eastern European: 60 (0.06%)
Canadian: 56 (0.05%)
Scandinavian: 43 (0.04%)
Czech: 42 (0.04%)
Greek: 40 (0.04%)
Welsh: 37 (0.04%)
Russian: 36 (0.03%)
Trinidadian and Tobagonian: 35 (0.03%)
Belgian: 32 (0.03%)
Finnish: 29 (0.03%)
British: 29 (0.03%)
Palestinian: 23 (0.02%)
Yugoslavian: 23 (0.02%)
Danish: 18 (0.02%)
Lebanese: 17 (0.02%)
Austrian: 17 (0.02%)
Brazilian: 14 (0.01%)
Swiss: 14 (0.01%)
Croatian: 11 (0.01%)
Nigerian: 11 (0.01%)
African: 11 (0.01%)
Slovak: 10 (0.01%)
Jamaican: 7 (0.01%)
French Canadian: 6 (0.01%)
Slavic: 6 (0.01%)
Most common places of birth for foreign-born residents (%): Vietnam Garden Grove:
53.6% (41,125)California:
4.9% (512,335)
Mexico Garden Grove:
25.3% (19,395)California:
37.2% (3,881,193)
Korea Garden Grove:
4.2% (3,255)California:
3.0% (315,248)
Philippines Garden Grove:
3.8% (2,938)California:
7.8% (818,297)
Place of birth for U.S.-born residents:
This state: 81,252Other state: 9,996Northeast: 1,888Midwest: 3,821South: 2,052West: 2,235 93.7% of Garden Grove residents lived in the same house 1 years ago.
Out of people who lived in different houses, 42.8% lived in this county.
Out of people who lived in different counties, 74.5% lived in California.
Garden Grove:
93.7%State average:
88.9%
Education attainment for males 25 years and older:
No schooling: 4,675Nursery to 4th grade: 1,1265th and 6th grade: 2,1977th and 8th grade: 6209th grade: 1,15710th grade: 59611th grade: 62812th grade, no diploma: 3,098High school graduate (or equivalency): 15,895Less than 1 year of college: 4,308Some college more than 1 year, no degree: 6,964Associate degree: 4,084Bachelor's degree: 11,944Master's degree: 2,571Professional school degree: 744Doctorate degree: 222
Education attainment for females 25 years and older:
No schooling: 5,979Nursery to 4th grade: 1,2035th and 6th grade: 1,6457th and 8th grade: 7289th grade: 97310th grade: 1,35211th grade: 1,01412th grade, no diploma: 2,701High school graduate (or equivalency): 14,532Less than 1 year of college: 3,752Some college more than 1 year, no degree: 6,104Associate degree: 3,598Bachelor's degree: 9,978Master's degree: 3,074Professional school degree: 1,744Doctorate degree: 790
Housing units in structures:
One, detached: 28,700One, attached: 4,918Two: 6933 or 4: 3,6575 to 9: 3,06310 to 19: 2,09320 to 49: 3,28950 or more: 3,796Mobile homes: 1,552Boats, RVs, vans, etc.: 59Median worth of mobile homes: $145,500
Housing units lacking complete plumbing facilities in 2022: 1.0%Housing units lacking complete kitchen facilities in 2022: 3.7%House/condo owner moved in on average 18 years ago
Renter moved in on average 4 years ago
Private vs. public school enrollment:
Students in private schools in grades 1 to 8 (elementary and middle school): 767 Here:
5.0%California:
10.5%
Students in private schools in grades 9 to 12 (high school): 167 Students in private undergraduate colleges: 773 Here:
7.3%California:
15.9%